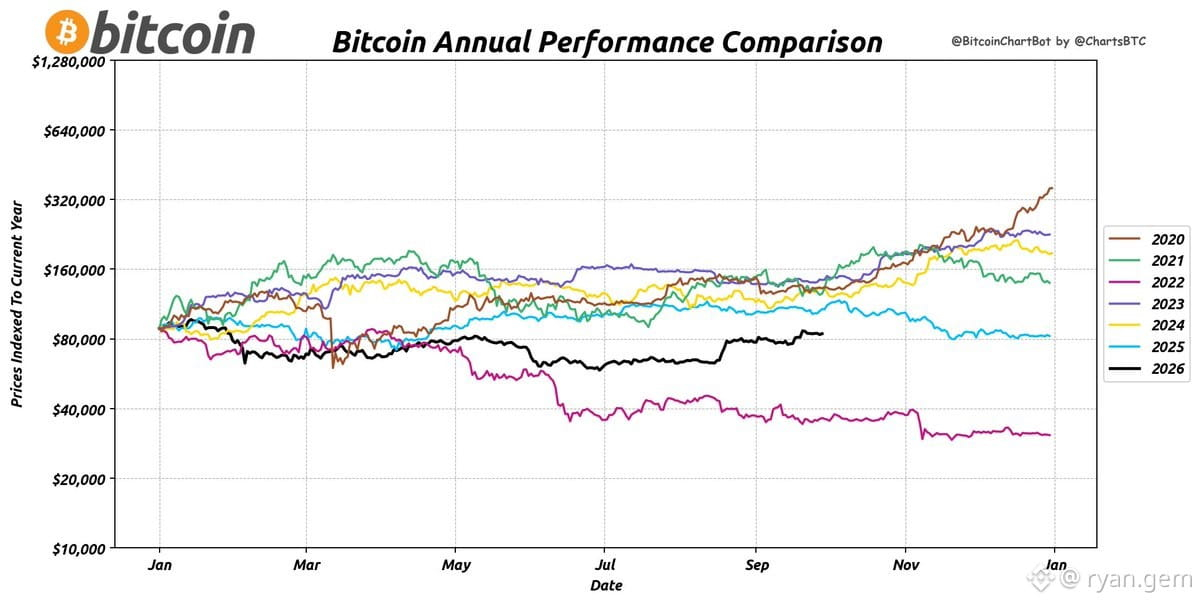
Indexed $BTC price history by year (as of 09/29/2026)
This chart format makes it dead simple to compare performance across cycles. Notice how the magnitude of gains compresses over time—classic diminishing returns as market cap grows.
Key pattern: Early years = explosive 10x+ moves. Recent cycles = more institutional, slower grinds with 2-4x peaks.
If you're expecting 2017-style parabolic runs, you're playing the wrong game. Position size and timing matter more than ever in mature $BTC cycles.
This chart format makes it dead simple to compare performance across cycles. Notice how the magnitude of gains compresses over time—classic diminishing returns as market cap grows.
Key pattern: Early years = explosive 10x+ moves. Recent cycles = more institutional, slower grinds with 2-4x peaks.
If you're expecting 2017-style parabolic runs, you're playing the wrong game. Position size and timing matter more than ever in mature $BTC cycles.