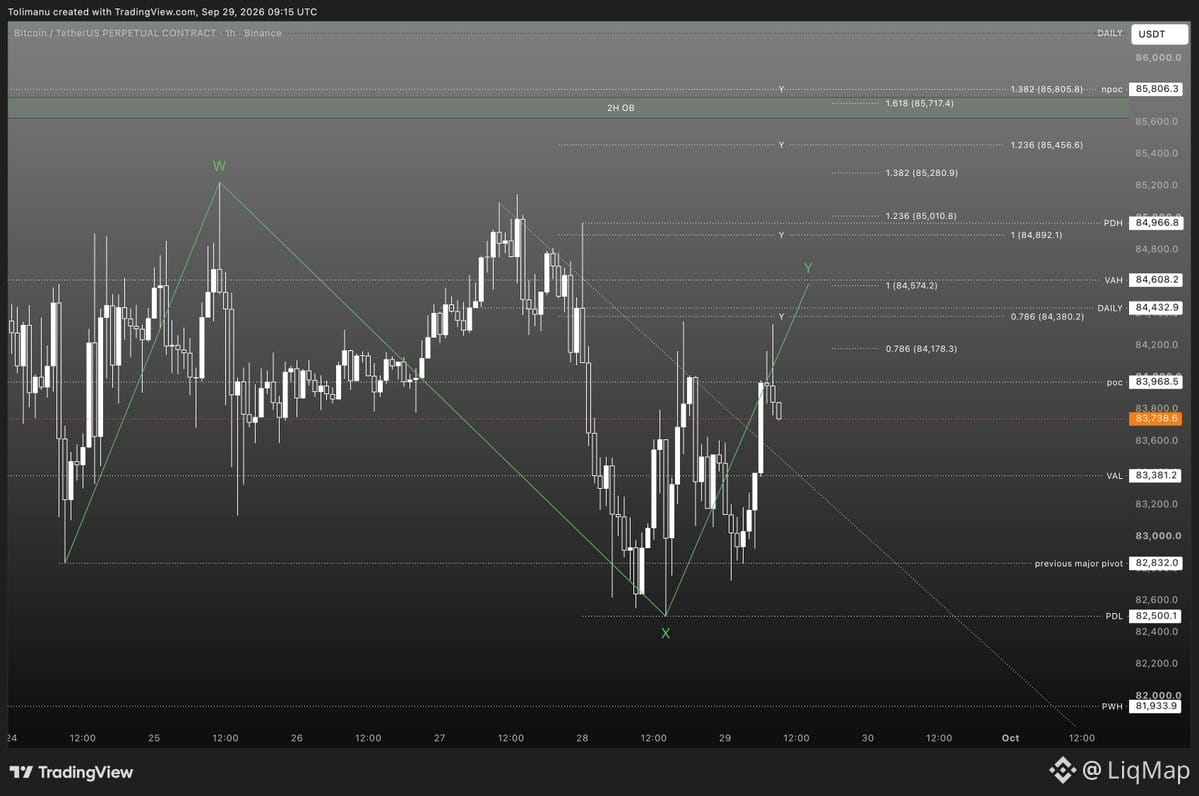
$BTC chart read: tracking a WXY correction scenario with marked termination zones
Looking at potential bounce levels if this plays out — classic ABC-X-ABC structure. The lower boxes show where wave Y might exhaust. If we knife down into those zones with a liquidation flush and OI reset, that's where I'm watching for a reversal setup.
Pure price action speculation here. Not calling the exact bottom, just mapping where the structure could complete. If funding stays negative and shorts pile in near those levels, that's the squeeze fuel.
Watch the derivatives stack when we get there — if OI spikes into the zone and then suddenly drops with a wick, that's your signal. Timing the entry off celestial windows if we hit mid-late week.
No guarantees, just the map. Trade your own risk.
Looking at potential bounce levels if this plays out — classic ABC-X-ABC structure. The lower boxes show where wave Y might exhaust. If we knife down into those zones with a liquidation flush and OI reset, that's where I'm watching for a reversal setup.
Pure price action speculation here. Not calling the exact bottom, just mapping where the structure could complete. If funding stays negative and shorts pile in near those levels, that's the squeeze fuel.
Watch the derivatives stack when we get there — if OI spikes into the zone and then suddenly drops with a wick, that's your signal. Timing the entry off celestial windows if we hit mid-late week.
No guarantees, just the map. Trade your own risk.