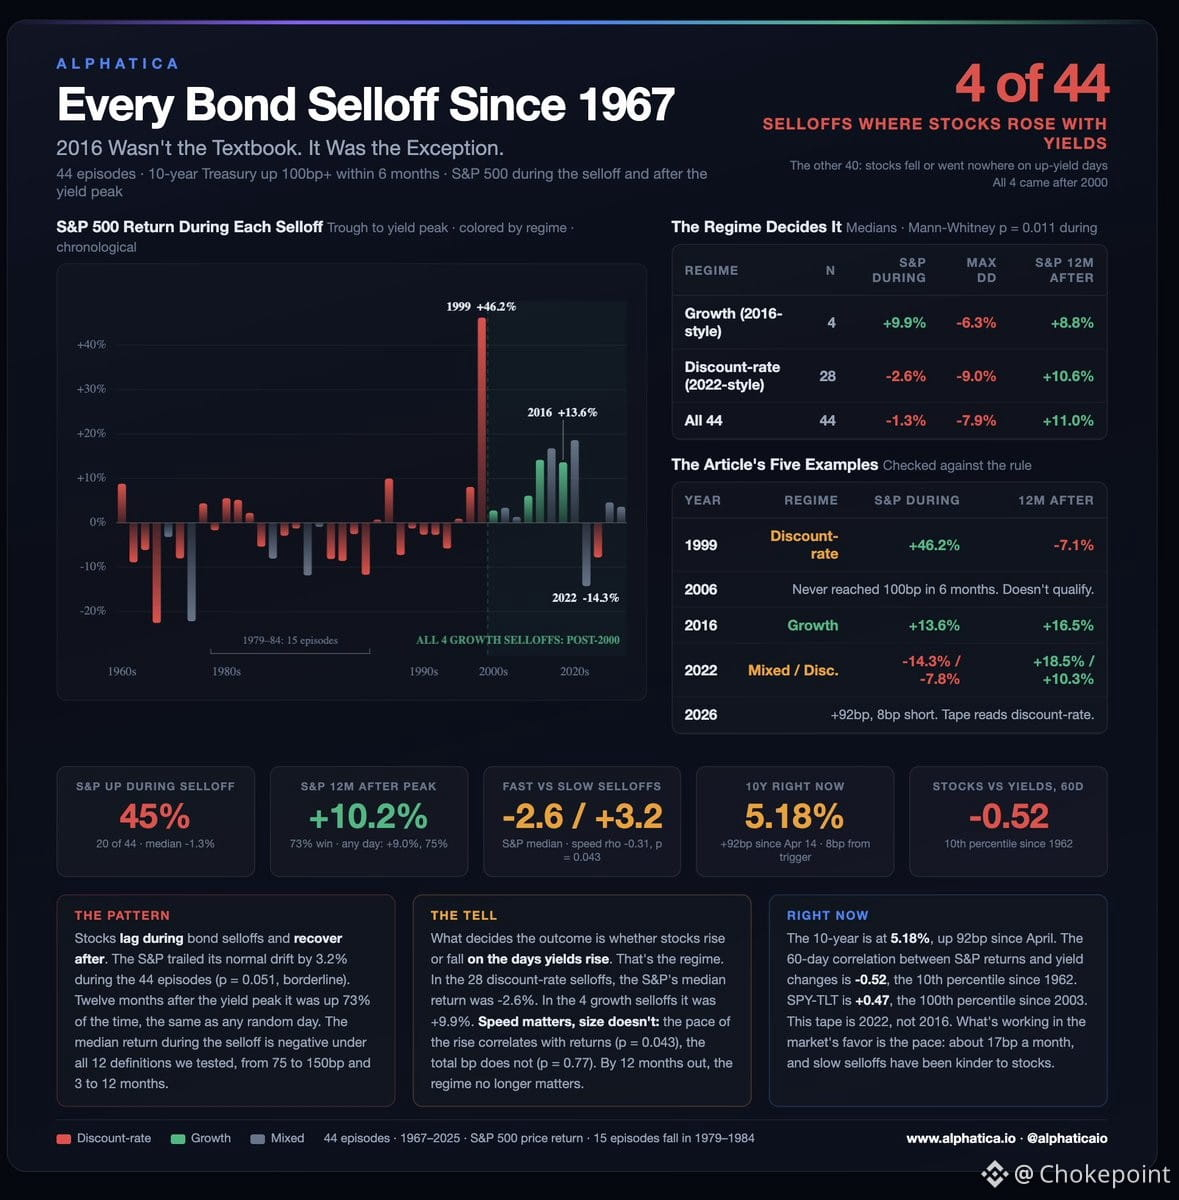
The 10-year just crossed 5.20%. Everyone's calling it 2016 — yields and stocks rising together. We ran the tape back to 1962. That almost never happens.
We pulled every instance where the 10-year spiked 100bp+ in six months. Found 44. In 28 of them, stocks fell on the days yields climbed. Rising rates were a drag, and equities paid the price.
Only 4 times did stocks and yields rise together. 2016 was one of those four outliers.
The numbers while yields were climbing:
• Stocks rose with yields: +9.9%
• Stocks fell as yields rose: -2.6%
• All 44 episodes: -1.3%, positive only 45% of the time (medians)
What happened after yields topped? $SPY was higher a year later 73% of the time, averaging +10.2%. That's a normal year. The damage happens during the climb and fades once rates peak.
So which kind is this? Right now stocks are falling on the days yields rise. The 60-day correlation is more negative than 90% of all readings since 1962. This looks like the common pattern, not 2016.
Two things could shift it:
1. Yields stop rising. Historically, that's when stocks recover.
2. The pace stays slow. Yields are up 92bp since April — about 17bp a month. Slow selloffs have been easier on equities than fast ones.
This isn't a crash signal. It's a headwind. Expect stocks to lag while yields climb. Watch for the peak.
$SPY $QQQ $TLT
We pulled every instance where the 10-year spiked 100bp+ in six months. Found 44. In 28 of them, stocks fell on the days yields climbed. Rising rates were a drag, and equities paid the price.
Only 4 times did stocks and yields rise together. 2016 was one of those four outliers.
The numbers while yields were climbing:
• Stocks rose with yields: +9.9%
• Stocks fell as yields rose: -2.6%
• All 44 episodes: -1.3%, positive only 45% of the time (medians)
What happened after yields topped? $SPY was higher a year later 73% of the time, averaging +10.2%. That's a normal year. The damage happens during the climb and fades once rates peak.
So which kind is this? Right now stocks are falling on the days yields rise. The 60-day correlation is more negative than 90% of all readings since 1962. This looks like the common pattern, not 2016.
Two things could shift it:
1. Yields stop rising. Historically, that's when stocks recover.
2. The pace stays slow. Yields are up 92bp since April — about 17bp a month. Slow selloffs have been easier on equities than fast ones.
This isn't a crash signal. It's a headwind. Expect stocks to lag while yields climb. Watch for the peak.
$SPY $QQQ $TLT