DAILY SIGNAL — SOL/USDT
📊 Market Bias
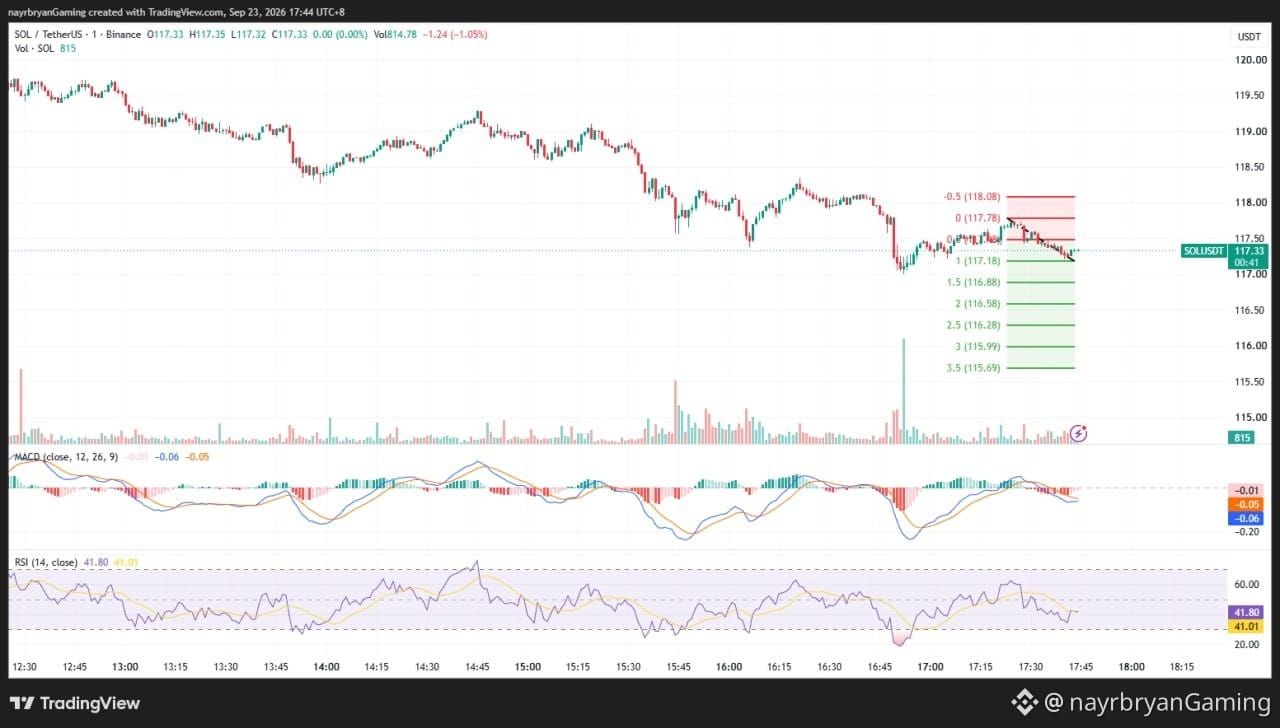
SOL is currently trading around 117.33 inside a descending channel.
Price recently rejected the 117.75–117.76 purple structure zone and is now trading below the key 117.75 area.
Short-term momentum has weakened, with price moving toward the lower Fibonacci levels.
🔹 Key Levels From Chart
Current Price:
117.33
Key Resistance / Reclaim:
117.75 → 117.76
Upper Fibonacci Reference:
118.08
Key Breakdown Area:
117.18
🎯 Downside Fibonacci Levels
TP1 → 117.18 — 1.0 Fib
TP2 → 116.88 — 1.5 Fib
TP3 → 116.58 — 2.0 Fib
TP4 → 116.28 — 2.5 Fib
TP5 → 115.98 — 3.0 Fib
TP6 → 115.69 — 3.5 Fib
📈 Technical Breakdown
SOL remains inside the descending blue channel visible on the chart.
Price previously moved into the purple resistance/structure zone around 117.75, but failed to maintain the area and is now trading below it.
The 117.18 Fibonacci level is the next important downside reference.
MACD is currently below the zero line, while RSI is around 41.80, indicating weakening short-term momentum without being in oversold territory.
A reclaim and sustained hold above 117.75 would put the upper structure and 118.08 back into focus.
A continued move below 117.18 keeps the lower Fibonacci sequence visible on the chart in focus.
🧠 Quick Insight
“After a rejection, watch whether the next support can hold before assuming the move is finished.”
⚠️ Disclaimer
This is personal market analysis, not financial advice.
Educational chart framework only.
Always DYOR / DYODD, manage risk properly, and avoid emotional trading.
— @nayrbryanGaming
#SOL #SOLUSDT #Crypto #Trading #TechnicalAnalysis #PriceAction #Fibonacci #Binance #DYOR #NFA #NoFOMO
📊 Market Bias
SOL is currently trading around 117.33 inside a descending channel.
Price recently rejected the 117.75–117.76 purple structure zone and is now trading below the key 117.75 area.
Short-term momentum has weakened, with price moving toward the lower Fibonacci levels.
🔹 Key Levels From Chart
Current Price:
117.33
Key Resistance / Reclaim:
117.75 → 117.76
Upper Fibonacci Reference:
118.08
Key Breakdown Area:
117.18
🎯 Downside Fibonacci Levels
TP1 → 117.18 — 1.0 Fib
TP2 → 116.88 — 1.5 Fib
TP3 → 116.58 — 2.0 Fib
TP4 → 116.28 — 2.5 Fib
TP5 → 115.98 — 3.0 Fib
TP6 → 115.69 — 3.5 Fib
📈 Technical Breakdown
SOL remains inside the descending blue channel visible on the chart.
Price previously moved into the purple resistance/structure zone around 117.75, but failed to maintain the area and is now trading below it.
The 117.18 Fibonacci level is the next important downside reference.
MACD is currently below the zero line, while RSI is around 41.80, indicating weakening short-term momentum without being in oversold territory.
A reclaim and sustained hold above 117.75 would put the upper structure and 118.08 back into focus.
A continued move below 117.18 keeps the lower Fibonacci sequence visible on the chart in focus.
🧠 Quick Insight
“After a rejection, watch whether the next support can hold before assuming the move is finished.”
⚠️ Disclaimer
This is personal market analysis, not financial advice.
Educational chart framework only.
Always DYOR / DYODD, manage risk properly, and avoid emotional trading.
— @nayrbryanGaming
#SOL #SOLUSDT #Crypto #Trading #TechnicalAnalysis #PriceAction #Fibonacci #Binance #DYOR #NFA #NoFOMO