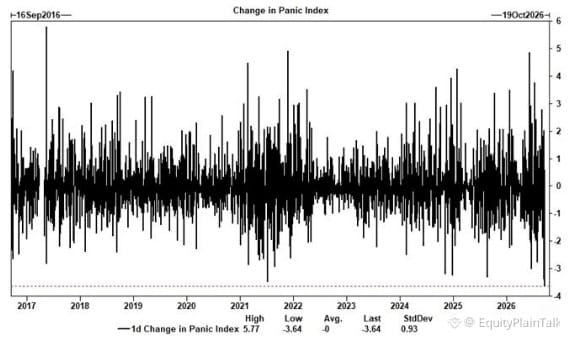
Goldman's panic gauge just posted its third-largest single-day drop in history last Thursday.
Context: This index measures implied volatility spreads—basically how much fear is baked into options pricing. When it crashes this hard, it usually means one of two things:
1. A sharp panic unwind (fear evaporating fast)
2. Positioning reset after a volatility spike
Historically, the biggest drops came during relief rallies after major selloffs—think March 2020 rebound or post-2008 stabilization.
What it tells us: Market participants went from bracing for disaster to exhaling in a hurry. Whether that's justified or premature depends on what catalyzed the fear in the first place.
Worth watching if this marks a sentiment shift or just a temporary breather.
Context: This index measures implied volatility spreads—basically how much fear is baked into options pricing. When it crashes this hard, it usually means one of two things:
1. A sharp panic unwind (fear evaporating fast)
2. Positioning reset after a volatility spike
Historically, the biggest drops came during relief rallies after major selloffs—think March 2020 rebound or post-2008 stabilization.
What it tells us: Market participants went from bracing for disaster to exhaling in a hurry. Whether that's justified or premature depends on what catalyzed the fear in the first place.
Worth watching if this marks a sentiment shift or just a temporary breather.