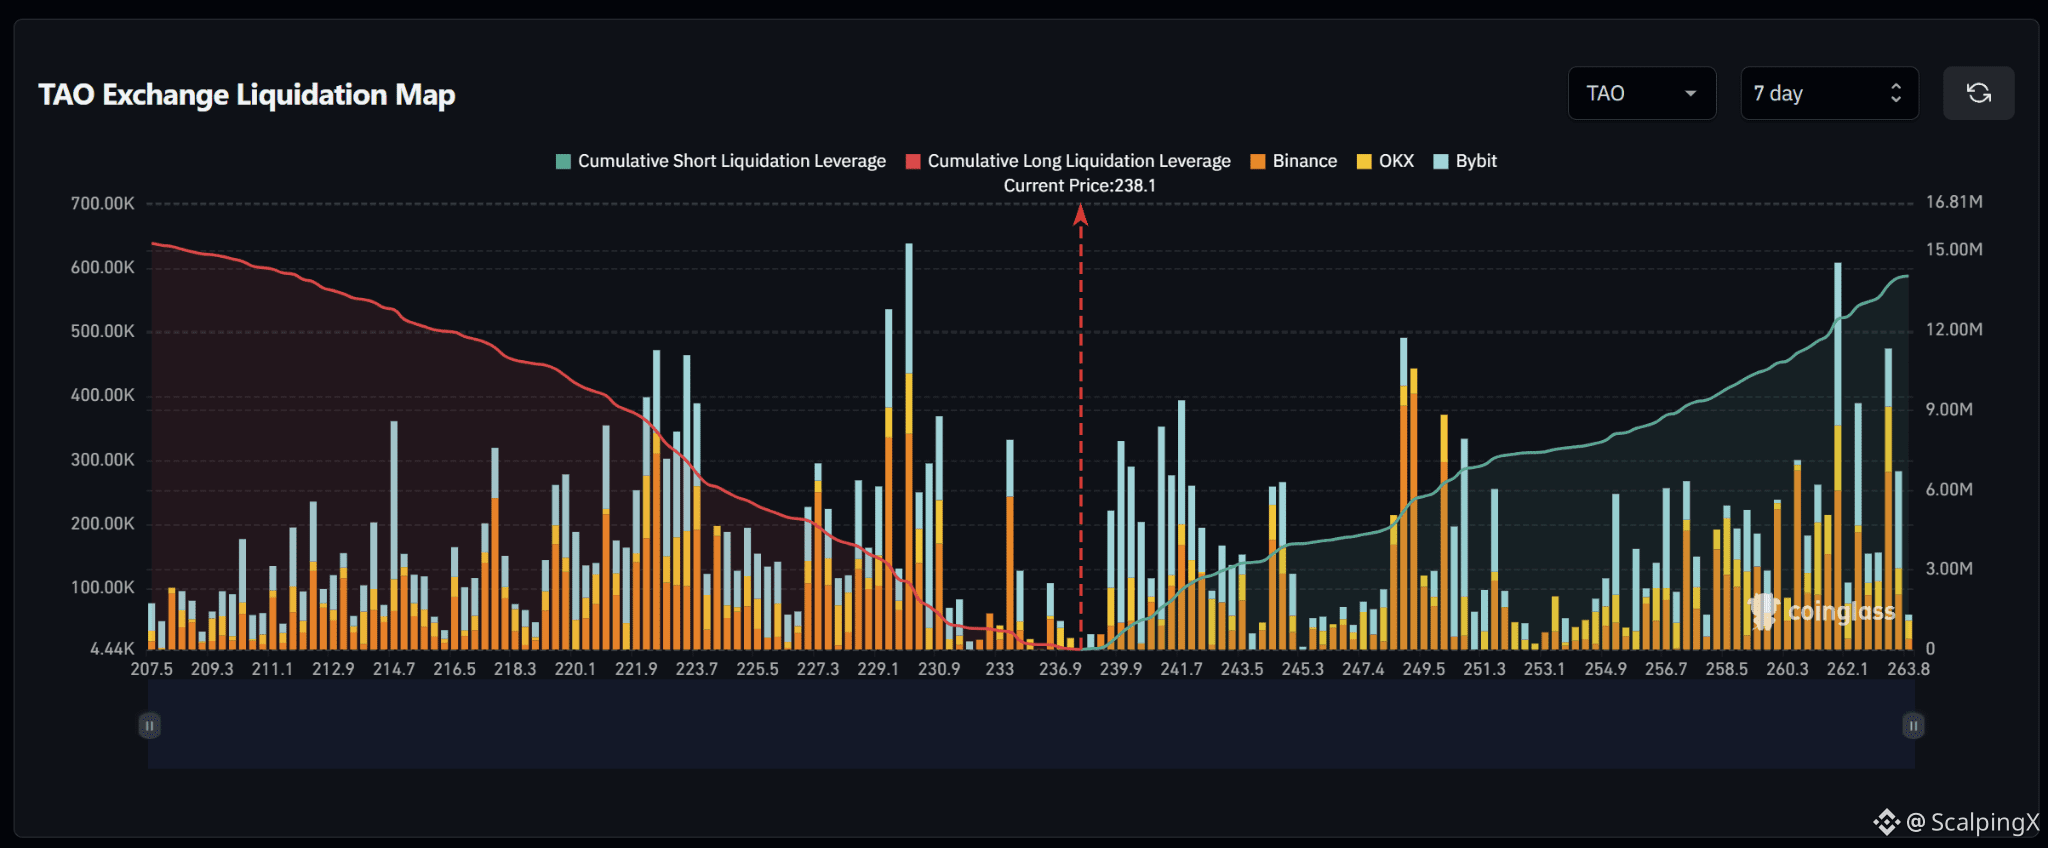
$TAO – Liquidation Map (7 Days) – Current Price 238.1
🔎 The 7-day liquidation map shows roughly $15 million in long liquidations below the current price, slightly exceeding approximately $14 million in short liquidations above. The overall structure is therefore relatively balanced but modestly tilted to the downside.
📉 Below the market, nearby long-liquidation liquidity is concentrated around 236.9–233.0 before becoming much denser across 230.9–229.1. The 229.1 area stands out with a liquidation bar above $600,000, making it one of the strongest downside clusters. Losing 236.9 would increase the probability of a sweep toward 233.0–230.9.
📈 Above the market, short-liquidation liquidity begins building around 239.9–241.7 and increases through 243.5–245.3. A larger cluster appears around 249.5–251.3, while 262.1 and 263.8 also contain notable liquidation bars. A break above 239.9 would bring 241.7–243.5 into focus first.
🧭 The broader setup modestly favors the downside because long-liquidation exposure below is roughly 1.1 times larger. Losing 236.9 would increase the probability of a sweep toward 233.0–230.9, while breaking above 239.9 would shift attention toward 241.7–243.5.
#LiquidationMap
🔎 The 7-day liquidation map shows roughly $15 million in long liquidations below the current price, slightly exceeding approximately $14 million in short liquidations above. The overall structure is therefore relatively balanced but modestly tilted to the downside.
📉 Below the market, nearby long-liquidation liquidity is concentrated around 236.9–233.0 before becoming much denser across 230.9–229.1. The 229.1 area stands out with a liquidation bar above $600,000, making it one of the strongest downside clusters. Losing 236.9 would increase the probability of a sweep toward 233.0–230.9.
📈 Above the market, short-liquidation liquidity begins building around 239.9–241.7 and increases through 243.5–245.3. A larger cluster appears around 249.5–251.3, while 262.1 and 263.8 also contain notable liquidation bars. A break above 239.9 would bring 241.7–243.5 into focus first.
🧭 The broader setup modestly favors the downside because long-liquidation exposure below is roughly 1.1 times larger. Losing 236.9 would increase the probability of a sweep toward 233.0–230.9, while breaking above 239.9 would shift attention toward 241.7–243.5.
#LiquidationMap