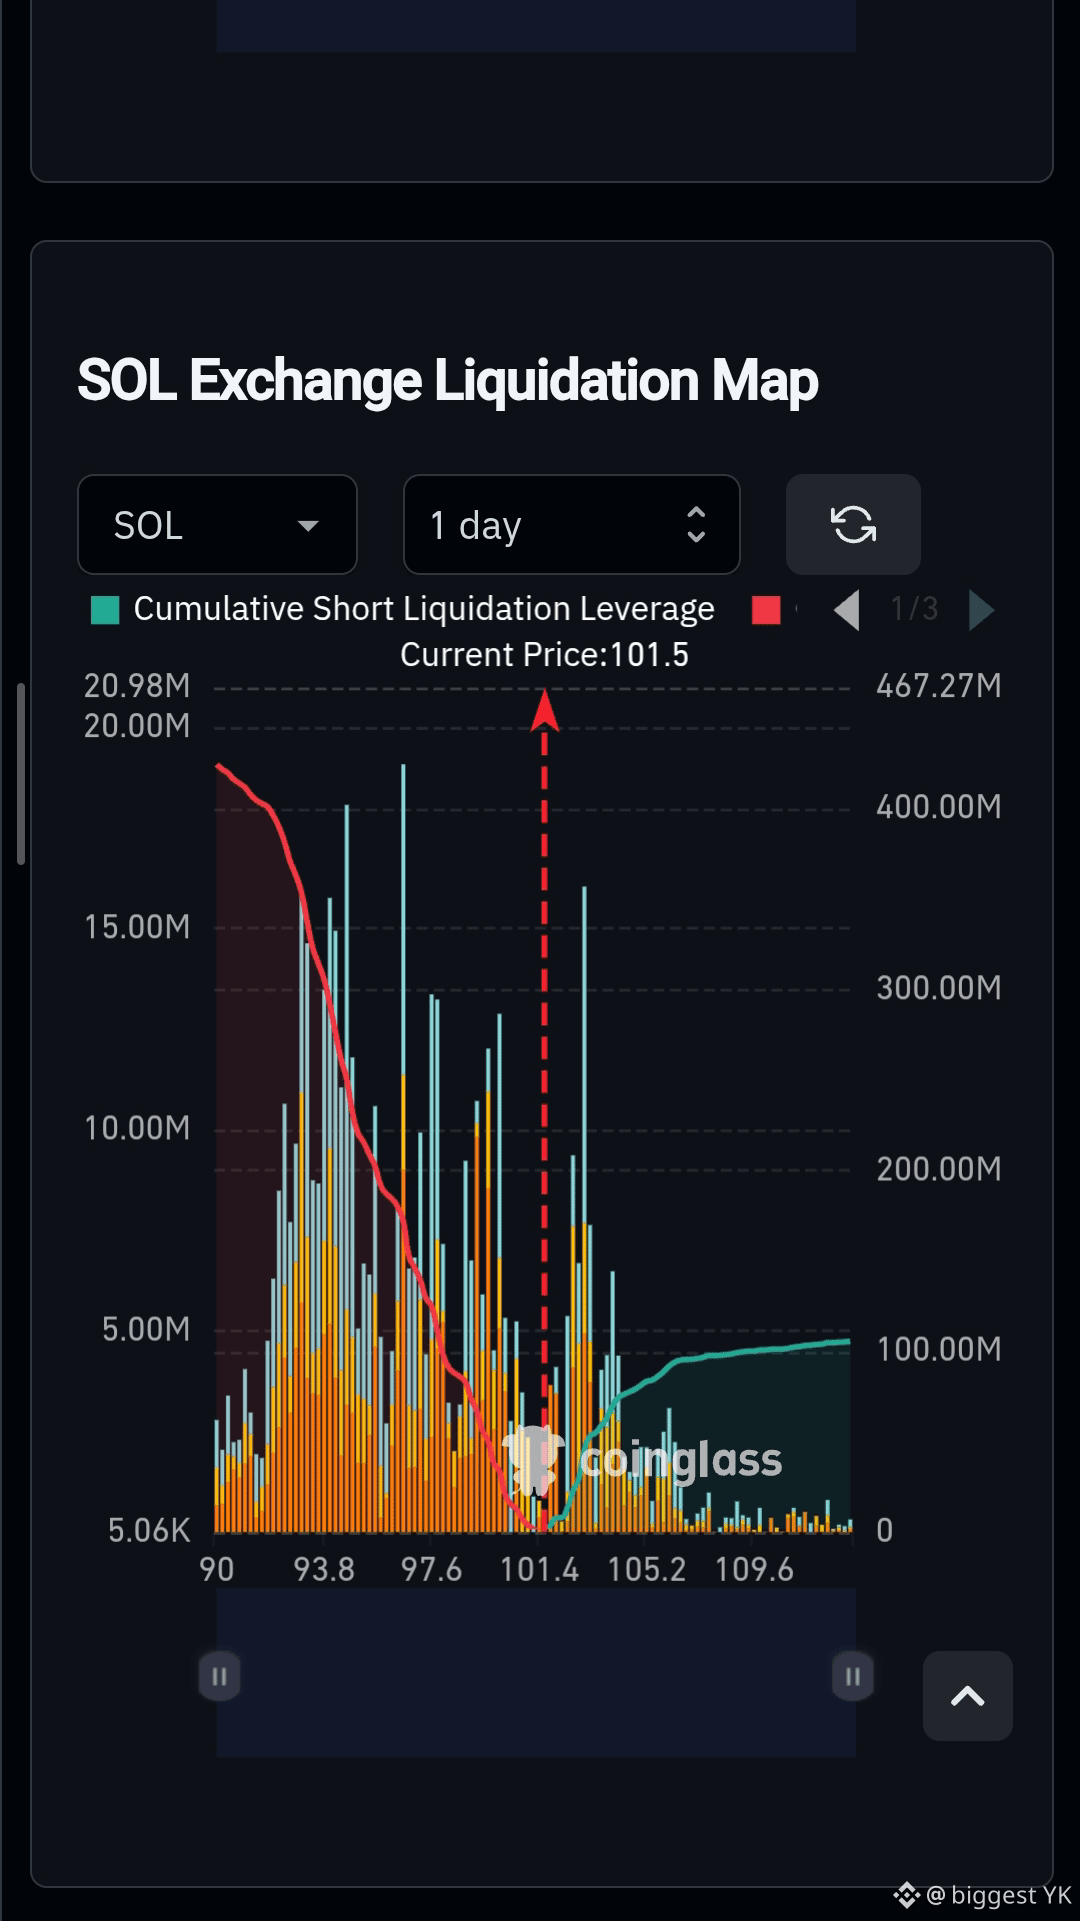
$SOL LIQUIDATION MAP SHOWS A BIGGER TARGET ABOVE 👀
SOL is around $101.5 on the map.
There is significant short-liquidation liquidity stacked above the current price, with the cumulative curve rising sharply toward the $105–$110+ region.
That creates an interesting potential squeeze zone if SOL breaks higher with strong volume.
Still, liquidation maps show where leverage is positioned — not where price must go.
Levels I'm watching: → $105 → $109–$110
Breakout + volume = confirmation.
SOL is around $101.5 on the map.
There is significant short-liquidation liquidity stacked above the current price, with the cumulative curve rising sharply toward the $105–$110+ region.
That creates an interesting potential squeeze zone if SOL breaks higher with strong volume.
Still, liquidation maps show where leverage is positioned — not where price must go.
Levels I'm watching: → $105 → $109–$110
Breakout + volume = confirmation.