
#tradingperformance
tradingperformance
10,817 vues
36 mentions
Populaire
Récents

·
--
Haussier
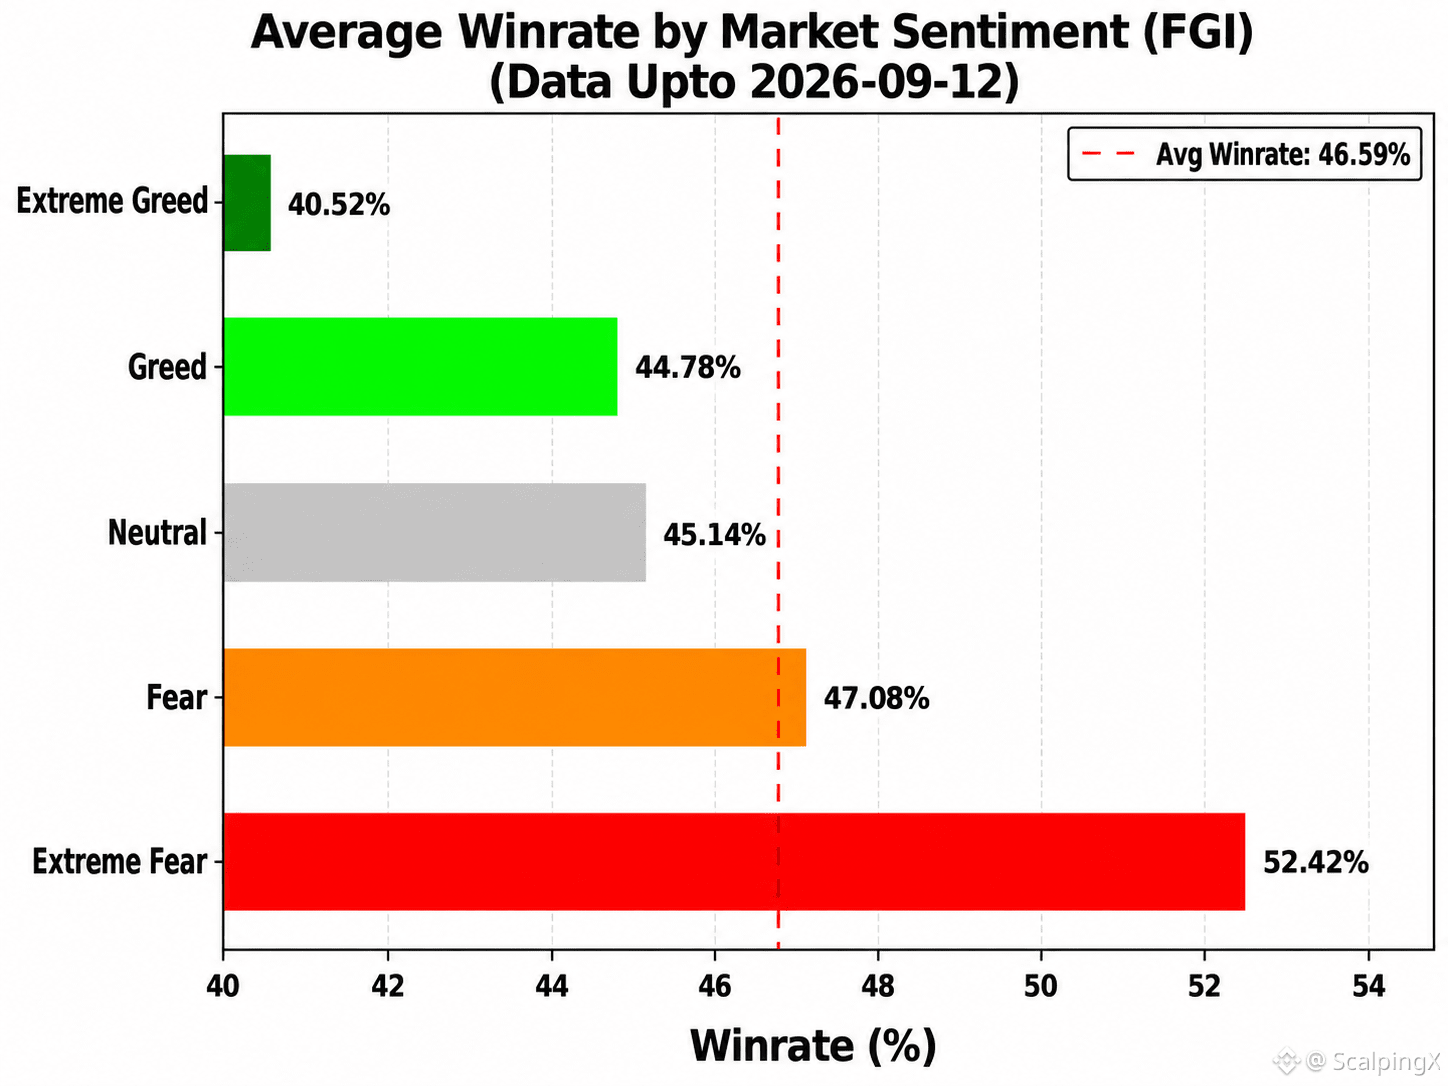
📊 PERFORMANCE DE TRADING & RAPPORT SUR L’INDICE DE SENTIMENT DU MARCHÉ (FGI) – MIS À JOUR LE 12/09/2026
Les dernières données statistiques montrent que la corrélation entre le FGI et le taux de réussite (Win Rate) reste faible et continue de pencher vers le négatif, à environ r ≈ -0.293. Cela suggère que le FGI n’est pas adapté comme outil autonome pour déterminer les entrées d’ordres, mais qu’il apporte néanmoins de la valeur pour l’évaluation du risque. La performance de trading a généralement tendance à s’affaiblir lorsque le sentiment du marché évolue vers un optimisme extrême. Ainsi, le FGI est plus utile comme indicateur précoce d’alerte au risque plutôt que comme signal pour étendre les objectifs de profit.
Voici un récapitulatif du taux de réussite (WR), du R:R minimal à l’équilibre (breakeven) et du nombre de jours enregistrés (n) par zone de sentiment, pour référence :
🤑 Extrême avidité (≥80) : WR 40,5 % • R:R=1:1,47 • n=25
🤤 Avidité (60–80) : WR 44,8 % • R:R=1:1,23 • n=238
😐 Neutre (40–60) : WR 45,1 % • R:R=1:1,22 • n=153
😰 Peur (20–40) : WR 47,1 % • R:R=1:1,12 • n=271
😱 Peur extrême (<20) : WR 52,4 % • R:R=1:0,91 • n=115
Part des jours dont la performance est supérieure à la moyenne globale de 46,59 %, par zone de sentiment :
🤑 Extrême avidité : 8,0 %
🤤 Avidité : 35,7 %
😐 Neutre : 38,6 %
😰 Peur : 55,0 %
😱 Peur extrême : 67,8 %
➤ Les scalpeurs peuvent utiliser le FGI comme repère pour ajuster les objectifs de profit attendus lors des entrées en trades :
📈 Lorsque le FGI est élevé, des objectifs de profit plus élevés peuvent être nécessaires pour maintenir un R:R suffisamment important et compenser la baisse du taux de réussite.
📉 Lorsque le FGI est faible, des objectifs de profit plus bas peuvent convenir pour augmenter la rotation du capital et rendre la réalisation du profit plus facile.
#TradingPerformance $ONE
📊 PERFORMANCE DE TRADING & RAPPORT SUR L’INDICE DE SENTIMENT DU MARCHÉ (FGI) – MIS À JOUR LE 12/09/2026
Les dernières données statistiques montrent que la corrélation entre le FGI et le taux de réussite (Win Rate) reste faible et continue de pencher vers le négatif, à environ r ≈ -0.293. Cela suggère que le FGI n’est pas adapté comme outil autonome pour déterminer les entrées d’ordres, mais qu’il apporte néanmoins de la valeur pour l’évaluation du risque. La performance de trading a généralement tendance à s’affaiblir lorsque le sentiment du marché évolue vers un optimisme extrême. Ainsi, le FGI est plus utile comme indicateur précoce d’alerte au risque plutôt que comme signal pour étendre les objectifs de profit.
Voici un récapitulatif du taux de réussite (WR), du R:R minimal à l’équilibre (breakeven) et du nombre de jours enregistrés (n) par zone de sentiment, pour référence :
🤑 Extrême avidité (≥80) : WR 40,5 % • R:R=1:1,47 • n=25
🤤 Avidité (60–80) : WR 44,8 % • R:R=1:1,23 • n=238
😐 Neutre (40–60) : WR 45,1 % • R:R=1:1,22 • n=153
😰 Peur (20–40) : WR 47,1 % • R:R=1:1,12 • n=271
😱 Peur extrême (<20) : WR 52,4 % • R:R=1:0,91 • n=115
Part des jours dont la performance est supérieure à la moyenne globale de 46,59 %, par zone de sentiment :
🤑 Extrême avidité : 8,0 %
🤤 Avidité : 35,7 %
😐 Neutre : 38,6 %
😰 Peur : 55,0 %
😱 Peur extrême : 67,8 %
➤ Les scalpeurs peuvent utiliser le FGI comme repère pour ajuster les objectifs de profit attendus lors des entrées en trades :
📈 Lorsque le FGI est élevé, des objectifs de profit plus élevés peuvent être nécessaires pour maintenir un R:R suffisamment important et compenser la baisse du taux de réussite.
📉 Lorsque le FGI est faible, des objectifs de profit plus bas peuvent convenir pour augmenter la rotation du capital et rendre la réalisation du profit plus facile.
#TradingPerformance $ONE
Les dernières données statistiques montrent que la corrélation entre le FGI et le taux de réussite (Win Rate) reste faible et continue de pencher vers le négatif, à environ r ≈ -0.293. Cela suggère que le FGI n’est pas adapté comme outil autonome pour déterminer les entrées d’ordres, mais qu’il apporte néanmoins de la valeur pour l’évaluation du risque. La performance de trading a généralement tendance à s’affaiblir lorsque le sentiment du marché évolue vers un optimisme extrême. Ainsi, le FGI est plus utile comme indicateur précoce d’alerte au risque plutôt que comme signal pour étendre les objectifs de profit.
Voici un récapitulatif du taux de réussite (WR), du R:R minimal à l’équilibre (breakeven) et du nombre de jours enregistrés (n) par zone de sentiment, pour référence :
🤑 Extrême avidité (≥80) : WR 40,5 % • R:R=1:1,47 • n=25
🤤 Avidité (60–80) : WR 44,8 % • R:R=1:1,23 • n=238
😐 Neutre (40–60) : WR 45,1 % • R:R=1:1,22 • n=153
😰 Peur (20–40) : WR 47,1 % • R:R=1:1,12 • n=271
😱 Peur extrême (<20) : WR 52,4 % • R:R=1:0,91 • n=115
Part des jours dont la performance est supérieure à la moyenne globale de 46,59 %, par zone de sentiment :
🤑 Extrême avidité : 8,0 %
🤤 Avidité : 35,7 %
😐 Neutre : 38,6 %
😰 Peur : 55,0 %
😱 Peur extrême : 67,8 %
➤ Les scalpeurs peuvent utiliser le FGI comme repère pour ajuster les objectifs de profit attendus lors des entrées en trades :
📈 Lorsque le FGI est élevé, des objectifs de profit plus élevés peuvent être nécessaires pour maintenir un R:R suffisamment important et compenser la baisse du taux de réussite.
📉 Lorsque le FGI est faible, des objectifs de profit plus bas peuvent convenir pour augmenter la rotation du capital et rendre la réalisation du profit plus facile.
#TradingPerformance $ONE
135
·
--
Haussier
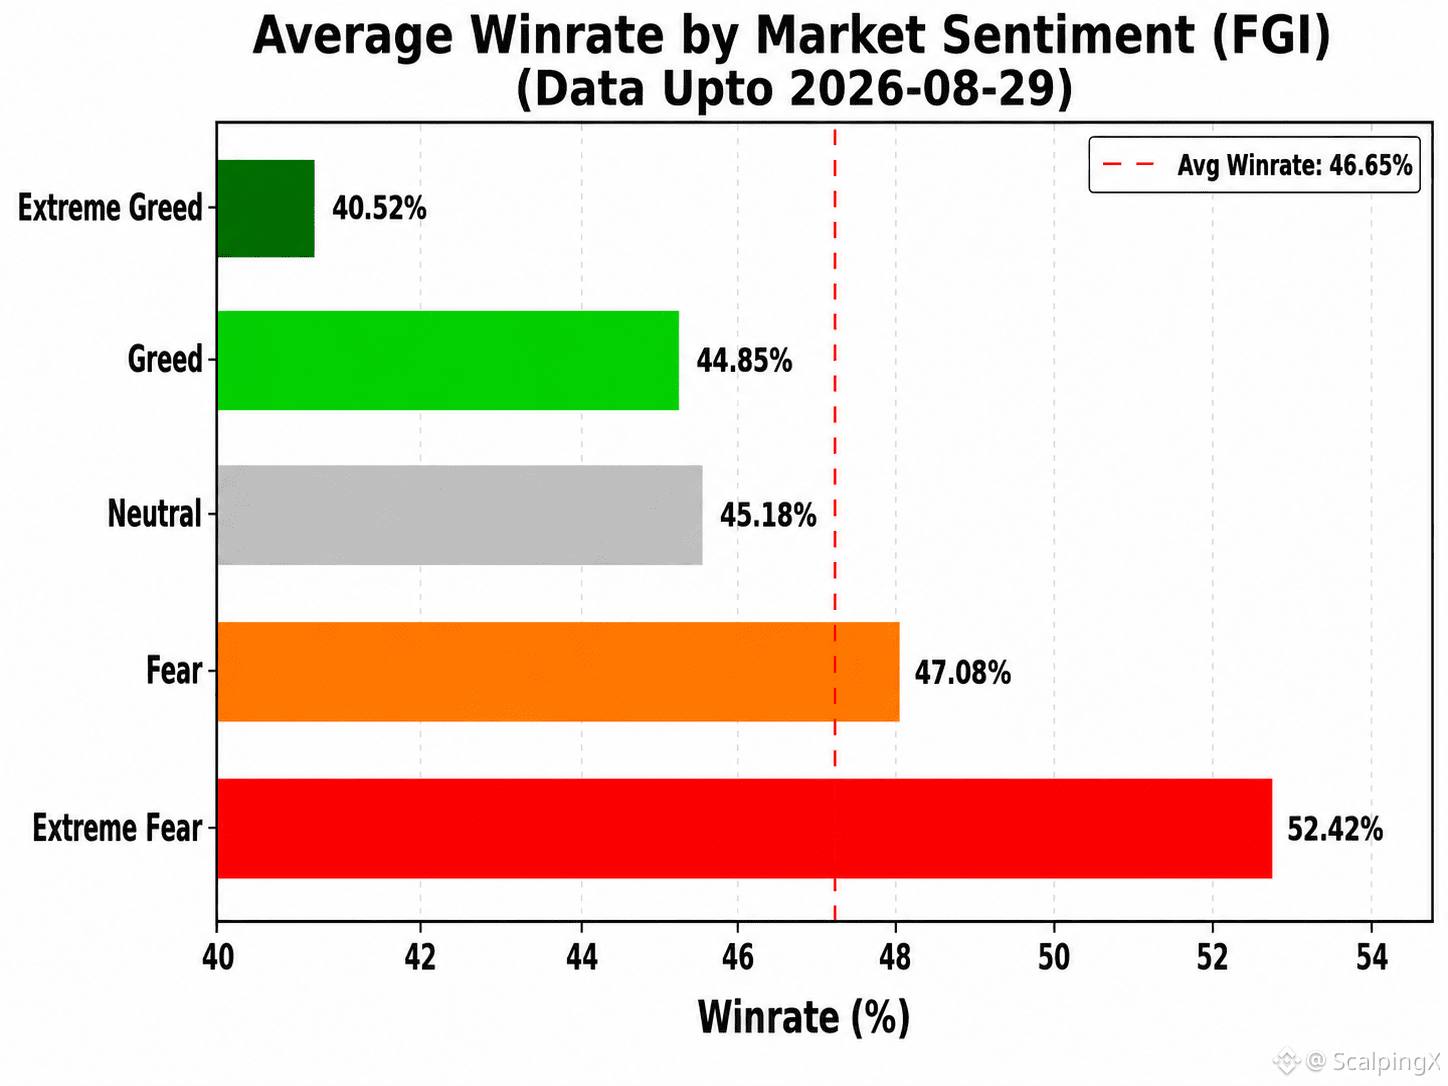
📊 PERFORMANCE DE TRADING & INDICE DE SENTIMENT DE MARCHÉ (FGI) — RAPPORT MIS À JOUR LE 2026-08-29
Les dernières statistiques montrent que la corrélation entre le FGI et le taux de réussite (Win Rate) demeure faible et continue de pencher dans le sens négatif, avec environ r ≈ -0,290. Cela suggère que le FGI n’est pas adapté comme outil autonome pour déterminer les entrées d’ordres, mais qu’il conserve une valeur pour l’évaluation du risque. En général, la performance de trading a tendance à s’affaiblir lorsque le sentiment de marché bascule vers une euphorie extrême, ce qui rend le FGI plus utile comme indicateur précoce d’alerte sur le risque plutôt que comme signal pour élargir les objectifs de profit.
Voici un résumé du taux de réussite (WR), du R:R minimum à l’équilibre (breakeven) et du nombre de jours enregistrés (n) selon les zones de sentiment :
🤑 Extrême cupidité (≥80) : WR 40,5% • R:R=1:1,47 • n=25
🤤 Cupidités (60–80) : WR 44,9% • R:R=1:1,23 • n=225
😐 Neutre (40–60) : WR 45,2% • R:R=1:1,21 • n=152
😰 Peur (20–40) : WR 47,1% • R:R=1:1,12 • n=271
😱 Peur extrême (<20) : WR 52,4% • R:R=1:0,91 • n=115
Part des jours où la performance est supérieure à la moyenne globale de 46,65 %, par zone de sentiment :
🤑 Extrême cupidité : 8,0%
🤤 Cupidités : 35,6%
😐 Neutre : 38,8%
😰 Peur : 55,0%
😱 Peur extrême : 67,8%
➤ Les scalpers peuvent utiliser le FGI comme guide pour ajuster les objectifs de profit attendus lors de l’entrée en trades :
📈 Lorsque le FGI est élevé, les traders peuvent devoir relever leurs attentes de profit afin de maintenir un ratio R:R suffisamment élevé, ce qui aide à compenser le risque lié à un taux de réussite plus faible.
📉 Lorsque le FGI est faible, les traders peuvent réduire leurs attentes de profit pour augmenter la rotation du capital et rendre la réalisation du profit plus facile.
#TradingPerformance $BTC $ETH $SOL
📊 PERFORMANCE DE TRADING & INDICE DE SENTIMENT DE MARCHÉ (FGI) — RAPPORT MIS À JOUR LE 2026-08-29
Les dernières statistiques montrent que la corrélation entre le FGI et le taux de réussite (Win Rate) demeure faible et continue de pencher dans le sens négatif, avec environ r ≈ -0,290. Cela suggère que le FGI n’est pas adapté comme outil autonome pour déterminer les entrées d’ordres, mais qu’il conserve une valeur pour l’évaluation du risque. En général, la performance de trading a tendance à s’affaiblir lorsque le sentiment de marché bascule vers une euphorie extrême, ce qui rend le FGI plus utile comme indicateur précoce d’alerte sur le risque plutôt que comme signal pour élargir les objectifs de profit.
Voici un résumé du taux de réussite (WR), du R:R minimum à l’équilibre (breakeven) et du nombre de jours enregistrés (n) selon les zones de sentiment :
🤑 Extrême cupidité (≥80) : WR 40,5% • R:R=1:1,47 • n=25
🤤 Cupidités (60–80) : WR 44,9% • R:R=1:1,23 • n=225
😐 Neutre (40–60) : WR 45,2% • R:R=1:1,21 • n=152
😰 Peur (20–40) : WR 47,1% • R:R=1:1,12 • n=271
😱 Peur extrême (<20) : WR 52,4% • R:R=1:0,91 • n=115
Part des jours où la performance est supérieure à la moyenne globale de 46,65 %, par zone de sentiment :
🤑 Extrême cupidité : 8,0%
🤤 Cupidités : 35,6%
😐 Neutre : 38,8%
😰 Peur : 55,0%
😱 Peur extrême : 67,8%
➤ Les scalpers peuvent utiliser le FGI comme guide pour ajuster les objectifs de profit attendus lors de l’entrée en trades :
📈 Lorsque le FGI est élevé, les traders peuvent devoir relever leurs attentes de profit afin de maintenir un ratio R:R suffisamment élevé, ce qui aide à compenser le risque lié à un taux de réussite plus faible.
📉 Lorsque le FGI est faible, les traders peuvent réduire leurs attentes de profit pour augmenter la rotation du capital et rendre la réalisation du profit plus facile.
#TradingPerformance $BTC $ETH $SOL
Les dernières statistiques montrent que la corrélation entre le FGI et le taux de réussite (Win Rate) demeure faible et continue de pencher dans le sens négatif, avec environ r ≈ -0,290. Cela suggère que le FGI n’est pas adapté comme outil autonome pour déterminer les entrées d’ordres, mais qu’il conserve une valeur pour l’évaluation du risque. En général, la performance de trading a tendance à s’affaiblir lorsque le sentiment de marché bascule vers une euphorie extrême, ce qui rend le FGI plus utile comme indicateur précoce d’alerte sur le risque plutôt que comme signal pour élargir les objectifs de profit.
Voici un résumé du taux de réussite (WR), du R:R minimum à l’équilibre (breakeven) et du nombre de jours enregistrés (n) selon les zones de sentiment :
🤑 Extrême cupidité (≥80) : WR 40,5% • R:R=1:1,47 • n=25
🤤 Cupidités (60–80) : WR 44,9% • R:R=1:1,23 • n=225
😐 Neutre (40–60) : WR 45,2% • R:R=1:1,21 • n=152
😰 Peur (20–40) : WR 47,1% • R:R=1:1,12 • n=271
😱 Peur extrême (<20) : WR 52,4% • R:R=1:0,91 • n=115
Part des jours où la performance est supérieure à la moyenne globale de 46,65 %, par zone de sentiment :
🤑 Extrême cupidité : 8,0%
🤤 Cupidités : 35,6%
😐 Neutre : 38,8%
😰 Peur : 55,0%
😱 Peur extrême : 67,8%
➤ Les scalpers peuvent utiliser le FGI comme guide pour ajuster les objectifs de profit attendus lors de l’entrée en trades :
📈 Lorsque le FGI est élevé, les traders peuvent devoir relever leurs attentes de profit afin de maintenir un ratio R:R suffisamment élevé, ce qui aide à compenser le risque lié à un taux de réussite plus faible.
📉 Lorsque le FGI est faible, les traders peuvent réduire leurs attentes de profit pour augmenter la rotation du capital et rendre la réalisation du profit plus facile.
#TradingPerformance $BTC $ETH $SOL
55
·
--
Haussier
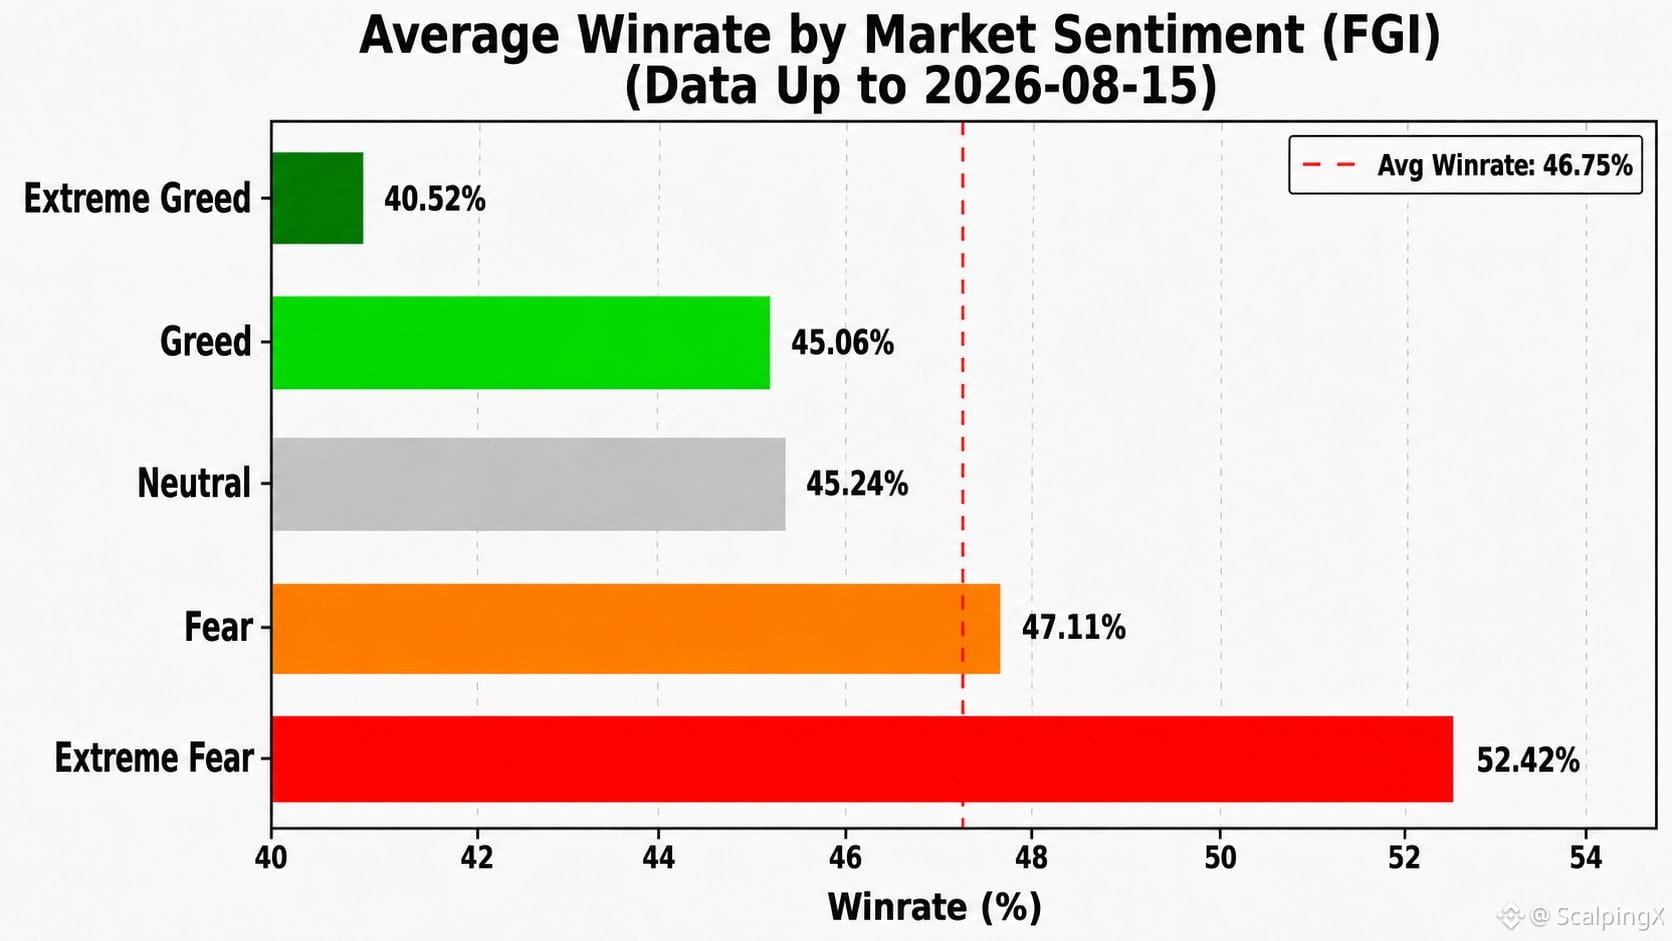
📊 PERFORMANCE DE TRADING & INDICE DE PEUR ET DE GREED (FGI) – MIS À JOUR LE 15/08/2026
Les dernières données statistiques montrent que la corrélation entre le FGI et le taux de réussite (Win Rate) reste faible et continue de pencher vers le négatif, avec r ≈ -0.285. Cela suggère que le FGI n’est pas adapté comme outil autonome pour déterminer les entrées d’ordres, mais qu’il peut toutefois être utile pour quantifier le risque. La performance de trading a généralement tendance à se détériorer lorsque le sentiment du marché évolue vers des niveaux d’optimisme extrêmes, ce qui rend le FGI plus approprié comme indicateur de risque précoce plutôt que comme signal pour élargir les attentes de profit.
Ci-dessous un récapitulatif du taux de réussite (WR), du ratio minimum d’équilibre (breakeven) R:R et du nombre de jours enregistrés (n) dans différentes zones de sentiment :
🤑 Greed extrême (≥80) : WR 40.5% • R:R=1:1.47 • n=25
🤤 Greed (60–80) : WR 45.1% • R:R=1:1.22 • n=215
😐 Neutre (40–60) : WR 45.2% • R:R=1:1.21 • n=150
😰 Peur (20–40) : WR 47.1% • R:R=1:1.12 • n=269
😱 Peur extrême (<20) : WR 52.4% • R:R=1:0.91 • n=115
Le pourcentage de jours dont la performance est supérieure au taux de réussite moyen global de 46.75%, par zone de sentiment :
🤑 Greed extrême : 8.0%
🤤 Greed : 36.3%
😐 Neutre : 38.0%
😰 Peur : 53.9%
😱 Peur extrême : 67.8%
➤ Les traders à court terme peuvent utiliser le FGI comme repère pour ajuster les objectifs de profit attendus lors de l’ouverture de positions :
📈 Lorsque le FGI est élevé, des attentes de profit plus hautes peuvent être nécessaires afin de maintenir un ratio R:R suffisamment favorable et de compenser un taux de réussite plus faible.
📉 Lorsque le FGI est bas, les attentes de profit peuvent être réduites pour augmenter la rotation du capital et faciliter la concrétisation des profits.
#TradingPerformance $GRAM $NVDAB $AAPLB
📊 PERFORMANCE DE TRADING & INDICE DE PEUR ET DE GREED (FGI) – MIS À JOUR LE 15/08/2026
Les dernières données statistiques montrent que la corrélation entre le FGI et le taux de réussite (Win Rate) reste faible et continue de pencher vers le négatif, avec r ≈ -0.285. Cela suggère que le FGI n’est pas adapté comme outil autonome pour déterminer les entrées d’ordres, mais qu’il peut toutefois être utile pour quantifier le risque. La performance de trading a généralement tendance à se détériorer lorsque le sentiment du marché évolue vers des niveaux d’optimisme extrêmes, ce qui rend le FGI plus approprié comme indicateur de risque précoce plutôt que comme signal pour élargir les attentes de profit.
Ci-dessous un récapitulatif du taux de réussite (WR), du ratio minimum d’équilibre (breakeven) R:R et du nombre de jours enregistrés (n) dans différentes zones de sentiment :
🤑 Greed extrême (≥80) : WR 40.5% • R:R=1:1.47 • n=25
🤤 Greed (60–80) : WR 45.1% • R:R=1:1.22 • n=215
😐 Neutre (40–60) : WR 45.2% • R:R=1:1.21 • n=150
😰 Peur (20–40) : WR 47.1% • R:R=1:1.12 • n=269
😱 Peur extrême (<20) : WR 52.4% • R:R=1:0.91 • n=115
Le pourcentage de jours dont la performance est supérieure au taux de réussite moyen global de 46.75%, par zone de sentiment :
🤑 Greed extrême : 8.0%
🤤 Greed : 36.3%
😐 Neutre : 38.0%
😰 Peur : 53.9%
😱 Peur extrême : 67.8%
➤ Les traders à court terme peuvent utiliser le FGI comme repère pour ajuster les objectifs de profit attendus lors de l’ouverture de positions :
📈 Lorsque le FGI est élevé, des attentes de profit plus hautes peuvent être nécessaires afin de maintenir un ratio R:R suffisamment favorable et de compenser un taux de réussite plus faible.
📉 Lorsque le FGI est bas, les attentes de profit peuvent être réduites pour augmenter la rotation du capital et faciliter la concrétisation des profits.
#TradingPerformance $GRAM $NVDAB $AAPLB
Les dernières données statistiques montrent que la corrélation entre le FGI et le taux de réussite (Win Rate) reste faible et continue de pencher vers le négatif, avec r ≈ -0.285. Cela suggère que le FGI n’est pas adapté comme outil autonome pour déterminer les entrées d’ordres, mais qu’il peut toutefois être utile pour quantifier le risque. La performance de trading a généralement tendance à se détériorer lorsque le sentiment du marché évolue vers des niveaux d’optimisme extrêmes, ce qui rend le FGI plus approprié comme indicateur de risque précoce plutôt que comme signal pour élargir les attentes de profit.
Ci-dessous un récapitulatif du taux de réussite (WR), du ratio minimum d’équilibre (breakeven) R:R et du nombre de jours enregistrés (n) dans différentes zones de sentiment :
🤑 Greed extrême (≥80) : WR 40.5% • R:R=1:1.47 • n=25
🤤 Greed (60–80) : WR 45.1% • R:R=1:1.22 • n=215
😐 Neutre (40–60) : WR 45.2% • R:R=1:1.21 • n=150
😰 Peur (20–40) : WR 47.1% • R:R=1:1.12 • n=269
😱 Peur extrême (<20) : WR 52.4% • R:R=1:0.91 • n=115
Le pourcentage de jours dont la performance est supérieure au taux de réussite moyen global de 46.75%, par zone de sentiment :
🤑 Greed extrême : 8.0%
🤤 Greed : 36.3%
😐 Neutre : 38.0%
😰 Peur : 53.9%
😱 Peur extrême : 67.8%
➤ Les traders à court terme peuvent utiliser le FGI comme repère pour ajuster les objectifs de profit attendus lors de l’ouverture de positions :
📈 Lorsque le FGI est élevé, des attentes de profit plus hautes peuvent être nécessaires afin de maintenir un ratio R:R suffisamment favorable et de compenser un taux de réussite plus faible.
📉 Lorsque le FGI est bas, les attentes de profit peuvent être réduites pour augmenter la rotation du capital et faciliter la concrétisation des profits.
#TradingPerformance $GRAM $NVDAB $AAPLB
99
·
--
Haussier
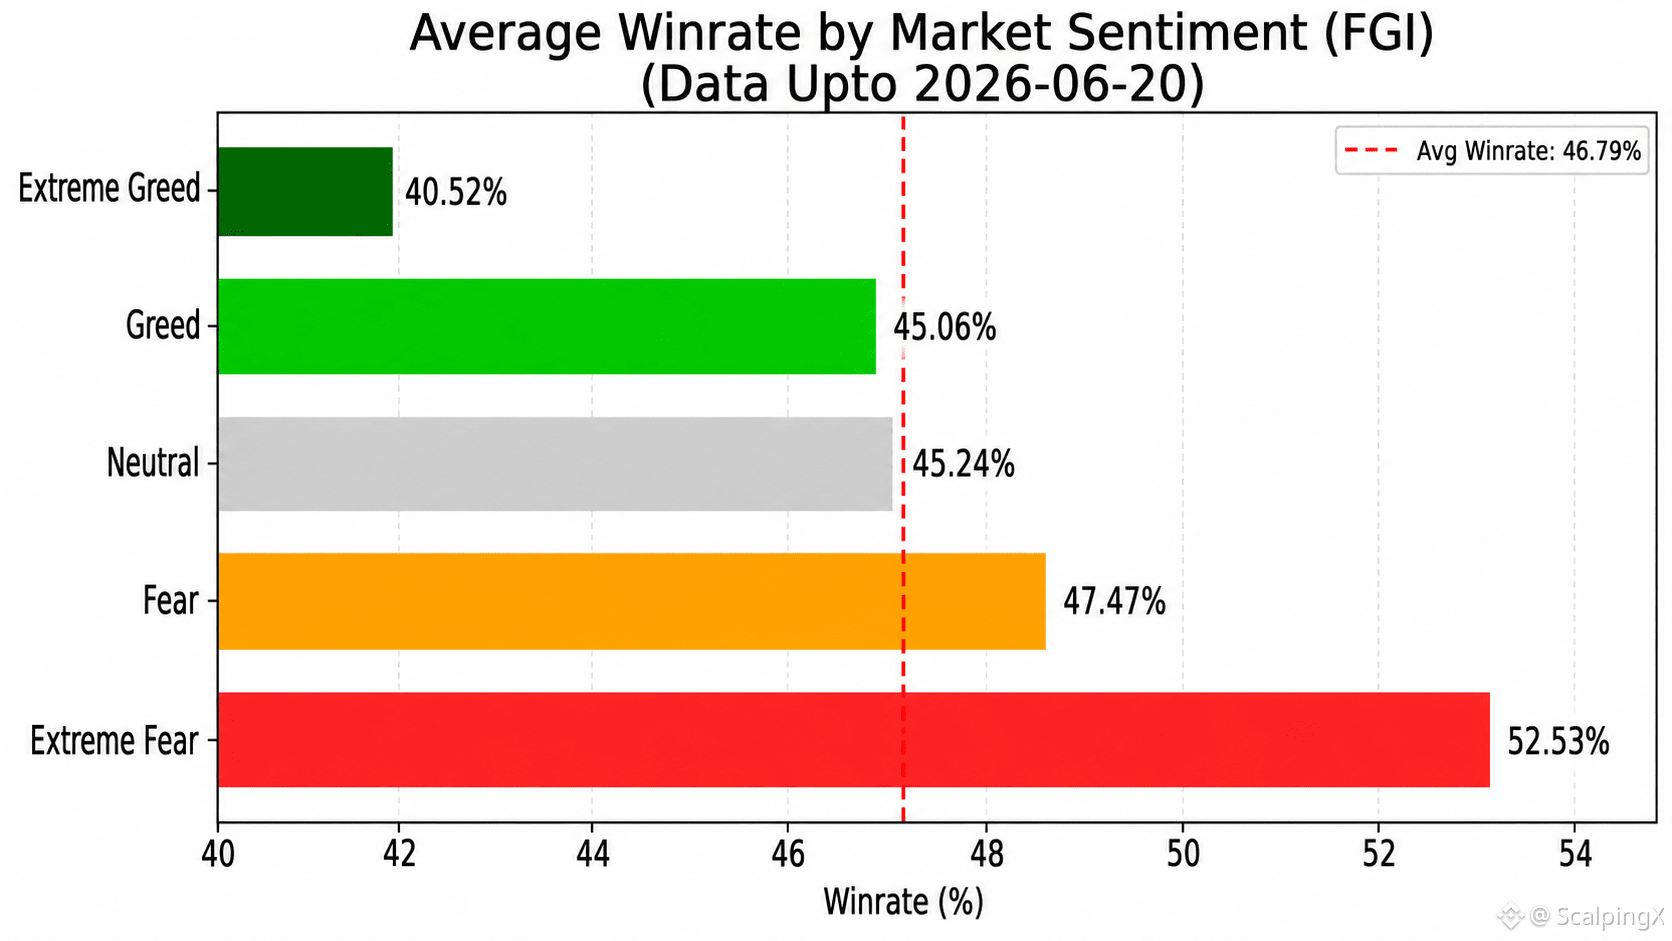
📊 PERFORMANCE DE TRADING & INDICE DE SENTIMENT DE MARCHÉ (FGI) – MIS À JOUR LE 20/06/2026
Les dernières données statistiques montrent que la corrélation entre le FGI et le taux de réussite reste faible et continue de pencher négativement (r ~ -0.309). Cela renforce davantage l'idée que le FGI n'est pas un outil adapté pour prédire les tendances de prix ou identifier les entrées de trades, mais il a tout de même une valeur pratique pour quantifier le risque de position. En général, la performance de trading tend à s'affaiblir lorsque le sentiment de marché entre dans une euphorie extrême, rendant le FGI plus utile comme un signal précoce d'avertissement de risque plutôt que comme un signal pour élargir les attentes de profit.
Voici un résumé du taux de réussite (WR), du minimum de breakeven R:R, et du nombre de jours enregistrés (n) à travers les zones de sentiment pour référence :
🤑 Avarice Extrême (≥80) : WR 40,5 % • R:R=1:1,47 • n=25
🤤 Avarice (60–80) : WR 45,1 % • R:R=1:1,22 • n=215
😐 Neutre (40–60) : WR 45,2 % • R:R=1:1,21 • n=150
😨 Peur (20–40) : WR 47,5 % • R:R=1:1,11 • n=222
😱 Peur Extrême (<20) : WR 52,5 % • R:R=1:0,90 • n=106
Le pourcentage de jours avec une performance au-dessus du niveau moyen de 46,79 % par zone de sentiment :
🤑 Avarice Extrême : 8,0 %
🤤 Avarice : 36,3 %
😐 Neutre : 38,0 %
😨 Peur : 54,1 %
😱 Peur Extrême : 69,8 %
➤ Les scalpers peuvent utiliser le FGI comme un guide pour ajuster les objectifs de profit attendus lors de l'entrée dans des trades :
📈 Lorsque le FGI est élevé, les objectifs de profit attendus doivent être augmentés pour s'assurer que le R:R est suffisamment grand pour compenser la baisse du taux de réussite.
📉 Lorsque le FGI est bas, les objectifs de profit attendus peuvent être réduits pour améliorer la vitesse de rotation du capital et faciliter la prise de profits.
#TradingPerformance $NVDAB $MUB $TSLAB
📊 PERFORMANCE DE TRADING & INDICE DE SENTIMENT DE MARCHÉ (FGI) – MIS À JOUR LE 20/06/2026
Les dernières données statistiques montrent que la corrélation entre le FGI et le taux de réussite reste faible et continue de pencher négativement (r ~ -0.309). Cela renforce davantage l'idée que le FGI n'est pas un outil adapté pour prédire les tendances de prix ou identifier les entrées de trades, mais il a tout de même une valeur pratique pour quantifier le risque de position. En général, la performance de trading tend à s'affaiblir lorsque le sentiment de marché entre dans une euphorie extrême, rendant le FGI plus utile comme un signal précoce d'avertissement de risque plutôt que comme un signal pour élargir les attentes de profit.
Voici un résumé du taux de réussite (WR), du minimum de breakeven R:R, et du nombre de jours enregistrés (n) à travers les zones de sentiment pour référence :
🤑 Avarice Extrême (≥80) : WR 40,5 % • R:R=1:1,47 • n=25
🤤 Avarice (60–80) : WR 45,1 % • R:R=1:1,22 • n=215
😐 Neutre (40–60) : WR 45,2 % • R:R=1:1,21 • n=150
😨 Peur (20–40) : WR 47,5 % • R:R=1:1,11 • n=222
😱 Peur Extrême (<20) : WR 52,5 % • R:R=1:0,90 • n=106
Le pourcentage de jours avec une performance au-dessus du niveau moyen de 46,79 % par zone de sentiment :
🤑 Avarice Extrême : 8,0 %
🤤 Avarice : 36,3 %
😐 Neutre : 38,0 %
😨 Peur : 54,1 %
😱 Peur Extrême : 69,8 %
➤ Les scalpers peuvent utiliser le FGI comme un guide pour ajuster les objectifs de profit attendus lors de l'entrée dans des trades :
📈 Lorsque le FGI est élevé, les objectifs de profit attendus doivent être augmentés pour s'assurer que le R:R est suffisamment grand pour compenser la baisse du taux de réussite.
📉 Lorsque le FGI est bas, les objectifs de profit attendus peuvent être réduits pour améliorer la vitesse de rotation du capital et faciliter la prise de profits.
#TradingPerformance $NVDAB $MUB $TSLAB
Les dernières données statistiques montrent que la corrélation entre le FGI et le taux de réussite reste faible et continue de pencher négativement (r ~ -0.309). Cela renforce davantage l'idée que le FGI n'est pas un outil adapté pour prédire les tendances de prix ou identifier les entrées de trades, mais il a tout de même une valeur pratique pour quantifier le risque de position. En général, la performance de trading tend à s'affaiblir lorsque le sentiment de marché entre dans une euphorie extrême, rendant le FGI plus utile comme un signal précoce d'avertissement de risque plutôt que comme un signal pour élargir les attentes de profit.
Voici un résumé du taux de réussite (WR), du minimum de breakeven R:R, et du nombre de jours enregistrés (n) à travers les zones de sentiment pour référence :
🤑 Avarice Extrême (≥80) : WR 40,5 % • R:R=1:1,47 • n=25
🤤 Avarice (60–80) : WR 45,1 % • R:R=1:1,22 • n=215
😐 Neutre (40–60) : WR 45,2 % • R:R=1:1,21 • n=150
😨 Peur (20–40) : WR 47,5 % • R:R=1:1,11 • n=222
😱 Peur Extrême (<20) : WR 52,5 % • R:R=1:0,90 • n=106
Le pourcentage de jours avec une performance au-dessus du niveau moyen de 46,79 % par zone de sentiment :
🤑 Avarice Extrême : 8,0 %
🤤 Avarice : 36,3 %
😐 Neutre : 38,0 %
😨 Peur : 54,1 %
😱 Peur Extrême : 69,8 %
➤ Les scalpers peuvent utiliser le FGI comme un guide pour ajuster les objectifs de profit attendus lors de l'entrée dans des trades :
📈 Lorsque le FGI est élevé, les objectifs de profit attendus doivent être augmentés pour s'assurer que le R:R est suffisamment grand pour compenser la baisse du taux de réussite.
📉 Lorsque le FGI est bas, les objectifs de profit attendus peuvent être réduits pour améliorer la vitesse de rotation du capital et faciliter la prise de profits.
#TradingPerformance $NVDAB $MUB $TSLAB
2
5.5k
·
--
Haussier
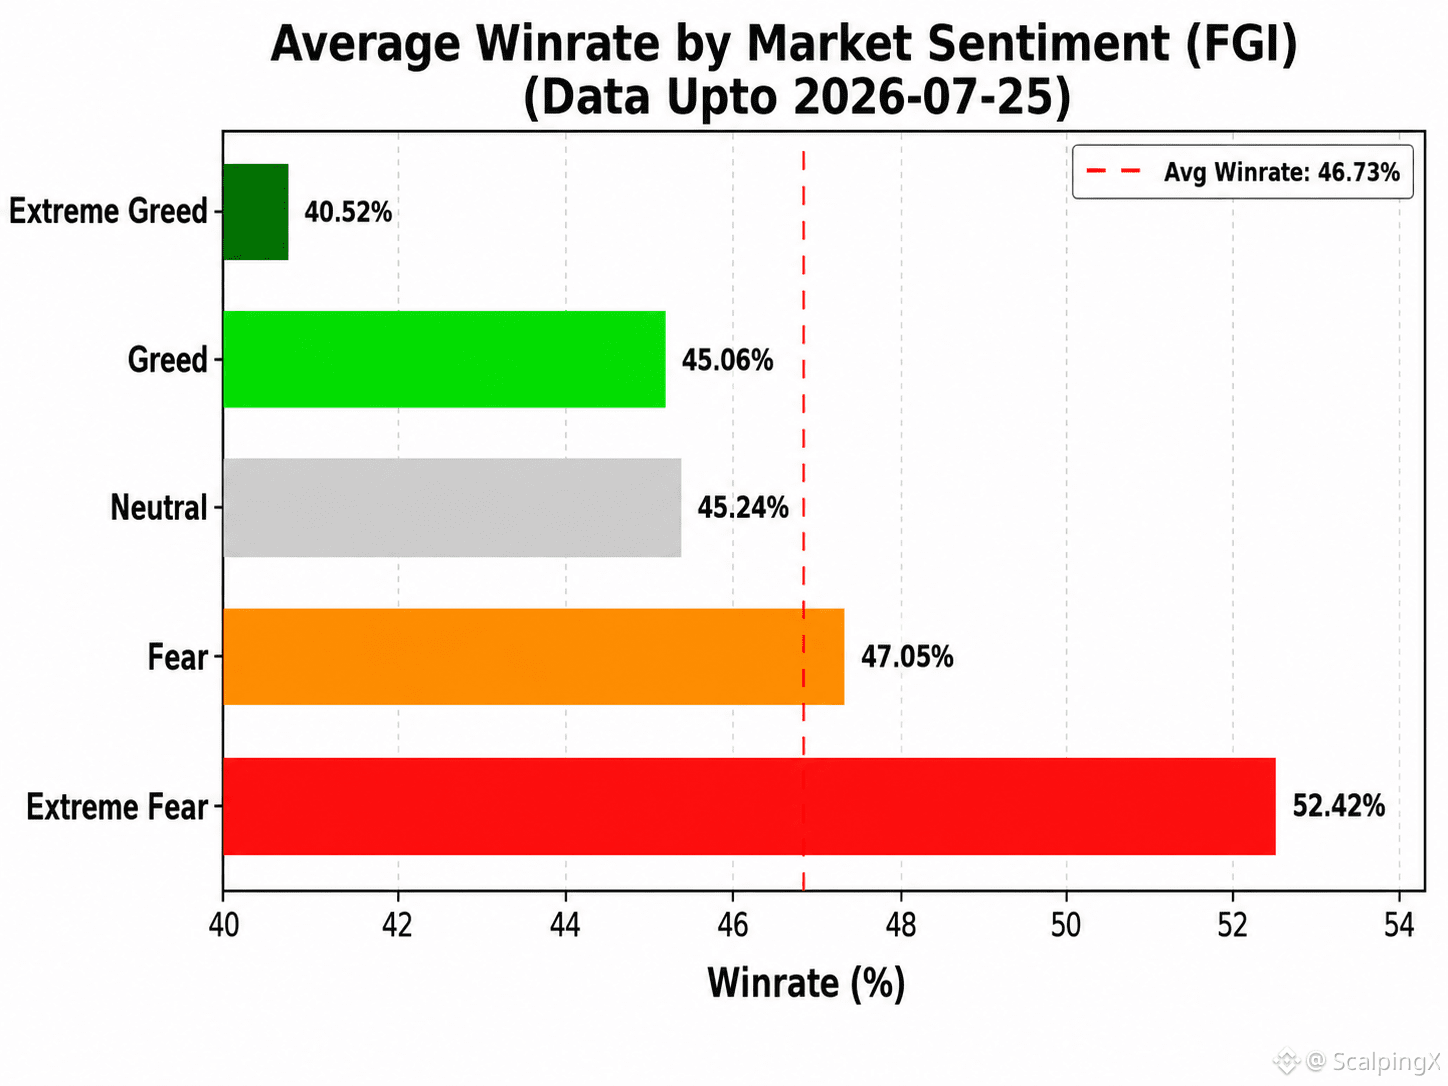
📊 PERFORMANCE DE TRADING ET INDICE DE SENTIMENT DE MARCHÉ (FGI) — RAPPORT MIS À JOUR LE 25/07/2026
Les dernières statistiques montrent que la corrélation entre le FGI et le Taux de Victoire reste faible et continue d’être négative (r ≈ -0.289). Cela renforce davantage l’idée que le FGI n’est pas adapté pour prédire la direction du prix ou déterminer les points d’entrée. Toutefois, il conserve une valeur pratique pour quantifier le risque lié aux ordres.
Globalement, la performance de trading a tendance à baisser lorsque le sentiment du marché s’oriente vers un optimisme extrême. Par conséquent, le FGI est mieux utilisé comme indicateur précoce d’alerte au risque plutôt que comme signal pour augmenter les attentes de profit.
Voici un résumé du Taux de Victoire (WR), du ratio R:R minimum à l’équilibre, et du nombre de jours enregistrés (n) pour chaque zone de sentiment :
🤑 Extrême cupidité (≥80) : WR 40,5% • R:R = 1:1,47 • n = 25
🤤 G from = 1? Greed (60–80) : WR 45,1% • R:R = 1:1,22 • n = 215
😐 Neutre (40–60) : WR 45,2% • R:R = 1:1,21 • n = 150
😨 Peur (20–40) : WR 47,0% • R:R = 1:1,13 • n = 248
😱 Peur extrême (<20) : WR 52,4% • R:R = 1:0,91 • n = 115
Le pourcentage de jours où la performance est supérieure à la moyenne globale de 46,73% dans chaque zone de sentiment :
🤑 Extrême cupidité : 8,0%
🤤 Cupidité : 36,3%
😐 Neutre : 38,0%
😨 Peur : 53,2%
😱 Peur extrême : 67,8%
➤ Les traders à court terme peuvent utiliser le FGI comme référence pour ajuster leurs objectifs de profit attendus lors de la prise de positions :
📈 Lorsque le FGI est élevé, les traders devraient augmenter leur objectif de profit attendu afin de maintenir un R:R suffisamment important et compenser le taux de victoire plus faible.
📉 Lorsque le FGI est bas, les traders peuvent réduire leur objectif de profit attendu pour accélérer la rotation du capital et réaliser des profits plus facilement.
#TradingPerformance $BNB $SOL $ROBO
📊 PERFORMANCE DE TRADING ET INDICE DE SENTIMENT DE MARCHÉ (FGI) — RAPPORT MIS À JOUR LE 25/07/2026
Les dernières statistiques montrent que la corrélation entre le FGI et le Taux de Victoire reste faible et continue d’être négative (r ≈ -0.289). Cela renforce davantage l’idée que le FGI n’est pas adapté pour prédire la direction du prix ou déterminer les points d’entrée. Toutefois, il conserve une valeur pratique pour quantifier le risque lié aux ordres.
Globalement, la performance de trading a tendance à baisser lorsque le sentiment du marché s’oriente vers un optimisme extrême. Par conséquent, le FGI est mieux utilisé comme indicateur précoce d’alerte au risque plutôt que comme signal pour augmenter les attentes de profit.
Voici un résumé du Taux de Victoire (WR), du ratio R:R minimum à l’équilibre, et du nombre de jours enregistrés (n) pour chaque zone de sentiment :
🤑 Extrême cupidité (≥80) : WR 40,5% • R:R = 1:1,47 • n = 25
🤤 G from = 1? Greed (60–80) : WR 45,1% • R:R = 1:1,22 • n = 215
😐 Neutre (40–60) : WR 45,2% • R:R = 1:1,21 • n = 150
😨 Peur (20–40) : WR 47,0% • R:R = 1:1,13 • n = 248
😱 Peur extrême (<20) : WR 52,4% • R:R = 1:0,91 • n = 115
Le pourcentage de jours où la performance est supérieure à la moyenne globale de 46,73% dans chaque zone de sentiment :
🤑 Extrême cupidité : 8,0%
🤤 Cupidité : 36,3%
😐 Neutre : 38,0%
😨 Peur : 53,2%
😱 Peur extrême : 67,8%
➤ Les traders à court terme peuvent utiliser le FGI comme référence pour ajuster leurs objectifs de profit attendus lors de la prise de positions :
📈 Lorsque le FGI est élevé, les traders devraient augmenter leur objectif de profit attendu afin de maintenir un R:R suffisamment important et compenser le taux de victoire plus faible.
📉 Lorsque le FGI est bas, les traders peuvent réduire leur objectif de profit attendu pour accélérer la rotation du capital et réaliser des profits plus facilement.
#TradingPerformance $BNB $SOL $ROBO
Les dernières statistiques montrent que la corrélation entre le FGI et le Taux de Victoire reste faible et continue d’être négative (r ≈ -0.289). Cela renforce davantage l’idée que le FGI n’est pas adapté pour prédire la direction du prix ou déterminer les points d’entrée. Toutefois, il conserve une valeur pratique pour quantifier le risque lié aux ordres.
Globalement, la performance de trading a tendance à baisser lorsque le sentiment du marché s’oriente vers un optimisme extrême. Par conséquent, le FGI est mieux utilisé comme indicateur précoce d’alerte au risque plutôt que comme signal pour augmenter les attentes de profit.
Voici un résumé du Taux de Victoire (WR), du ratio R:R minimum à l’équilibre, et du nombre de jours enregistrés (n) pour chaque zone de sentiment :
🤑 Extrême cupidité (≥80) : WR 40,5% • R:R = 1:1,47 • n = 25
🤤 G from = 1? Greed (60–80) : WR 45,1% • R:R = 1:1,22 • n = 215
😐 Neutre (40–60) : WR 45,2% • R:R = 1:1,21 • n = 150
😨 Peur (20–40) : WR 47,0% • R:R = 1:1,13 • n = 248
😱 Peur extrême (<20) : WR 52,4% • R:R = 1:0,91 • n = 115
Le pourcentage de jours où la performance est supérieure à la moyenne globale de 46,73% dans chaque zone de sentiment :
🤑 Extrême cupidité : 8,0%
🤤 Cupidité : 36,3%
😐 Neutre : 38,0%
😨 Peur : 53,2%
😱 Peur extrême : 67,8%
➤ Les traders à court terme peuvent utiliser le FGI comme référence pour ajuster leurs objectifs de profit attendus lors de la prise de positions :
📈 Lorsque le FGI est élevé, les traders devraient augmenter leur objectif de profit attendu afin de maintenir un R:R suffisamment important et compenser le taux de victoire plus faible.
📉 Lorsque le FGI est bas, les traders peuvent réduire leur objectif de profit attendu pour accélérer la rotation du capital et réaliser des profits plus facilement.
#TradingPerformance $BNB $SOL $ROBO
235
·
--
Haussier
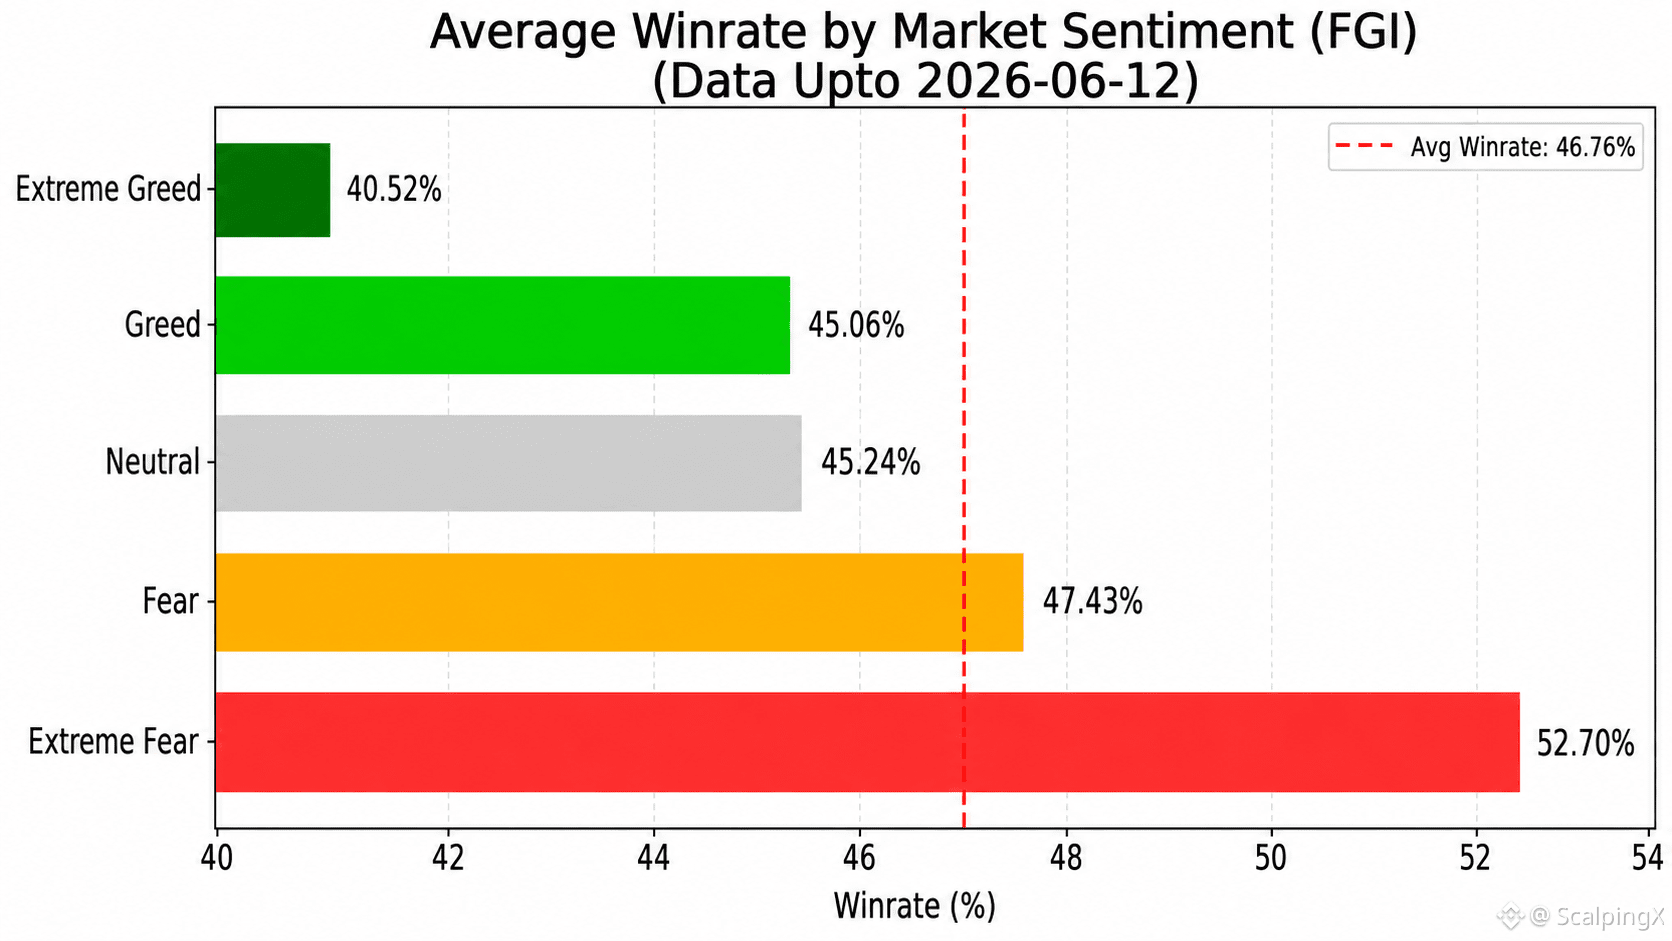
📊 RAPPORT DE PERFORMANCE DE TRADING & INDICE DE SENTIMENT DE MARCHÉ (FGI) – MIS À JOUR 2026-06-12
Les dernières statistiques montrent que la corrélation entre le FGI et le Winrate reste faible et continue d'être négative (r ~ -0.312). Cela soutient davantage l'idée que le FGI n'est pas adapté comme outil pour prédire les tendances de prix ou identifier les entrées de trade, mais il a tout de même une valeur pratique pour quantifier le risque de position. En particulier, la performance de trading tend généralement à s'affaiblir lorsque le sentiment du marché passe à une excitation extrême, donc le FGI est mieux utilisé comme un signal d'avertissement précoce de risque plutôt que comme un signal pour élargir les attentes de profit.
Voici un résumé du Winrate (WR), du ratio minimum de rentabilité R:R, et du nombre de jours enregistrés (n) à travers les zones de sentiment :
🤑 Greed Extrême (≥80) : WR 40.5% • R:R=1:1.47 • n=25
🤤 Greed (60–80) : WR 45.1% • R:R=1:1.22 • n=215
😐 Neutre (40–60) : WR 45.2% • R:R=1:1.21 • n=150
😨 Peur (20–40) : WR 47.4% • R:R=1:1.11 • n=218
😱 Peur Extrême (<20) : WR 52.7% • R:R=1:0.90 • n=102
Part des jours avec une performance au-dessus du niveau moyen de 46.76% par zone de sentiment :
🤑 Greed Extrême : 8.0%
🤤 Greed : 36.3%
😐 Neutre : 38.0%
😨 Peur : 53.7%
😱 Peur Extrême : 70.6%
➤ Les scalpers peuvent utiliser le FGI comme guide pour ajuster les objectifs de profit attendus lors de l'entrée dans des trades :
📈 Lorsque le FGI est élevé, les attentes de profit doivent être augmentées pour maintenir un ratio R:R suffisant, aidant à compenser le risque d'un taux de réussite plus bas.
📉 Lorsque le FGI est bas, les attentes de profit peuvent être réduites pour améliorer la vitesse de rotation du capital et faciliter la réalisation du profit.
#TradingPerformance #MarketSentiment $BTC $NVDAB $SPCXB
📊 RAPPORT DE PERFORMANCE DE TRADING & INDICE DE SENTIMENT DE MARCHÉ (FGI) – MIS À JOUR 2026-06-12
Les dernières statistiques montrent que la corrélation entre le FGI et le Winrate reste faible et continue d'être négative (r ~ -0.312). Cela soutient davantage l'idée que le FGI n'est pas adapté comme outil pour prédire les tendances de prix ou identifier les entrées de trade, mais il a tout de même une valeur pratique pour quantifier le risque de position. En particulier, la performance de trading tend généralement à s'affaiblir lorsque le sentiment du marché passe à une excitation extrême, donc le FGI est mieux utilisé comme un signal d'avertissement précoce de risque plutôt que comme un signal pour élargir les attentes de profit.
Voici un résumé du Winrate (WR), du ratio minimum de rentabilité R:R, et du nombre de jours enregistrés (n) à travers les zones de sentiment :
🤑 Greed Extrême (≥80) : WR 40.5% • R:R=1:1.47 • n=25
🤤 Greed (60–80) : WR 45.1% • R:R=1:1.22 • n=215
😐 Neutre (40–60) : WR 45.2% • R:R=1:1.21 • n=150
😨 Peur (20–40) : WR 47.4% • R:R=1:1.11 • n=218
😱 Peur Extrême (<20) : WR 52.7% • R:R=1:0.90 • n=102
Part des jours avec une performance au-dessus du niveau moyen de 46.76% par zone de sentiment :
🤑 Greed Extrême : 8.0%
🤤 Greed : 36.3%
😐 Neutre : 38.0%
😨 Peur : 53.7%
😱 Peur Extrême : 70.6%
➤ Les scalpers peuvent utiliser le FGI comme guide pour ajuster les objectifs de profit attendus lors de l'entrée dans des trades :
📈 Lorsque le FGI est élevé, les attentes de profit doivent être augmentées pour maintenir un ratio R:R suffisant, aidant à compenser le risque d'un taux de réussite plus bas.
📉 Lorsque le FGI est bas, les attentes de profit peuvent être réduites pour améliorer la vitesse de rotation du capital et faciliter la réalisation du profit.
#TradingPerformance #MarketSentiment $BTC $NVDAB $SPCXB
Les dernières statistiques montrent que la corrélation entre le FGI et le Winrate reste faible et continue d'être négative (r ~ -0.312). Cela soutient davantage l'idée que le FGI n'est pas adapté comme outil pour prédire les tendances de prix ou identifier les entrées de trade, mais il a tout de même une valeur pratique pour quantifier le risque de position. En particulier, la performance de trading tend généralement à s'affaiblir lorsque le sentiment du marché passe à une excitation extrême, donc le FGI est mieux utilisé comme un signal d'avertissement précoce de risque plutôt que comme un signal pour élargir les attentes de profit.
Voici un résumé du Winrate (WR), du ratio minimum de rentabilité R:R, et du nombre de jours enregistrés (n) à travers les zones de sentiment :
🤑 Greed Extrême (≥80) : WR 40.5% • R:R=1:1.47 • n=25
🤤 Greed (60–80) : WR 45.1% • R:R=1:1.22 • n=215
😐 Neutre (40–60) : WR 45.2% • R:R=1:1.21 • n=150
😨 Peur (20–40) : WR 47.4% • R:R=1:1.11 • n=218
😱 Peur Extrême (<20) : WR 52.7% • R:R=1:0.90 • n=102
Part des jours avec une performance au-dessus du niveau moyen de 46.76% par zone de sentiment :
🤑 Greed Extrême : 8.0%
🤤 Greed : 36.3%
😐 Neutre : 38.0%
😨 Peur : 53.7%
😱 Peur Extrême : 70.6%
➤ Les scalpers peuvent utiliser le FGI comme guide pour ajuster les objectifs de profit attendus lors de l'entrée dans des trades :
📈 Lorsque le FGI est élevé, les attentes de profit doivent être augmentées pour maintenir un ratio R:R suffisant, aidant à compenser le risque d'un taux de réussite plus bas.
📉 Lorsque le FGI est bas, les attentes de profit peuvent être réduites pour améliorer la vitesse de rotation du capital et faciliter la réalisation du profit.
#TradingPerformance #MarketSentiment $BTC $NVDAB $SPCXB
71
·
--
Haussier
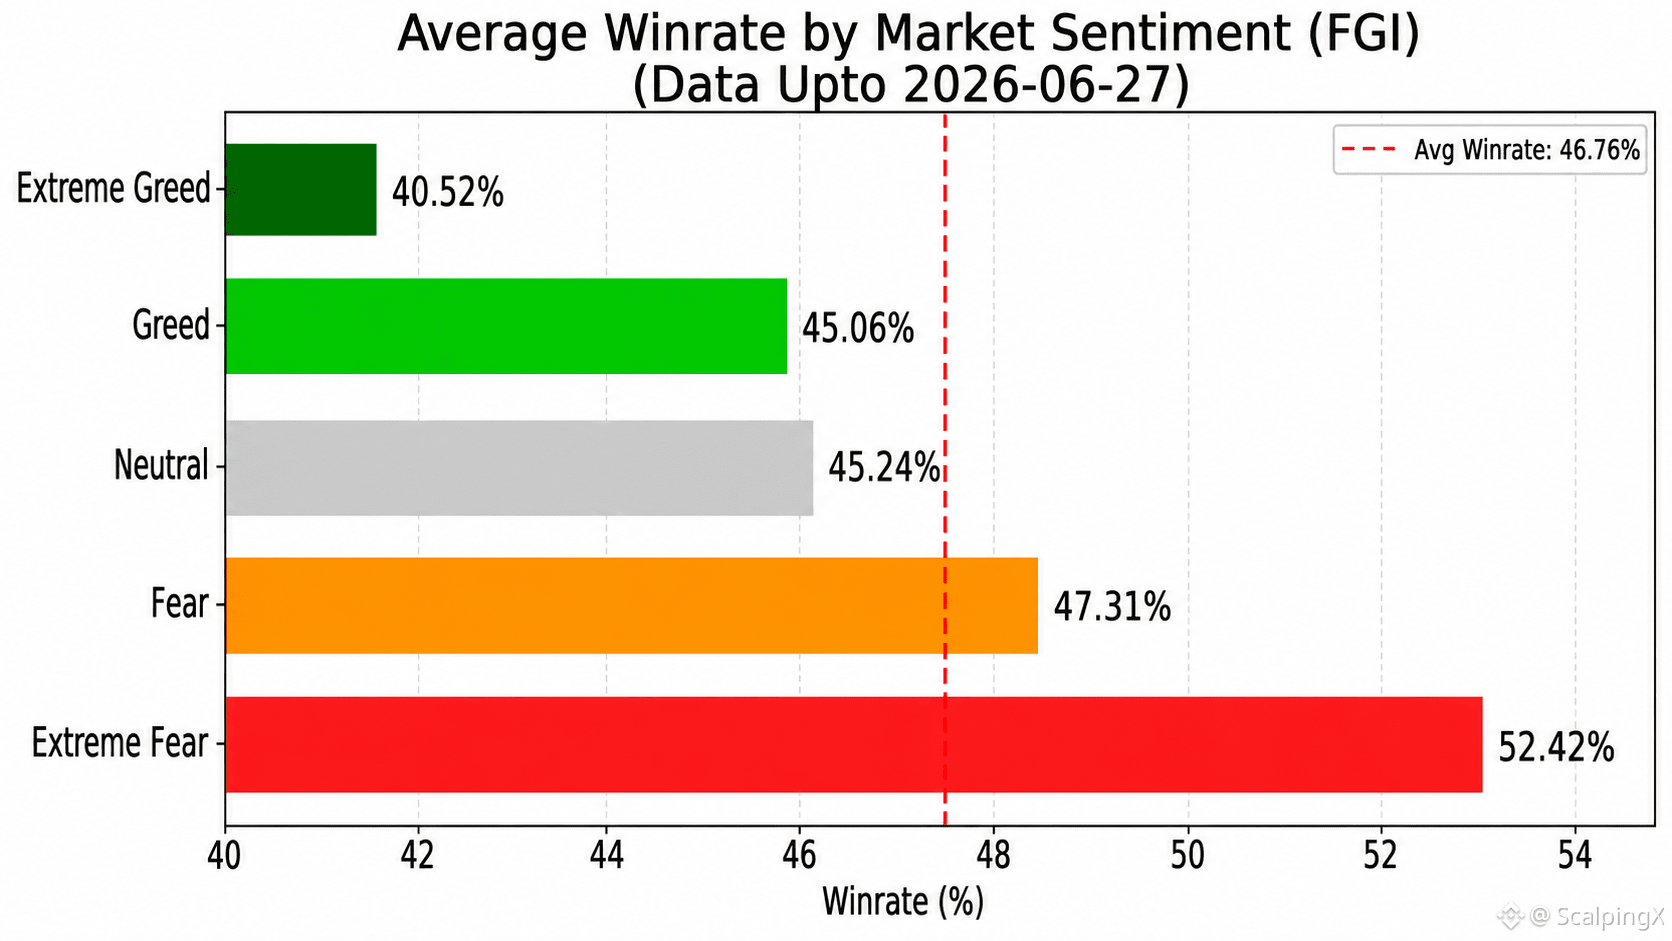
📊 PERFORMANCE DE TRADING & RAPPORT DE L’INDICE DE PEUR ET DE L’APPÉTIT (FGI) – MIS À JOUR LE 27/06/2026
Les dernières données statistiques montrent que la corrélation entre le FGI et le taux de réussite (Winrate) reste faible et continue de pencher dans le négatif (r ~ -0,299). Cela renforce l’idée que le FGI n’est pas adapté comme outil pour prévoir la direction des prix ou identifier des points d’entrée, mais qu’il conserve tout de même une utilité pratique pour mesurer le risque de position. En général, la performance de trading a tendance à baisser lorsque le sentiment du marché entre dans une euphorie extrême, ce qui rend le FGI plus utile comme signal d’alerte précoce du risque plutôt que comme signal pour augmenter les attentes de profit.
Voici un résumé du taux de réussite (WR), du ratio minimum d’équilibre (R:R) et du nombre de jours enregistrés (n) par zones de sentiment :
🤑 Euphorie extrême (≥80) : WR 40,5 % • R:R=1:1,47 • n=25
🤤 Appétit (60–80) : WR 45,1 % • R:R=1:1,22 • n=215
😐 Neutre (40–60) : WR 45,2 % • R:R=1:1,21 • n=150
😨 Peur (20–40) : WR 47,3 % • R:R=1:1,11 • n=225
😱 Peur extrême (<20) : WR 52,4 % • R:R=1:0,91 • n=110
Pourcentage de jours avec une performance au-dessus du niveau moyen (46,76 %) par zone de sentiment :
🤑 Euphorie extrême : 8,0 %
🤤 Appétit : 36,3 %
😐 Neutre : 38,0 %
😨 Peur : 53,8 %
😱 Peur extrême : 68,2 %
➤ Les scalpers peuvent utiliser le FGI comme guide pour ajuster les objectifs de profit attendus lors de l’entrée dans des trades :
📈 Lorsque le FGI est élevé, les traders devraient exiger un objectif de profit plus important pour maintenir un R:R suffisant et compenser le risque lié à un taux de réussite plus faible.
📉 Lorsque le FGI est bas, les traders peuvent réduire leurs attentes de profit afin d’améliorer la vitesse de rotation du capital et de rendre la réalisation des profits plus facile.
#TradingPerformance $BTC $ETH $SOL
📊 PERFORMANCE DE TRADING & RAPPORT DE L’INDICE DE PEUR ET DE L’APPÉTIT (FGI) – MIS À JOUR LE 27/06/2026
Les dernières données statistiques montrent que la corrélation entre le FGI et le taux de réussite (Winrate) reste faible et continue de pencher dans le négatif (r ~ -0,299). Cela renforce l’idée que le FGI n’est pas adapté comme outil pour prévoir la direction des prix ou identifier des points d’entrée, mais qu’il conserve tout de même une utilité pratique pour mesurer le risque de position. En général, la performance de trading a tendance à baisser lorsque le sentiment du marché entre dans une euphorie extrême, ce qui rend le FGI plus utile comme signal d’alerte précoce du risque plutôt que comme signal pour augmenter les attentes de profit.
Voici un résumé du taux de réussite (WR), du ratio minimum d’équilibre (R:R) et du nombre de jours enregistrés (n) par zones de sentiment :
🤑 Euphorie extrême (≥80) : WR 40,5 % • R:R=1:1,47 • n=25
🤤 Appétit (60–80) : WR 45,1 % • R:R=1:1,22 • n=215
😐 Neutre (40–60) : WR 45,2 % • R:R=1:1,21 • n=150
😨 Peur (20–40) : WR 47,3 % • R:R=1:1,11 • n=225
😱 Peur extrême (<20) : WR 52,4 % • R:R=1:0,91 • n=110
Pourcentage de jours avec une performance au-dessus du niveau moyen (46,76 %) par zone de sentiment :
🤑 Euphorie extrême : 8,0 %
🤤 Appétit : 36,3 %
😐 Neutre : 38,0 %
😨 Peur : 53,8 %
😱 Peur extrême : 68,2 %
➤ Les scalpers peuvent utiliser le FGI comme guide pour ajuster les objectifs de profit attendus lors de l’entrée dans des trades :
📈 Lorsque le FGI est élevé, les traders devraient exiger un objectif de profit plus important pour maintenir un R:R suffisant et compenser le risque lié à un taux de réussite plus faible.
📉 Lorsque le FGI est bas, les traders peuvent réduire leurs attentes de profit afin d’améliorer la vitesse de rotation du capital et de rendre la réalisation des profits plus facile.
#TradingPerformance $BTC $ETH $SOL
Les dernières données statistiques montrent que la corrélation entre le FGI et le taux de réussite (Winrate) reste faible et continue de pencher dans le négatif (r ~ -0,299). Cela renforce l’idée que le FGI n’est pas adapté comme outil pour prévoir la direction des prix ou identifier des points d’entrée, mais qu’il conserve tout de même une utilité pratique pour mesurer le risque de position. En général, la performance de trading a tendance à baisser lorsque le sentiment du marché entre dans une euphorie extrême, ce qui rend le FGI plus utile comme signal d’alerte précoce du risque plutôt que comme signal pour augmenter les attentes de profit.
Voici un résumé du taux de réussite (WR), du ratio minimum d’équilibre (R:R) et du nombre de jours enregistrés (n) par zones de sentiment :
🤑 Euphorie extrême (≥80) : WR 40,5 % • R:R=1:1,47 • n=25
🤤 Appétit (60–80) : WR 45,1 % • R:R=1:1,22 • n=215
😐 Neutre (40–60) : WR 45,2 % • R:R=1:1,21 • n=150
😨 Peur (20–40) : WR 47,3 % • R:R=1:1,11 • n=225
😱 Peur extrême (<20) : WR 52,4 % • R:R=1:0,91 • n=110
Pourcentage de jours avec une performance au-dessus du niveau moyen (46,76 %) par zone de sentiment :
🤑 Euphorie extrême : 8,0 %
🤤 Appétit : 36,3 %
😐 Neutre : 38,0 %
😨 Peur : 53,8 %
😱 Peur extrême : 68,2 %
➤ Les scalpers peuvent utiliser le FGI comme guide pour ajuster les objectifs de profit attendus lors de l’entrée dans des trades :
📈 Lorsque le FGI est élevé, les traders devraient exiger un objectif de profit plus important pour maintenir un R:R suffisant et compenser le risque lié à un taux de réussite plus faible.
📉 Lorsque le FGI est bas, les traders peuvent réduire leurs attentes de profit afin d’améliorer la vitesse de rotation du capital et de rendre la réalisation des profits plus facile.
#TradingPerformance $BTC $ETH $SOL
126
·
--
Haussier
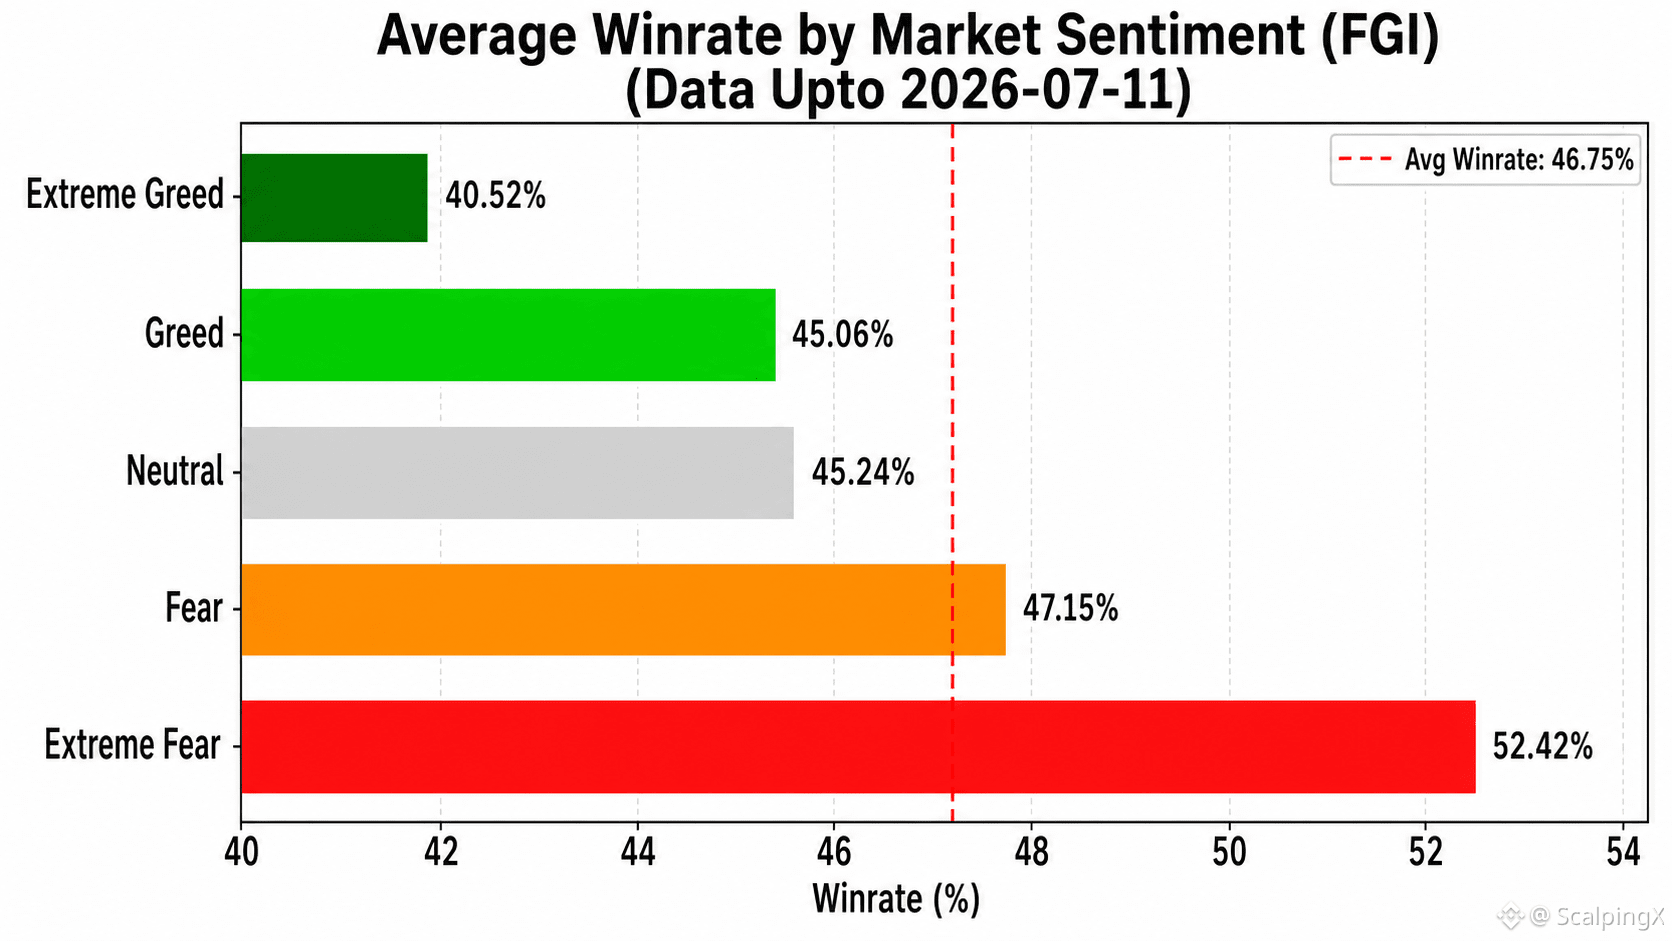
📊 PERFORMANCE DE TRADING & INDICE D’APPRÉCIATION DU MARCHÉ (FGI) — RAPPORT MIS À JOUR LE 11/07/2026
Les données les plus récentes montrent que la corrélation entre le FGI et le Taux de Victoire (Win Rate) reste faible et continue d’orienter négativement (r ≈ -0,295). Cela renforce davantage que le FGI n’est pas adapté pour prédire la direction des prix ou identifier des points d’entrée, mais il peut tout de même apporter une valeur pratique pour évaluer le risque de trading. Globalement, la performance a tendance à décliner lorsque l’humeur du marché s’approche d’une euphorie extrême, ce qui rend le FGI plus utile comme indicateur précoce d’alerte sur le risque que comme signal pour élargir les objectifs de profit.
Voici un résumé du Taux de Victoire (WR), du R:R minimum à l’équilibre et du nombre de jours enregistrés (n) pour chaque zone de sentiment :
🤑 Extrême cupidité (≥80) : WR 40,5% • R:R=1:1,47 • n=25
🤤 Cupidite (60–80) : WR 45,1% • R:R=1:1,22 • n=215
😐 Neutre (40–60) : WR 45,2% • R:R=1:1,21 • n=150
😨 Peur (20–40) : WR 47,1% • R:R=1:1,12 • n=234
😱 Peur extrême (<20) : WR 52,4% • R:R=1:0,91 • n=115
Pourcentage de jours avec une performance au-dessus de la moyenne globale de 46,75% dans chaque zone de sentiment :
🤑 Extrême cupidité : 8,0%
🤤 Cupidite : 36,3%
😐 Neutre : 38,0%
😨 Peur : 52,6%
😱 Peur extrême : 67,8%
➤ Les scalpers peuvent utiliser le FGI comme référence pour ajuster les objectifs de profit attendus lors de l’entrée dans des trades :
📈 Lorsque le FGI est élevé, les objectifs de profit attendus devraient être augmentés afin de maintenir un ratio R:R suffisamment élevé et de compenser le taux de victoire plus faible.
📉 Lorsque le FGI est faible, les objectifs de profit attendus peuvent être réduits pour améliorer la rotation du capital et rendre les profits plus faciles à réaliser.
#TradingPerformance $BNB $GRAM $HYPE
📊 PERFORMANCE DE TRADING & INDICE D’APPRÉCIATION DU MARCHÉ (FGI) — RAPPORT MIS À JOUR LE 11/07/2026
Les données les plus récentes montrent que la corrélation entre le FGI et le Taux de Victoire (Win Rate) reste faible et continue d’orienter négativement (r ≈ -0,295). Cela renforce davantage que le FGI n’est pas adapté pour prédire la direction des prix ou identifier des points d’entrée, mais il peut tout de même apporter une valeur pratique pour évaluer le risque de trading. Globalement, la performance a tendance à décliner lorsque l’humeur du marché s’approche d’une euphorie extrême, ce qui rend le FGI plus utile comme indicateur précoce d’alerte sur le risque que comme signal pour élargir les objectifs de profit.
Voici un résumé du Taux de Victoire (WR), du R:R minimum à l’équilibre et du nombre de jours enregistrés (n) pour chaque zone de sentiment :
🤑 Extrême cupidité (≥80) : WR 40,5% • R:R=1:1,47 • n=25
🤤 Cupidite (60–80) : WR 45,1% • R:R=1:1,22 • n=215
😐 Neutre (40–60) : WR 45,2% • R:R=1:1,21 • n=150
😨 Peur (20–40) : WR 47,1% • R:R=1:1,12 • n=234
😱 Peur extrême (<20) : WR 52,4% • R:R=1:0,91 • n=115
Pourcentage de jours avec une performance au-dessus de la moyenne globale de 46,75% dans chaque zone de sentiment :
🤑 Extrême cupidité : 8,0%
🤤 Cupidite : 36,3%
😐 Neutre : 38,0%
😨 Peur : 52,6%
😱 Peur extrême : 67,8%
➤ Les scalpers peuvent utiliser le FGI comme référence pour ajuster les objectifs de profit attendus lors de l’entrée dans des trades :
📈 Lorsque le FGI est élevé, les objectifs de profit attendus devraient être augmentés afin de maintenir un ratio R:R suffisamment élevé et de compenser le taux de victoire plus faible.
📉 Lorsque le FGI est faible, les objectifs de profit attendus peuvent être réduits pour améliorer la rotation du capital et rendre les profits plus faciles à réaliser.
#TradingPerformance $BNB $GRAM $HYPE
Les données les plus récentes montrent que la corrélation entre le FGI et le Taux de Victoire (Win Rate) reste faible et continue d’orienter négativement (r ≈ -0,295). Cela renforce davantage que le FGI n’est pas adapté pour prédire la direction des prix ou identifier des points d’entrée, mais il peut tout de même apporter une valeur pratique pour évaluer le risque de trading. Globalement, la performance a tendance à décliner lorsque l’humeur du marché s’approche d’une euphorie extrême, ce qui rend le FGI plus utile comme indicateur précoce d’alerte sur le risque que comme signal pour élargir les objectifs de profit.
Voici un résumé du Taux de Victoire (WR), du R:R minimum à l’équilibre et du nombre de jours enregistrés (n) pour chaque zone de sentiment :
🤑 Extrême cupidité (≥80) : WR 40,5% • R:R=1:1,47 • n=25
🤤 Cupidite (60–80) : WR 45,1% • R:R=1:1,22 • n=215
😐 Neutre (40–60) : WR 45,2% • R:R=1:1,21 • n=150
😨 Peur (20–40) : WR 47,1% • R:R=1:1,12 • n=234
😱 Peur extrême (<20) : WR 52,4% • R:R=1:0,91 • n=115
Pourcentage de jours avec une performance au-dessus de la moyenne globale de 46,75% dans chaque zone de sentiment :
🤑 Extrême cupidité : 8,0%
🤤 Cupidite : 36,3%
😐 Neutre : 38,0%
😨 Peur : 52,6%
😱 Peur extrême : 67,8%
➤ Les scalpers peuvent utiliser le FGI comme référence pour ajuster les objectifs de profit attendus lors de l’entrée dans des trades :
📈 Lorsque le FGI est élevé, les objectifs de profit attendus devraient être augmentés afin de maintenir un ratio R:R suffisamment élevé et de compenser le taux de victoire plus faible.
📉 Lorsque le FGI est faible, les objectifs de profit attendus peuvent être réduits pour améliorer la rotation du capital et rendre les profits plus faciles à réaliser.
#TradingPerformance $BNB $GRAM $HYPE
109
·
--
Haussier
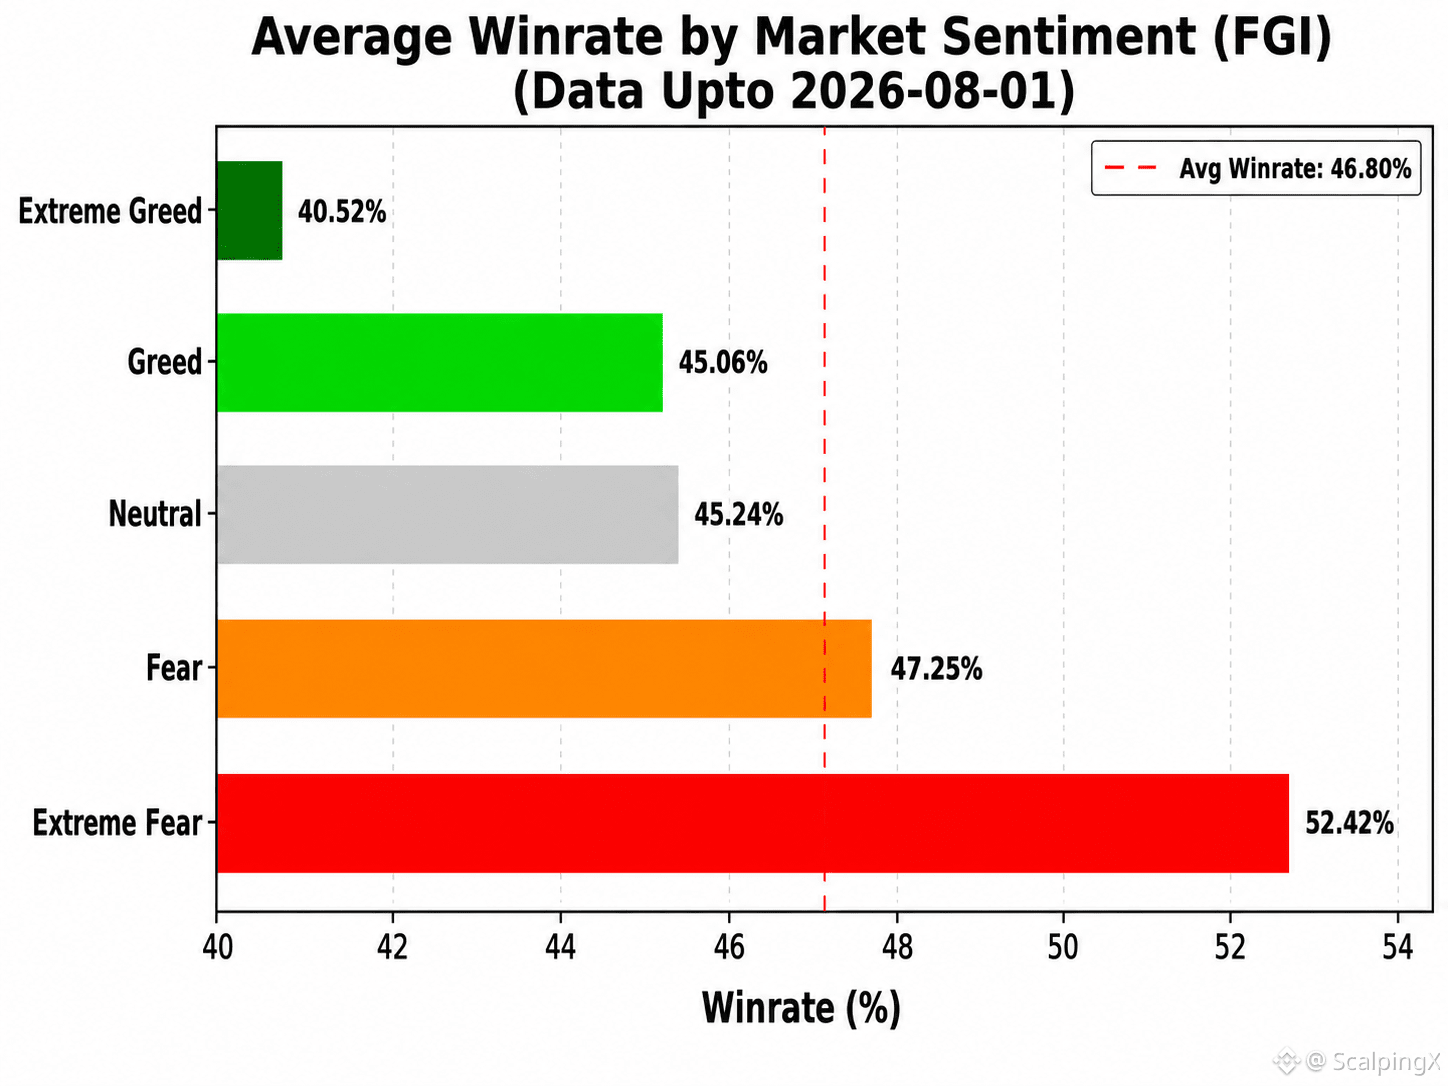
📊 PERFORMANCE DE TRADING & RAPPORT SUR L’INDICE DE SENTIMENT DU MARCHÉ (FGI) – MIS À JOUR LE 01/08/2026
Les données les plus récentes montrent que la corrélation entre l’Indice de Peur & de Convoitise et le Taux de Victoire reste faible et négative, avec environ r = -0,291. Cela suggère que le FGI n’est pas adapté comme outil autonome pour prédire la direction des prix ou identifier des points d’entrée d’ordres, mais qu’il peut tout de même apporter une valeur pratique pour l’évaluation du risque. La performance de trading a généralement tendance à s’affaiblir lorsque le sentiment du marché approche des niveaux d’optimisme extrêmes, ce qui rend le FGI plus utile comme indicateur précoce d’alerte sur le risque que comme signal pour augmenter des objectifs de profit.
Ci-dessous un résumé du Taux de Victoire (WR), du ratio minimum de rentabilité R:R, et du nombre de jours enregistrés (n) pour chaque zone de sentiment :
🤑 Convoitise Extrême (≥80) : WR 40,5% • R:R=1:1,47 • n=25
🤤 Convoitise (60–80) : WR 45,1% • R:R=1:1,22 • n=215
😐 Neutre (40–60) : WR 45,2% • R:R=1:1,21 • n=150
😨 Peur (20–40) : WR 47,3% • R:R=1:1,12 • n=255
😱 Peur Extrême (<20) : WR 52,4% • R:R=1:0,91 • n=115
Le pourcentage de jours où la performance dépasse la moyenne globale de 46,80% dans chaque zone :
🤑 Convoitise Extrême : 8,0%
🤤 Convoitise : 36,3%
😐 Neutre : 38,0%
😨 Peur : 53,7%
😱 Peur Extrême : 67,8%
➤ Les scalpeurs peuvent utiliser le FGI comme référence pour ajuster leurs objectifs de profit attendus lors du trading :
📈 Lorsque le FGI est élevé, les traders devraient augmenter leur objectif de profit attendu afin de maintenir un R:R suffisamment élevé et compenser le taux de victoire plus faible.
📉 Lorsque le FGI est faible, les traders peuvent réduire leur objectif de profit attendu pour accélérer la rotation du capital et réaliser plus facilement des profits.
#TradingPerformance $BNB $ETH $VANRY
📊 PERFORMANCE DE TRADING & RAPPORT SUR L’INDICE DE SENTIMENT DU MARCHÉ (FGI) – MIS À JOUR LE 01/08/2026
Les données les plus récentes montrent que la corrélation entre l’Indice de Peur & de Convoitise et le Taux de Victoire reste faible et négative, avec environ r = -0,291. Cela suggère que le FGI n’est pas adapté comme outil autonome pour prédire la direction des prix ou identifier des points d’entrée d’ordres, mais qu’il peut tout de même apporter une valeur pratique pour l’évaluation du risque. La performance de trading a généralement tendance à s’affaiblir lorsque le sentiment du marché approche des niveaux d’optimisme extrêmes, ce qui rend le FGI plus utile comme indicateur précoce d’alerte sur le risque que comme signal pour augmenter des objectifs de profit.
Ci-dessous un résumé du Taux de Victoire (WR), du ratio minimum de rentabilité R:R, et du nombre de jours enregistrés (n) pour chaque zone de sentiment :
🤑 Convoitise Extrême (≥80) : WR 40,5% • R:R=1:1,47 • n=25
🤤 Convoitise (60–80) : WR 45,1% • R:R=1:1,22 • n=215
😐 Neutre (40–60) : WR 45,2% • R:R=1:1,21 • n=150
😨 Peur (20–40) : WR 47,3% • R:R=1:1,12 • n=255
😱 Peur Extrême (<20) : WR 52,4% • R:R=1:0,91 • n=115
Le pourcentage de jours où la performance dépasse la moyenne globale de 46,80% dans chaque zone :
🤑 Convoitise Extrême : 8,0%
🤤 Convoitise : 36,3%
😐 Neutre : 38,0%
😨 Peur : 53,7%
😱 Peur Extrême : 67,8%
➤ Les scalpeurs peuvent utiliser le FGI comme référence pour ajuster leurs objectifs de profit attendus lors du trading :
📈 Lorsque le FGI est élevé, les traders devraient augmenter leur objectif de profit attendu afin de maintenir un R:R suffisamment élevé et compenser le taux de victoire plus faible.
📉 Lorsque le FGI est faible, les traders peuvent réduire leur objectif de profit attendu pour accélérer la rotation du capital et réaliser plus facilement des profits.
#TradingPerformance $BNB $ETH $VANRY
Les données les plus récentes montrent que la corrélation entre l’Indice de Peur & de Convoitise et le Taux de Victoire reste faible et négative, avec environ r = -0,291. Cela suggère que le FGI n’est pas adapté comme outil autonome pour prédire la direction des prix ou identifier des points d’entrée d’ordres, mais qu’il peut tout de même apporter une valeur pratique pour l’évaluation du risque. La performance de trading a généralement tendance à s’affaiblir lorsque le sentiment du marché approche des niveaux d’optimisme extrêmes, ce qui rend le FGI plus utile comme indicateur précoce d’alerte sur le risque que comme signal pour augmenter des objectifs de profit.
Ci-dessous un résumé du Taux de Victoire (WR), du ratio minimum de rentabilité R:R, et du nombre de jours enregistrés (n) pour chaque zone de sentiment :
🤑 Convoitise Extrême (≥80) : WR 40,5% • R:R=1:1,47 • n=25
🤤 Convoitise (60–80) : WR 45,1% • R:R=1:1,22 • n=215
😐 Neutre (40–60) : WR 45,2% • R:R=1:1,21 • n=150
😨 Peur (20–40) : WR 47,3% • R:R=1:1,12 • n=255
😱 Peur Extrême (<20) : WR 52,4% • R:R=1:0,91 • n=115
Le pourcentage de jours où la performance dépasse la moyenne globale de 46,80% dans chaque zone :
🤑 Convoitise Extrême : 8,0%
🤤 Convoitise : 36,3%
😐 Neutre : 38,0%
😨 Peur : 53,7%
😱 Peur Extrême : 67,8%
➤ Les scalpeurs peuvent utiliser le FGI comme référence pour ajuster leurs objectifs de profit attendus lors du trading :
📈 Lorsque le FGI est élevé, les traders devraient augmenter leur objectif de profit attendu afin de maintenir un R:R suffisamment élevé et compenser le taux de victoire plus faible.
📉 Lorsque le FGI est faible, les traders peuvent réduire leur objectif de profit attendu pour accélérer la rotation du capital et réaliser plus facilement des profits.
#TradingPerformance $BNB $ETH $VANRY
113
·
--
Haussier
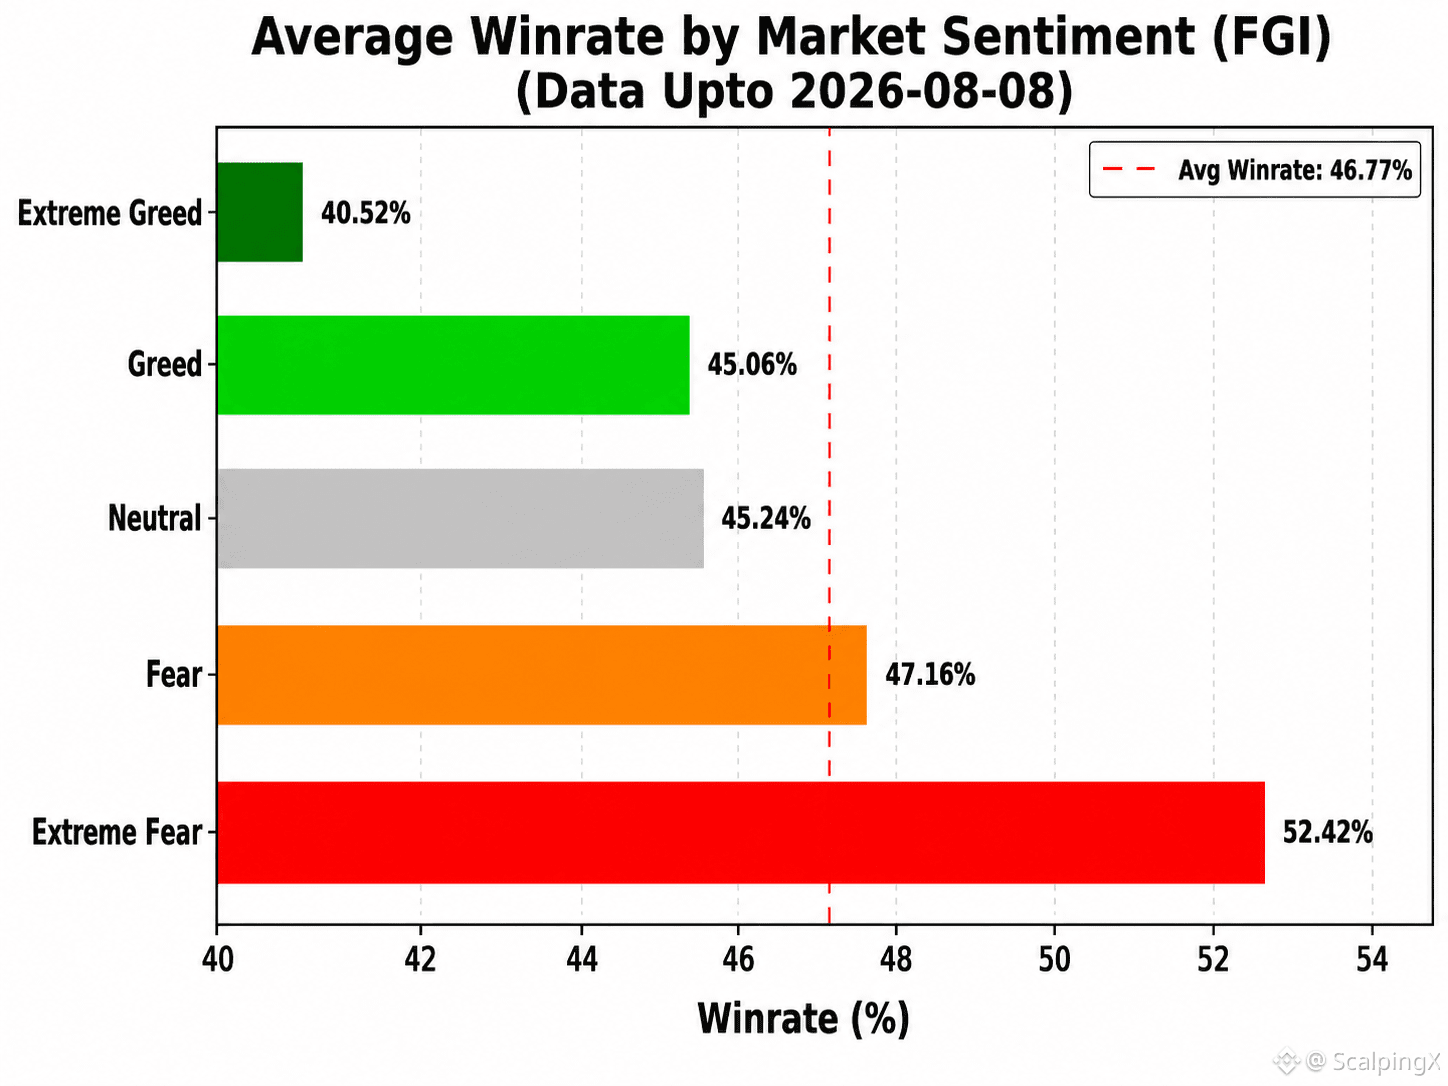
📊 PERFORMANCE DE TRADING & INDICE DE SENTIMENT DU MARCHÉ (FGI) – RAPPORT MIS À JOUR LE 08/08/2026
Les statistiques les plus récentes montrent que la corrélation entre le FGI et le taux de réussite (Win Rate) reste faible et continue de s’orienter vers le négatif, avec r ≈ -0.288. Cela suggère que le FGI n’est pas adapté comme outil autonome pour déterminer les entrées d’ordres, mais qu’il apporte tout de même de la valeur pour quantifier le risque. La performance de trading a généralement tendance à s’affaiblir lorsque le sentiment du marché se dirige vers une euphorie extrême, ce qui rend le FGI plus adapté comme indicateur précoce d’alerte sur le risque plutôt que comme signal pour augmenter les objectifs de profit.
Voici un résumé du taux de réussite (WR), du R:R minimal à l’équilibre, et du nombre de jours enregistrés (n) selon différentes zones de sentiment :
🤑 Extrême cupidité (≥80) : WR 40,5% • R:R=1:1,47 • n=25
🤤 C cupidité (60–80) : WR 45,1% • R:R=1:1,22 • n=215
😐 Neutre (40–60) : WR 45,2% • R:R=1:1,21 • n=150
😰 Peur (20–40) : WR 47,2% • R:R=1:1,12 • n=262
😱 Peur extrême (<20) : WR 52,4% • R:R=1:0,91 • n=115
Le pourcentage de jours avec une performance supérieure à la moyenne globale de 46,77% dans chaque zone de sentiment :
🤑 Extrême cupidité : 8,0%
🤤 Cupid ité : 36,3%
😐 Neutre : 38,0%
😰 Peur : 53,4%
😱 Peur extrême : 67,8%
➤ Les traders à court terme peuvent utiliser le FGI comme référence pour ajuster les objectifs de profit attendus lors de la prise de positions :
📈 Lorsque le FGI est élevé, les objectifs de profit attendus peuvent devoir être augmentés afin de maintenir un ratio R:R suffisamment élevé, ce qui aide à compenser le risque plus important associé à un taux de réussite plus faible.
📉 Lorsque le FGI est faible, les objectifs de profit attendus peuvent être réduits pour augmenter la rotation du capital et faciliter la réalisation des profits.
#TradingPerformance $SOL $ETH $BTC
📊 PERFORMANCE DE TRADING & INDICE DE SENTIMENT DU MARCHÉ (FGI) – RAPPORT MIS À JOUR LE 08/08/2026
Les statistiques les plus récentes montrent que la corrélation entre le FGI et le taux de réussite (Win Rate) reste faible et continue de s’orienter vers le négatif, avec r ≈ -0.288. Cela suggère que le FGI n’est pas adapté comme outil autonome pour déterminer les entrées d’ordres, mais qu’il apporte tout de même de la valeur pour quantifier le risque. La performance de trading a généralement tendance à s’affaiblir lorsque le sentiment du marché se dirige vers une euphorie extrême, ce qui rend le FGI plus adapté comme indicateur précoce d’alerte sur le risque plutôt que comme signal pour augmenter les objectifs de profit.
Voici un résumé du taux de réussite (WR), du R:R minimal à l’équilibre, et du nombre de jours enregistrés (n) selon différentes zones de sentiment :
🤑 Extrême cupidité (≥80) : WR 40,5% • R:R=1:1,47 • n=25
🤤 C cupidité (60–80) : WR 45,1% • R:R=1:1,22 • n=215
😐 Neutre (40–60) : WR 45,2% • R:R=1:1,21 • n=150
😰 Peur (20–40) : WR 47,2% • R:R=1:1,12 • n=262
😱 Peur extrême (<20) : WR 52,4% • R:R=1:0,91 • n=115
Le pourcentage de jours avec une performance supérieure à la moyenne globale de 46,77% dans chaque zone de sentiment :
🤑 Extrême cupidité : 8,0%
🤤 Cupid ité : 36,3%
😐 Neutre : 38,0%
😰 Peur : 53,4%
😱 Peur extrême : 67,8%
➤ Les traders à court terme peuvent utiliser le FGI comme référence pour ajuster les objectifs de profit attendus lors de la prise de positions :
📈 Lorsque le FGI est élevé, les objectifs de profit attendus peuvent devoir être augmentés afin de maintenir un ratio R:R suffisamment élevé, ce qui aide à compenser le risque plus important associé à un taux de réussite plus faible.
📉 Lorsque le FGI est faible, les objectifs de profit attendus peuvent être réduits pour augmenter la rotation du capital et faciliter la réalisation des profits.
#TradingPerformance $SOL $ETH $BTC
Les statistiques les plus récentes montrent que la corrélation entre le FGI et le taux de réussite (Win Rate) reste faible et continue de s’orienter vers le négatif, avec r ≈ -0.288. Cela suggère que le FGI n’est pas adapté comme outil autonome pour déterminer les entrées d’ordres, mais qu’il apporte tout de même de la valeur pour quantifier le risque. La performance de trading a généralement tendance à s’affaiblir lorsque le sentiment du marché se dirige vers une euphorie extrême, ce qui rend le FGI plus adapté comme indicateur précoce d’alerte sur le risque plutôt que comme signal pour augmenter les objectifs de profit.
Voici un résumé du taux de réussite (WR), du R:R minimal à l’équilibre, et du nombre de jours enregistrés (n) selon différentes zones de sentiment :
🤑 Extrême cupidité (≥80) : WR 40,5% • R:R=1:1,47 • n=25
🤤 C cupidité (60–80) : WR 45,1% • R:R=1:1,22 • n=215
😐 Neutre (40–60) : WR 45,2% • R:R=1:1,21 • n=150
😰 Peur (20–40) : WR 47,2% • R:R=1:1,12 • n=262
😱 Peur extrême (<20) : WR 52,4% • R:R=1:0,91 • n=115
Le pourcentage de jours avec une performance supérieure à la moyenne globale de 46,77% dans chaque zone de sentiment :
🤑 Extrême cupidité : 8,0%
🤤 Cupid ité : 36,3%
😐 Neutre : 38,0%
😰 Peur : 53,4%
😱 Peur extrême : 67,8%
➤ Les traders à court terme peuvent utiliser le FGI comme référence pour ajuster les objectifs de profit attendus lors de la prise de positions :
📈 Lorsque le FGI est élevé, les objectifs de profit attendus peuvent devoir être augmentés afin de maintenir un ratio R:R suffisamment élevé, ce qui aide à compenser le risque plus important associé à un taux de réussite plus faible.
📉 Lorsque le FGI est faible, les objectifs de profit attendus peuvent être réduits pour augmenter la rotation du capital et faciliter la réalisation des profits.
#TradingPerformance $SOL $ETH $BTC
42
·
--
Haussier
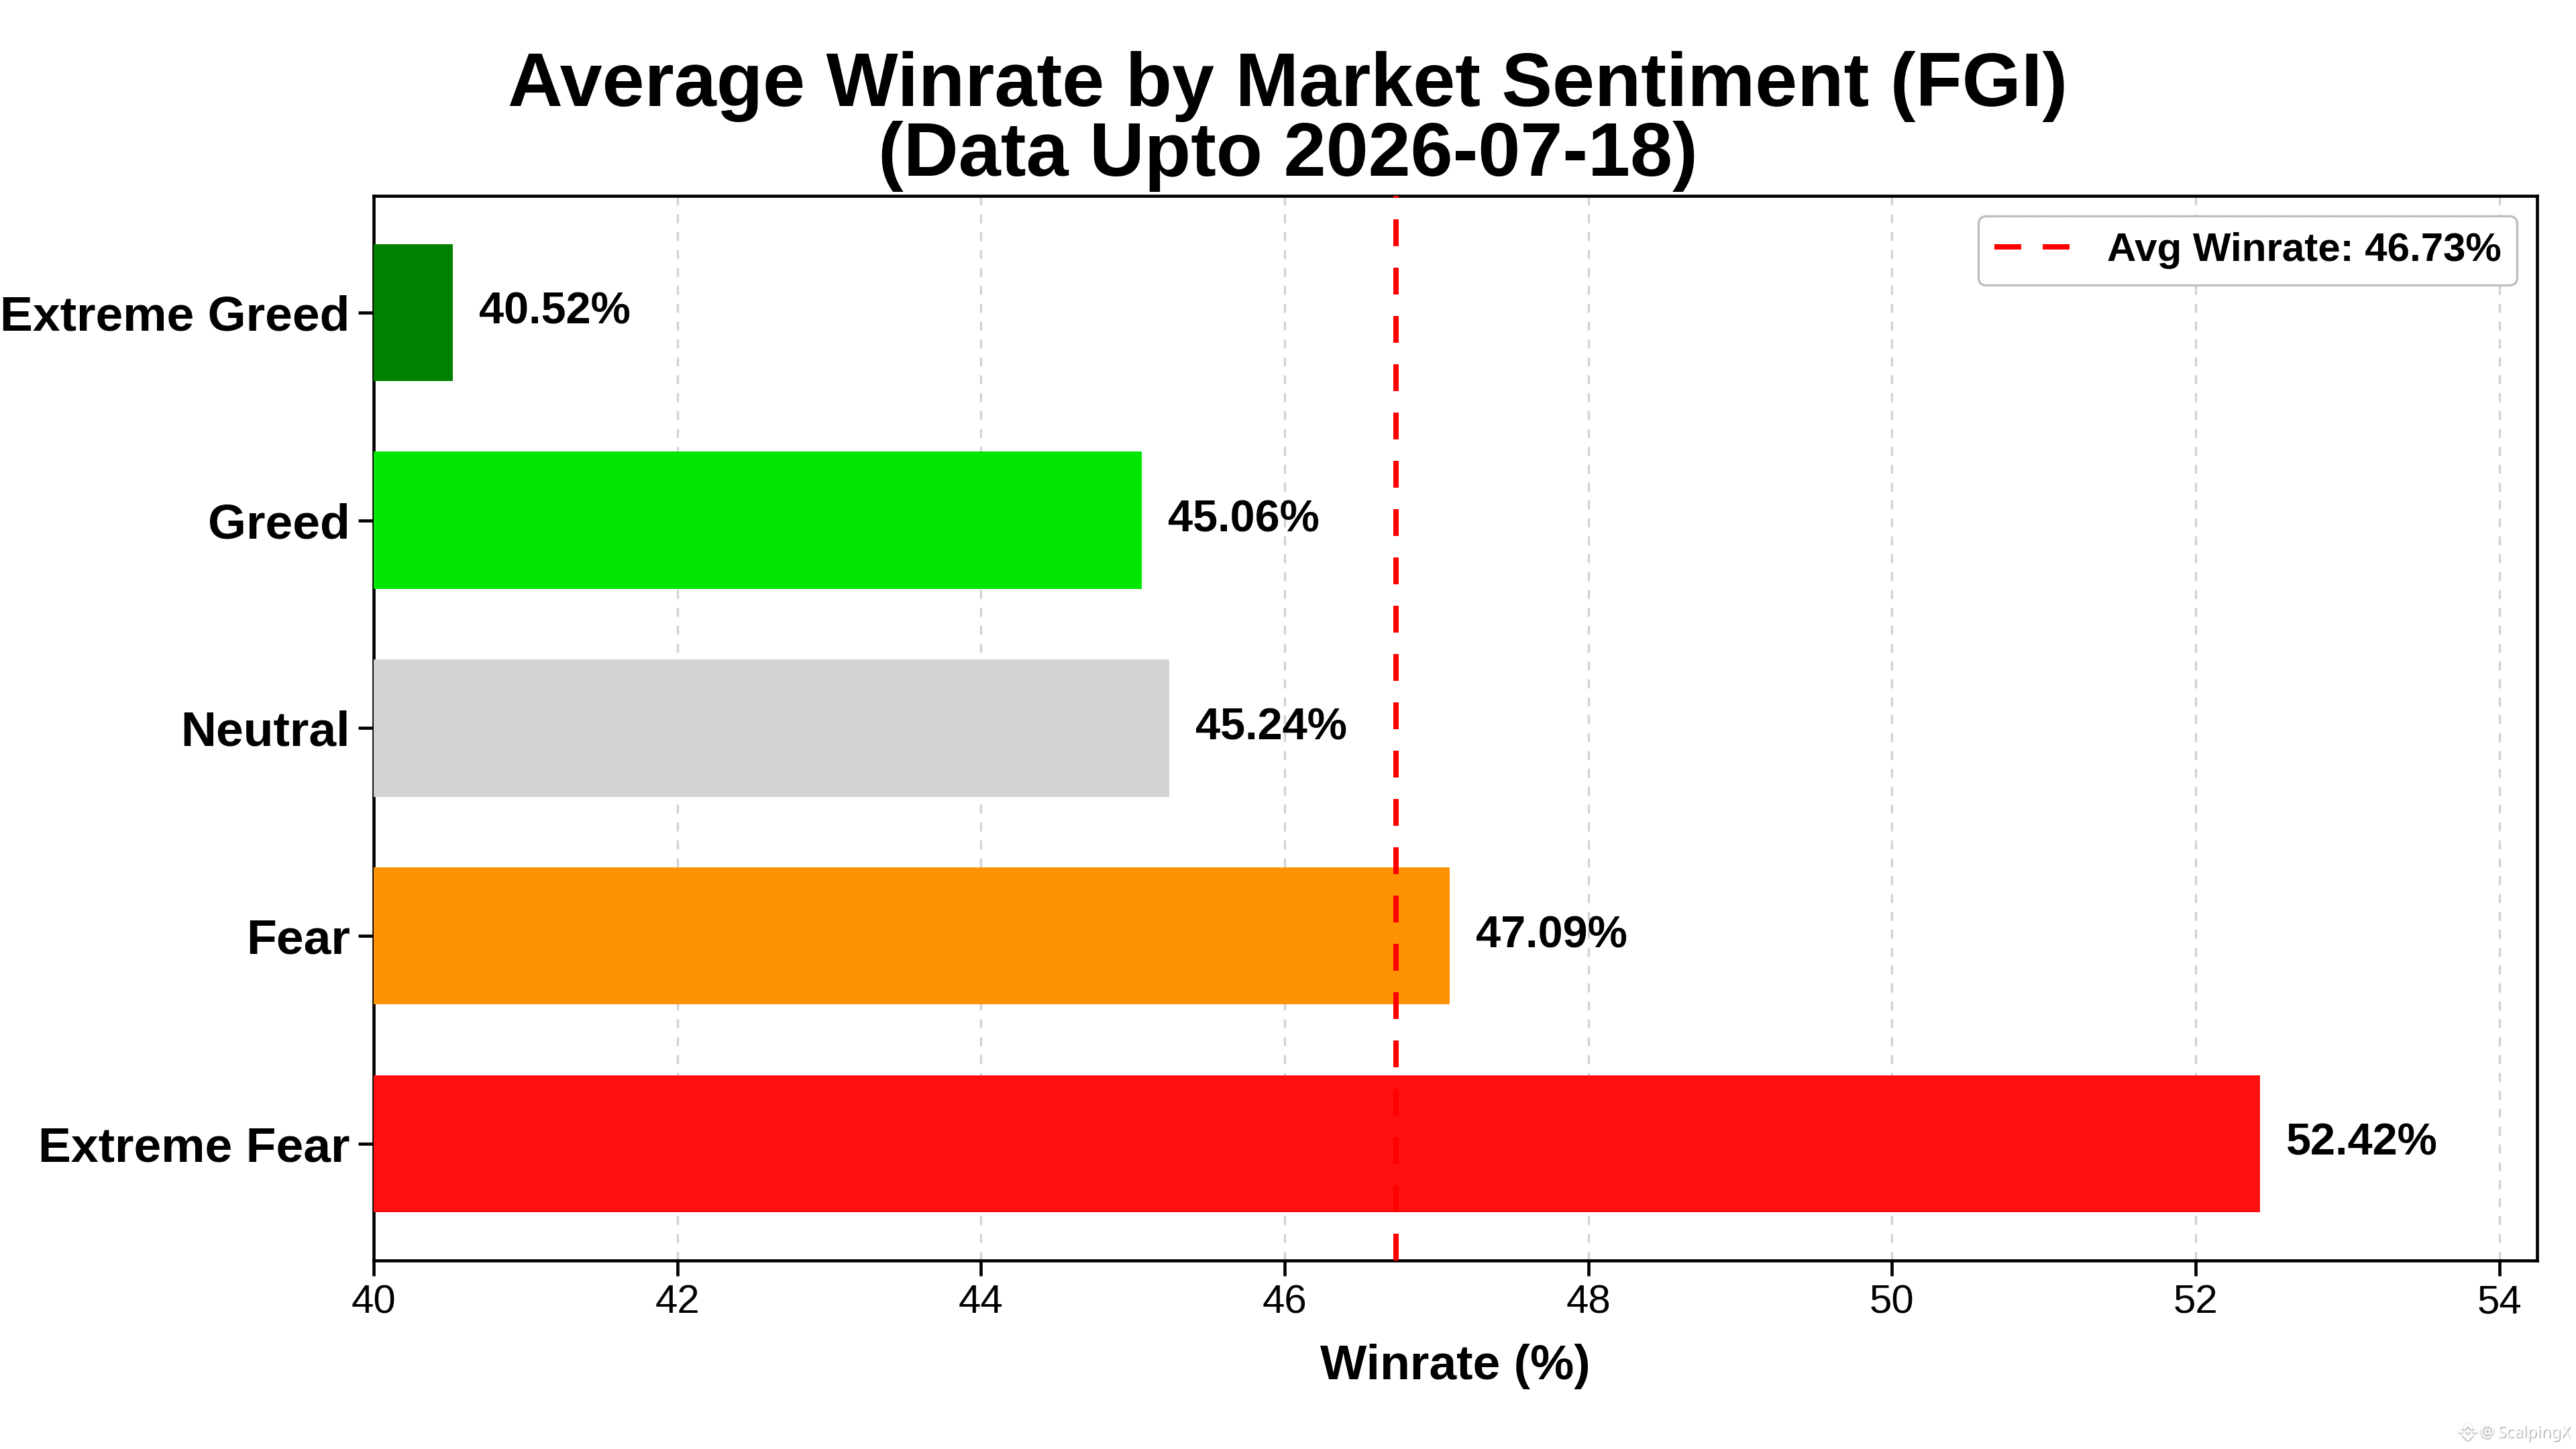
📊 RAPPORT DE PERFORMANCE DE TRADING & INDICE DE SENTIMENT DE MARCHÉ (FGI) – MIS À JOUR LE 18/07/2026
Les dernières données montrent que la corrélation entre le FGI et le Taux de Réussite (Win Rate) reste faible et continue de pencher négativement, à environ r = -0,291. Cela renforce encore l’idée que le FGI n’est pas adapté pour prédire la direction du prix ou identifier des points d’entrée, mais qu’il conserve une utilité pratique pour quantifier le risque des ordres. La performance de trading a généralement tendance à s’affaiblir lorsque le sentiment du marché entre dans des territoires extrêmement euphorique, ce qui rend le FGI plus utile comme indicateur précoce d’alerte sur le risque que comme signal pour étendre les objectifs de profit.
Ci-dessous un résumé du Taux de Réussite (WR), du R:R minimal à l’équilibre (break-even) et du nombre de jours enregistrés (n) pour chaque zone de sentiment :
🤑 Exubérance extrême (≥80) : WR 40,5% • R:R = 1:1,47 • n = 25
🤤 Satiété (60–80) : WR 45,1% • R:R = 1:1,22 • n = 215
😐 Neutre (40–60) : WR 45,2% • R:R = 1:1,21 • n = 150
😨 Peur (20–40) : WR 47,1% • R:R = 1:1,12 • n = 241
😱 Peur extrême (<20) : WR 52,4% • R:R = 1:0,91 • n = 115
Pourcentage des jours où la performance est supérieure à la moyenne globale de 46,73% dans chaque zone de sentiment :
🤑 Exubérance extrême : 8,0%
🤤 Satiété : 36,3%
😐 Neutre : 38,0%
😨 Peur : 52,7%
😱 Peur extrême : 67,8%
➤ Les scalpers peuvent utiliser le FGI comme référence pour ajuster les objectifs de profit attendus lors de l’entrée dans les trades :
📈 Lorsque le FGI est élevé, les traders devraient augmenter leur objectif de profit attendu afin de maintenir un R:R suffisamment large et compenser la baisse du taux de réussite.
📉 Lorsque le FGI est faible, les traders peuvent réduire leur objectif de profit attendu afin d’accélérer la rotation du capital et de réaliser les profits plus facilement.
#TradingPerformance $BTC $ETH $BNB
📊 RAPPORT DE PERFORMANCE DE TRADING & INDICE DE SENTIMENT DE MARCHÉ (FGI) – MIS À JOUR LE 18/07/2026
Les dernières données montrent que la corrélation entre le FGI et le Taux de Réussite (Win Rate) reste faible et continue de pencher négativement, à environ r = -0,291. Cela renforce encore l’idée que le FGI n’est pas adapté pour prédire la direction du prix ou identifier des points d’entrée, mais qu’il conserve une utilité pratique pour quantifier le risque des ordres. La performance de trading a généralement tendance à s’affaiblir lorsque le sentiment du marché entre dans des territoires extrêmement euphorique, ce qui rend le FGI plus utile comme indicateur précoce d’alerte sur le risque que comme signal pour étendre les objectifs de profit.
Ci-dessous un résumé du Taux de Réussite (WR), du R:R minimal à l’équilibre (break-even) et du nombre de jours enregistrés (n) pour chaque zone de sentiment :
🤑 Exubérance extrême (≥80) : WR 40,5% • R:R = 1:1,47 • n = 25
🤤 Satiété (60–80) : WR 45,1% • R:R = 1:1,22 • n = 215
😐 Neutre (40–60) : WR 45,2% • R:R = 1:1,21 • n = 150
😨 Peur (20–40) : WR 47,1% • R:R = 1:1,12 • n = 241
😱 Peur extrême (<20) : WR 52,4% • R:R = 1:0,91 • n = 115
Pourcentage des jours où la performance est supérieure à la moyenne globale de 46,73% dans chaque zone de sentiment :
🤑 Exubérance extrême : 8,0%
🤤 Satiété : 36,3%
😐 Neutre : 38,0%
😨 Peur : 52,7%
😱 Peur extrême : 67,8%
➤ Les scalpers peuvent utiliser le FGI comme référence pour ajuster les objectifs de profit attendus lors de l’entrée dans les trades :
📈 Lorsque le FGI est élevé, les traders devraient augmenter leur objectif de profit attendu afin de maintenir un R:R suffisamment large et compenser la baisse du taux de réussite.
📉 Lorsque le FGI est faible, les traders peuvent réduire leur objectif de profit attendu afin d’accélérer la rotation du capital et de réaliser les profits plus facilement.
#TradingPerformance $BTC $ETH $BNB
Les dernières données montrent que la corrélation entre le FGI et le Taux de Réussite (Win Rate) reste faible et continue de pencher négativement, à environ r = -0,291. Cela renforce encore l’idée que le FGI n’est pas adapté pour prédire la direction du prix ou identifier des points d’entrée, mais qu’il conserve une utilité pratique pour quantifier le risque des ordres. La performance de trading a généralement tendance à s’affaiblir lorsque le sentiment du marché entre dans des territoires extrêmement euphorique, ce qui rend le FGI plus utile comme indicateur précoce d’alerte sur le risque que comme signal pour étendre les objectifs de profit.
Ci-dessous un résumé du Taux de Réussite (WR), du R:R minimal à l’équilibre (break-even) et du nombre de jours enregistrés (n) pour chaque zone de sentiment :
🤑 Exubérance extrême (≥80) : WR 40,5% • R:R = 1:1,47 • n = 25
🤤 Satiété (60–80) : WR 45,1% • R:R = 1:1,22 • n = 215
😐 Neutre (40–60) : WR 45,2% • R:R = 1:1,21 • n = 150
😨 Peur (20–40) : WR 47,1% • R:R = 1:1,12 • n = 241
😱 Peur extrême (<20) : WR 52,4% • R:R = 1:0,91 • n = 115
Pourcentage des jours où la performance est supérieure à la moyenne globale de 46,73% dans chaque zone de sentiment :
🤑 Exubérance extrême : 8,0%
🤤 Satiété : 36,3%
😐 Neutre : 38,0%
😨 Peur : 52,7%
😱 Peur extrême : 67,8%
➤ Les scalpers peuvent utiliser le FGI comme référence pour ajuster les objectifs de profit attendus lors de l’entrée dans les trades :
📈 Lorsque le FGI est élevé, les traders devraient augmenter leur objectif de profit attendu afin de maintenir un R:R suffisamment large et compenser la baisse du taux de réussite.
📉 Lorsque le FGI est faible, les traders peuvent réduire leur objectif de profit attendu afin d’accélérer la rotation du capital et de réaliser les profits plus facilement.
#TradingPerformance $BTC $ETH $BNB
25
·
--
Haussier
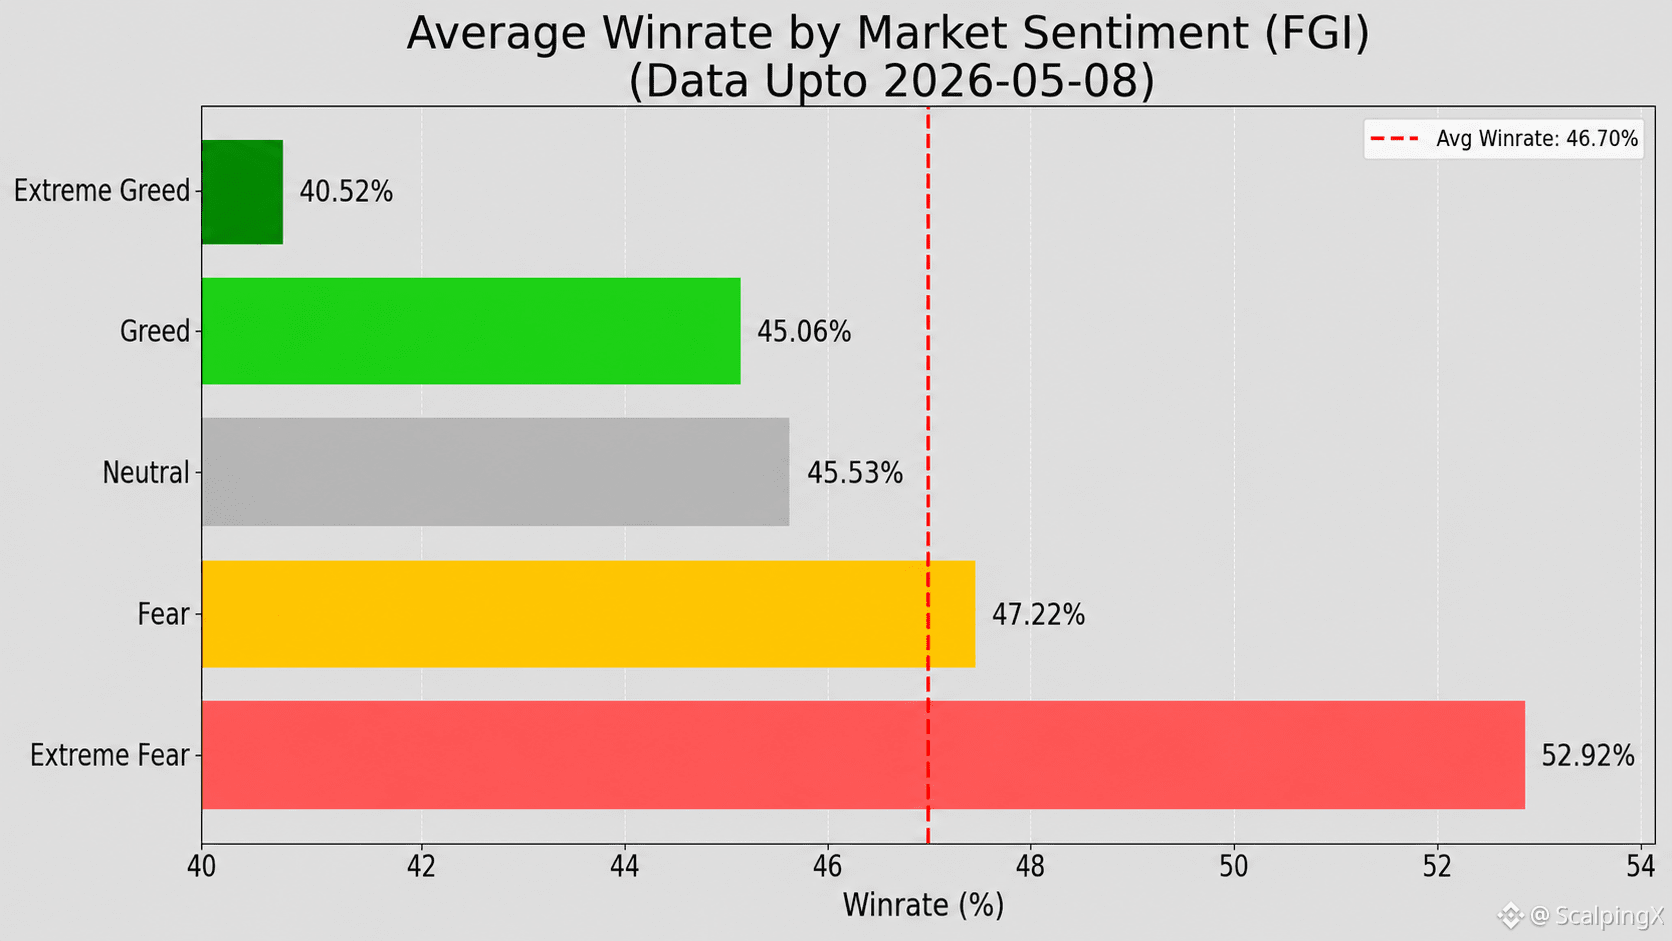
📊 PERFORMANCE DE TRADING & INDICE DE PEUR ET D'AVARICE (FGI) – MIS À JOUR 08/05/2026
Les dernières données statistiques montrent que la corrélation entre le FGI et le taux de réussite reste faible et continue de pencher vers le négatif (r ~ -0.325). Cela soutient toujours l'idée que le FGI n'est pas un outil adéquat pour prédire la direction des prix ou identifier les entrées de trade, mais il a toujours une valeur pratique pour quantifier le risque de position. Plus précisément, la performance de trading s'affaiblit généralement lorsque le sentiment du marché entre en euphorie extrême, rendant le FGI plus utile comme signal d'alerte précoce sur le risque plutôt que comme un signal pour élargir les attentes de profit.
Voici un résumé du taux de réussite (WR), du minimum breakeven R:R, et du nombre de jours enregistrés (n) à travers les zones de sentiment pour référence :
🤑 Avarice Extrême (≥80) : WR 40.5% • R:R=1:1.47 • n=25
🤤 Avarice (60–80) : WR 45.1% • R:R=1:1.22 • n=215
😐 Neutre (40–60) : WR 45.5% • R:R=1:1.20 • n=145
😨 Peur (20–40) : WR 47.2% • R:R=1:1.12 • n=198
😱 Peur Extrême (<20) : WR 52.9% • R:R=1:0.89 • n=92
Part des jours avec une performance au-dessus du niveau moyen (46.70%) par zone de sentiment :
🤑 Avarice Extrême : 8.0%
🤤 Avarice : 36.3%
😐 Neutre : 40.0%
😨 Peur : 55.1%
😱 Peur Extrême : 70.7%
➤ Les traders en scalping peuvent utiliser le FGI comme guide pour ajuster les attentes de profit lors de l'entrée en position :
📈 Lorsque le FGI est élevé, les attentes de profit devraient être augmentées pour maintenir un R:R suffisamment fort, aidant à compenser le risque d'un taux de réussite plus faible.
📉 Lorsque le FGI est bas, les attentes de profit peuvent être abaissées pour améliorer la vitesse de rotation du capital et faciliter la prise de profit.
#TradingPerformance $BTC $BNB $TON
📊 PERFORMANCE DE TRADING & INDICE DE PEUR ET D'AVARICE (FGI) – MIS À JOUR 08/05/2026
Les dernières données statistiques montrent que la corrélation entre le FGI et le taux de réussite reste faible et continue de pencher vers le négatif (r ~ -0.325). Cela soutient toujours l'idée que le FGI n'est pas un outil adéquat pour prédire la direction des prix ou identifier les entrées de trade, mais il a toujours une valeur pratique pour quantifier le risque de position. Plus précisément, la performance de trading s'affaiblit généralement lorsque le sentiment du marché entre en euphorie extrême, rendant le FGI plus utile comme signal d'alerte précoce sur le risque plutôt que comme un signal pour élargir les attentes de profit.
Voici un résumé du taux de réussite (WR), du minimum breakeven R:R, et du nombre de jours enregistrés (n) à travers les zones de sentiment pour référence :
🤑 Avarice Extrême (≥80) : WR 40.5% • R:R=1:1.47 • n=25
🤤 Avarice (60–80) : WR 45.1% • R:R=1:1.22 • n=215
😐 Neutre (40–60) : WR 45.5% • R:R=1:1.20 • n=145
😨 Peur (20–40) : WR 47.2% • R:R=1:1.12 • n=198
😱 Peur Extrême (<20) : WR 52.9% • R:R=1:0.89 • n=92
Part des jours avec une performance au-dessus du niveau moyen (46.70%) par zone de sentiment :
🤑 Avarice Extrême : 8.0%
🤤 Avarice : 36.3%
😐 Neutre : 40.0%
😨 Peur : 55.1%
😱 Peur Extrême : 70.7%
➤ Les traders en scalping peuvent utiliser le FGI comme guide pour ajuster les attentes de profit lors de l'entrée en position :
📈 Lorsque le FGI est élevé, les attentes de profit devraient être augmentées pour maintenir un R:R suffisamment fort, aidant à compenser le risque d'un taux de réussite plus faible.
📉 Lorsque le FGI est bas, les attentes de profit peuvent être abaissées pour améliorer la vitesse de rotation du capital et faciliter la prise de profit.
#TradingPerformance $BTC $BNB $TON
Les dernières données statistiques montrent que la corrélation entre le FGI et le taux de réussite reste faible et continue de pencher vers le négatif (r ~ -0.325). Cela soutient toujours l'idée que le FGI n'est pas un outil adéquat pour prédire la direction des prix ou identifier les entrées de trade, mais il a toujours une valeur pratique pour quantifier le risque de position. Plus précisément, la performance de trading s'affaiblit généralement lorsque le sentiment du marché entre en euphorie extrême, rendant le FGI plus utile comme signal d'alerte précoce sur le risque plutôt que comme un signal pour élargir les attentes de profit.
Voici un résumé du taux de réussite (WR), du minimum breakeven R:R, et du nombre de jours enregistrés (n) à travers les zones de sentiment pour référence :
🤑 Avarice Extrême (≥80) : WR 40.5% • R:R=1:1.47 • n=25
🤤 Avarice (60–80) : WR 45.1% • R:R=1:1.22 • n=215
😐 Neutre (40–60) : WR 45.5% • R:R=1:1.20 • n=145
😨 Peur (20–40) : WR 47.2% • R:R=1:1.12 • n=198
😱 Peur Extrême (<20) : WR 52.9% • R:R=1:0.89 • n=92
Part des jours avec une performance au-dessus du niveau moyen (46.70%) par zone de sentiment :
🤑 Avarice Extrême : 8.0%
🤤 Avarice : 36.3%
😐 Neutre : 40.0%
😨 Peur : 55.1%
😱 Peur Extrême : 70.7%
➤ Les traders en scalping peuvent utiliser le FGI comme guide pour ajuster les attentes de profit lors de l'entrée en position :
📈 Lorsque le FGI est élevé, les attentes de profit devraient être augmentées pour maintenir un R:R suffisamment fort, aidant à compenser le risque d'un taux de réussite plus faible.
📉 Lorsque le FGI est bas, les attentes de profit peuvent être abaissées pour améliorer la vitesse de rotation du capital et faciliter la prise de profit.
#TradingPerformance $BTC $BNB $TON
100

·
--
Baissier
📊 Mise à jour de la performance MacroPulse 🚀
Riding the global macro pulse — et les résultats parlent d'eux-mêmes !
✅ ROI total : +16,08 %
💰 Profit total (PnL) : 382 886,59 $
💼 Solde total de marge : 201 880 $
📅 Jours actifs : 107
🎯 Taux de victoire : 35,47 %
📉 MDD : 98,16 %
👥 Abonnés : 2 252 et en croissance !
Les mouvements récents sur SOL/USDT (40x Leverage) ont été 🔥, montrant une forte dynamique avec une stratégie de marge croisée intelligente.
📈 MacroPulse continue de livrer — équilibrant le risque, la précision et le timing du marché pour rester en avance sur la tendance.
👉 Suivez et abonnez-vous sur Binance pour surfer sur le pouls macro avec nous !
#Binance #CryptoTrading #MacroPulse #FuturesTrading #SOLUSDT #TradingPerformance #CryptoProfits
$BTC
{spot}(BTCUSDT)
📊 Mise à jour de la performance MacroPulse 🚀
Riding the global macro pulse — et les résultats parlent d'eux-mêmes !
✅ ROI total : +16,08 %
💰 Profit total (PnL) : 382 886,59 $
💼 Solde total de marge : 201 880 $
📅 Jours actifs : 107
🎯 Taux de victoire : 35,47 %
📉 MDD : 98,16 %
👥 Abonnés : 2 252 et en croissance !
Les mouvements récents sur SOL/USDT (40x Leverage) ont été 🔥, montrant une forte dynamique avec une stratégie de marge croisée intelligente.
📈 MacroPulse continue de livrer — équilibrant le risque, la précision et le timing du marché pour rester en avance sur la tendance.
👉 Suivez et abonnez-vous sur Binance pour surfer sur le pouls macro avec nous !
#Binance #CryptoTrading #MacroPulse #FuturesTrading #SOLUSDT #TradingPerformance #CryptoProfits
$BTC
Riding the global macro pulse — et les résultats parlent d'eux-mêmes !
✅ ROI total : +16,08 %
💰 Profit total (PnL) : 382 886,59 $
💼 Solde total de marge : 201 880 $
📅 Jours actifs : 107
🎯 Taux de victoire : 35,47 %
📉 MDD : 98,16 %
👥 Abonnés : 2 252 et en croissance !
Les mouvements récents sur SOL/USDT (40x Leverage) ont été 🔥, montrant une forte dynamique avec une stratégie de marge croisée intelligente.
📈 MacroPulse continue de livrer — équilibrant le risque, la précision et le timing du marché pour rester en avance sur la tendance.
👉 Suivez et abonnez-vous sur Binance pour surfer sur le pouls macro avec nous !
#Binance #CryptoTrading #MacroPulse #FuturesTrading #SOLUSDT #TradingPerformance #CryptoProfits
$BTC
6
25
·
--
Haussier
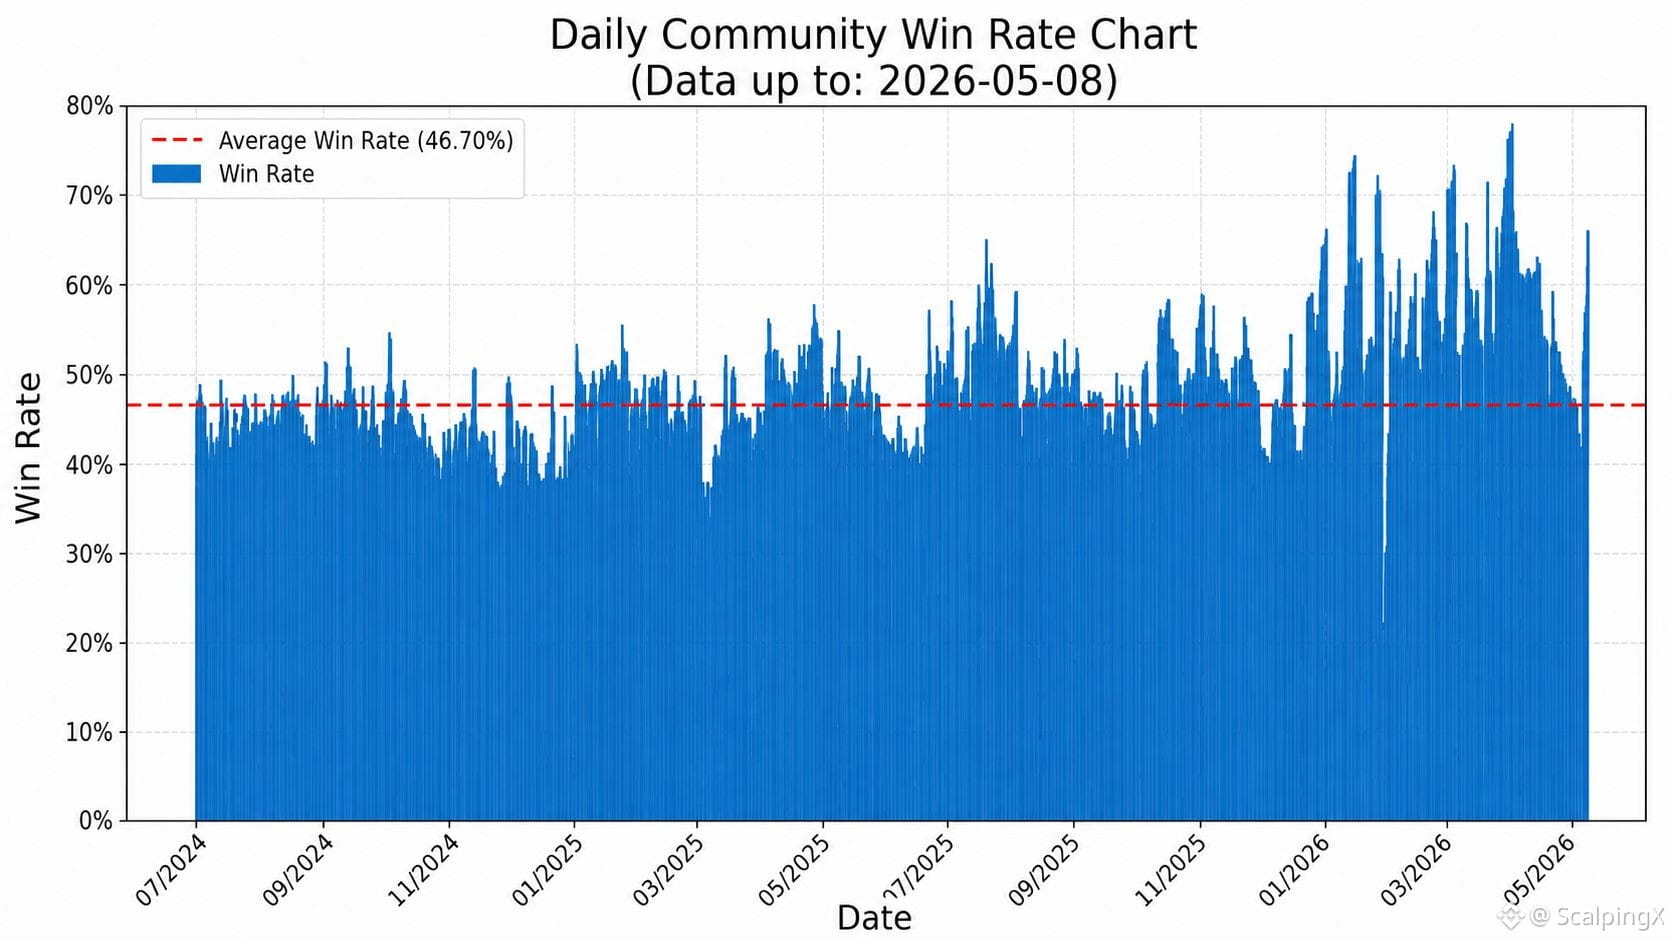
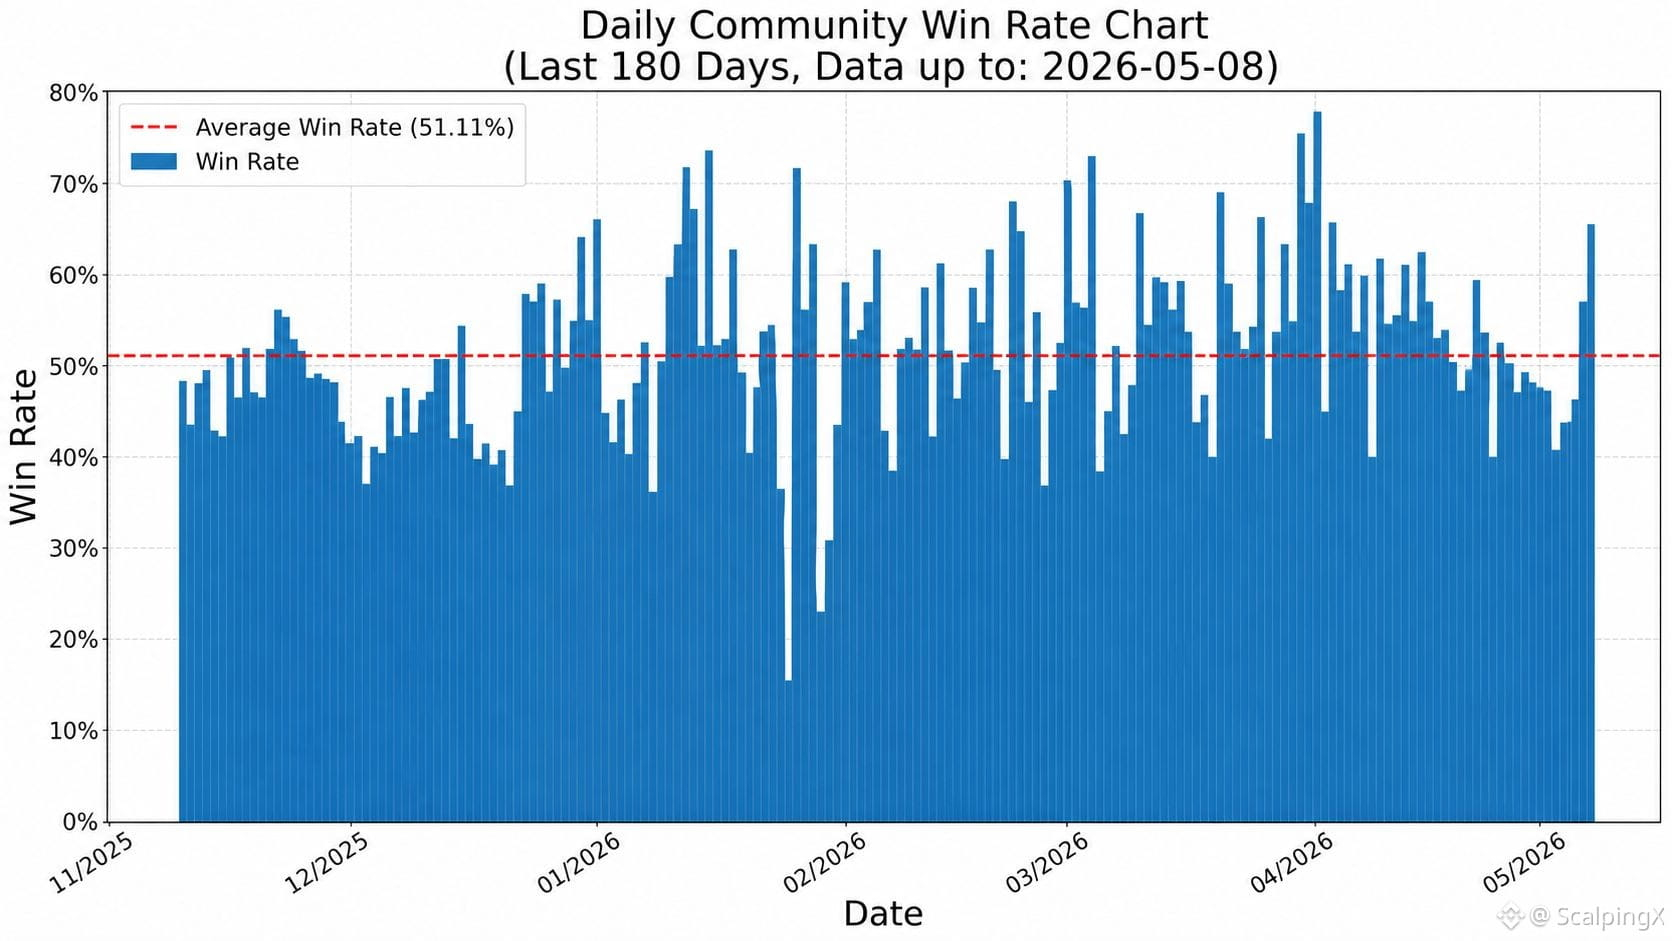
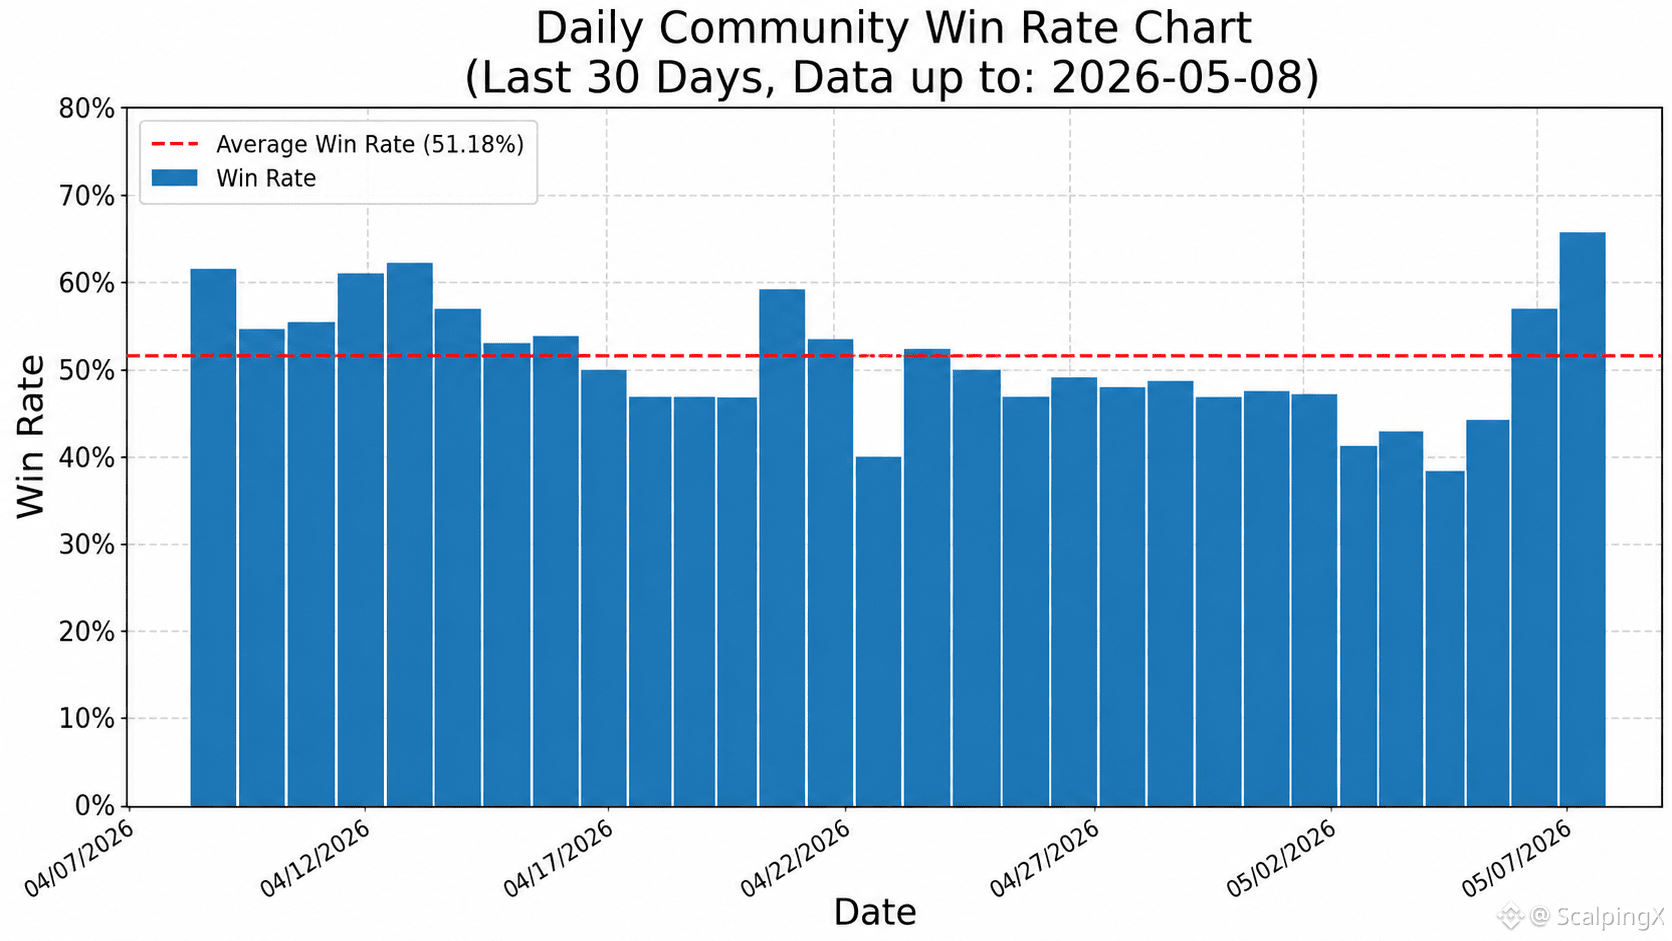
Mis à jour au 2026-05-08, données de trading communautaires :
📊 Le taux de réussite moyen est de 46,70%
🏆 Le jour avec le taux de réussite le plus élevé était le 2026-04-01 avec 78,08%. Le jour avec le taux de réussite le plus bas était le 2026-01-25 avec 15,69%
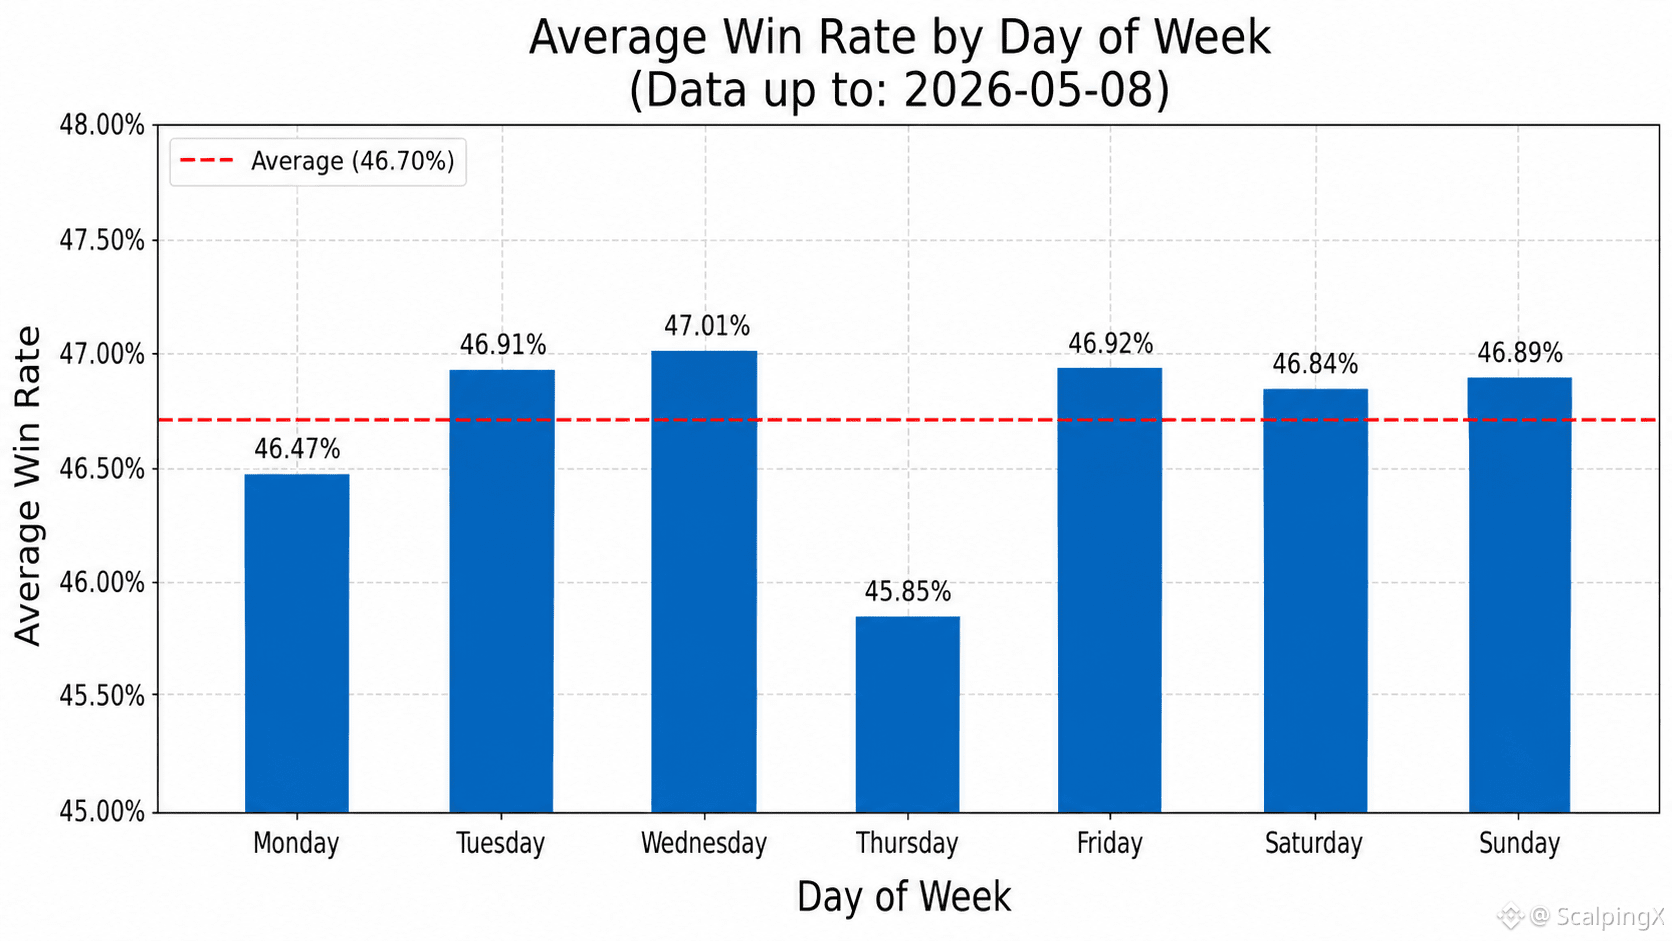
📅 Le jour de la semaine avec le taux de réussite moyen le plus élevé est le mercredi à 47,01%. Le jour de la semaine avec le taux de réussite moyen le plus bas est le jeudi à 45,85%
⏱️ La période de 7 jours la plus forte s'est terminée le 2026-04-05, avec un taux de réussite moyen de 63,27%. La période de 7 jours la plus faible s'est terminée le 2025-03-12, avec un taux de réussite moyen de 36,64%
⚖️ Le nombre de jours avec un taux de réussite supérieur à la moyenne est de 312. Le nombre de jours avec un taux de réussite égal ou inférieur à la moyenne est de 363
📈 Le nombre de jours avec un taux de réussite supérieur à 50% est de 186. Le nombre de jours avec un taux de réussite entre 40% et 50% est de 376. Le nombre de jours avec un taux de réussite inférieur à 40% est de 113
#TradingPerformance $BTC $TON $BNB
Mis à jour au 2026-05-08, données de trading communautaires :
📊 Le taux de réussite moyen est de 46,70%
🏆 Le jour avec le taux de réussite le plus élevé était le 2026-04-01 avec 78,08%. Le jour avec le taux de réussite le plus bas était le 2026-01-25 avec 15,69%
📅 Le jour de la semaine avec le taux de réussite moyen le plus élevé est le mercredi à 47,01%. Le jour de la semaine avec le taux de réussite moyen le plus bas est le jeudi à 45,85%
⏱️ La période de 7 jours la plus forte s'est terminée le 2026-04-05, avec un taux de réussite moyen de 63,27%. La période de 7 jours la plus faible s'est terminée le 2025-03-12, avec un taux de réussite moyen de 36,64%
⚖️ Le nombre de jours avec un taux de réussite supérieur à la moyenne est de 312. Le nombre de jours avec un taux de réussite égal ou inférieur à la moyenne est de 363
📈 Le nombre de jours avec un taux de réussite supérieur à 50% est de 186. Le nombre de jours avec un taux de réussite entre 40% et 50% est de 376. Le nombre de jours avec un taux de réussite inférieur à 40% est de 113
#TradingPerformance $BTC $TON $BNB
📊 Le taux de réussite moyen est de 46,70%
🏆 Le jour avec le taux de réussite le plus élevé était le 2026-04-01 avec 78,08%. Le jour avec le taux de réussite le plus bas était le 2026-01-25 avec 15,69%
📅 Le jour de la semaine avec le taux de réussite moyen le plus élevé est le mercredi à 47,01%. Le jour de la semaine avec le taux de réussite moyen le plus bas est le jeudi à 45,85%
⏱️ La période de 7 jours la plus forte s'est terminée le 2026-04-05, avec un taux de réussite moyen de 63,27%. La période de 7 jours la plus faible s'est terminée le 2025-03-12, avec un taux de réussite moyen de 36,64%
⚖️ Le nombre de jours avec un taux de réussite supérieur à la moyenne est de 312. Le nombre de jours avec un taux de réussite égal ou inférieur à la moyenne est de 363
📈 Le nombre de jours avec un taux de réussite supérieur à 50% est de 186. Le nombre de jours avec un taux de réussite entre 40% et 50% est de 376. Le nombre de jours avec un taux de réussite inférieur à 40% est de 113
#TradingPerformance $BTC $TON $BNB
66

·
--
Haussier
Mis à jour le 2026-05-08, données de trading au niveau communautaire :
📊 Le taux de victoire moyen est de 46,70%
🏆 Le jour avec le meilleur taux de victoire était le 2026-04-01 avec un taux de 78,08%. Le jour avec le pire taux de victoire était le 2026-01-25 avec un taux de 15,69%
📅 Le jour de la semaine avec le meilleur taux de victoire moyen est le mercredi avec un taux de 47,01%. Le jour de la semaine avec le pire taux de victoire moyen est le jeudi avec un taux de 45,85%
⏱️ La période de 7 jours la plus forte s'est terminée le 2026-04-05, avec un taux de victoire moyen de 63,27%. La période de 7 jours la plus faible s'est terminée le 2025-03-12, avec un taux de victoire moyen de 36,64%
⚖️ Le nombre de jours où le taux de victoire était supérieur à la moyenne est de 312. Le nombre de jours où le taux de victoire était égal ou inférieur à la moyenne est de 363
📈 Le nombre de jours où le taux de victoire était supérieur à 50% est de 186. Le nombre de jours où le taux de victoire était entre 40% et 50% est de 376. Le nombre de jours où le taux de victoire était inférieur à 40% est de 113
#TradingPerformance $BTC $TON
Mis à jour le 2026-05-08, données de trading au niveau communautaire :
📊 Le taux de victoire moyen est de 46,70%
🏆 Le jour avec le meilleur taux de victoire était le 2026-04-01 avec un taux de 78,08%. Le jour avec le pire taux de victoire était le 2026-01-25 avec un taux de 15,69%
📅 Le jour de la semaine avec le meilleur taux de victoire moyen est le mercredi avec un taux de 47,01%. Le jour de la semaine avec le pire taux de victoire moyen est le jeudi avec un taux de 45,85%
⏱️ La période de 7 jours la plus forte s'est terminée le 2026-04-05, avec un taux de victoire moyen de 63,27%. La période de 7 jours la plus faible s'est terminée le 2025-03-12, avec un taux de victoire moyen de 36,64%
⚖️ Le nombre de jours où le taux de victoire était supérieur à la moyenne est de 312. Le nombre de jours où le taux de victoire était égal ou inférieur à la moyenne est de 363
📈 Le nombre de jours où le taux de victoire était supérieur à 50% est de 186. Le nombre de jours où le taux de victoire était entre 40% et 50% est de 376. Le nombre de jours où le taux de victoire était inférieur à 40% est de 113
#TradingPerformance $BTC $TON
📊 Le taux de victoire moyen est de 46,70%
🏆 Le jour avec le meilleur taux de victoire était le 2026-04-01 avec un taux de 78,08%. Le jour avec le pire taux de victoire était le 2026-01-25 avec un taux de 15,69%
📅 Le jour de la semaine avec le meilleur taux de victoire moyen est le mercredi avec un taux de 47,01%. Le jour de la semaine avec le pire taux de victoire moyen est le jeudi avec un taux de 45,85%
⏱️ La période de 7 jours la plus forte s'est terminée le 2026-04-05, avec un taux de victoire moyen de 63,27%. La période de 7 jours la plus faible s'est terminée le 2025-03-12, avec un taux de victoire moyen de 36,64%
⚖️ Le nombre de jours où le taux de victoire était supérieur à la moyenne est de 312. Le nombre de jours où le taux de victoire était égal ou inférieur à la moyenne est de 363
📈 Le nombre de jours où le taux de victoire était supérieur à 50% est de 186. Le nombre de jours où le taux de victoire était entre 40% et 50% est de 376. Le nombre de jours où le taux de victoire était inférieur à 40% est de 113
#TradingPerformance $BTC $TON
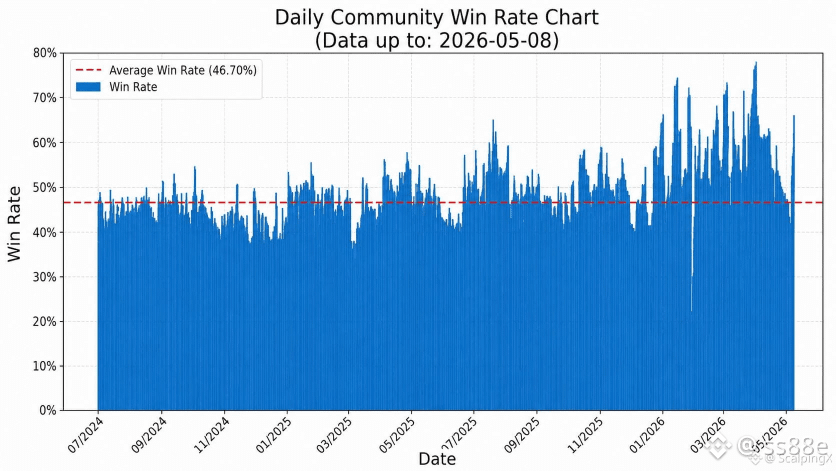
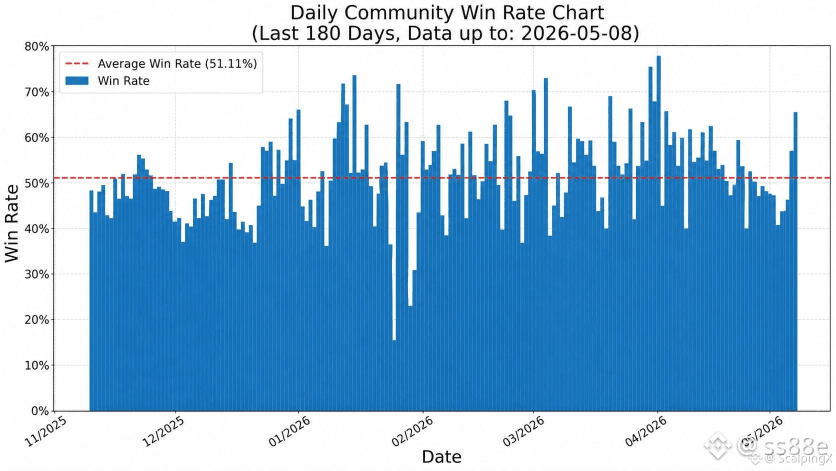
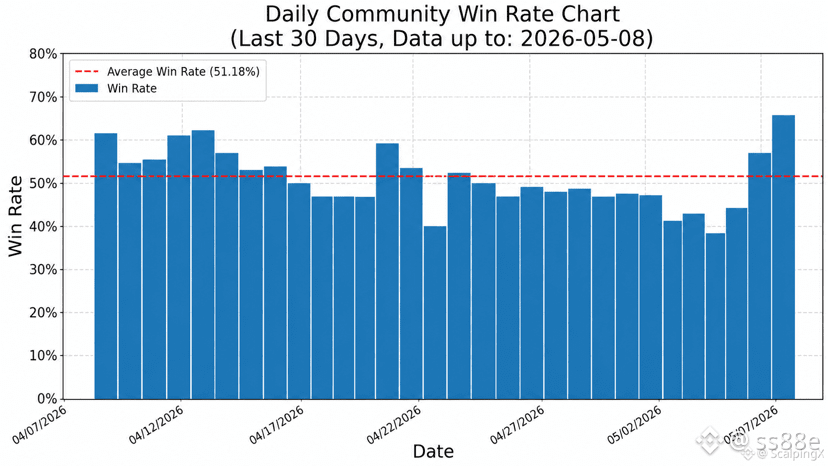
3
144
Connectez-vous pour découvrir plus de contenu
Rejoignez la communauté mondiale des adeptes de cryptomonnaies sur Binance Square
⚡️ Suviez les dernières informations importantes sur les cryptomonnaies.
💬 Jugé digne de confiance par la plus grande plateforme d’échange de cryptomonnaies au monde.
👍 Découvrez les connaissances que partagent les créateurs vérifiés.
Adresse e-mail/Nº de téléphone
Sujets d’actualité
1
#SECReceivesGrayscaleLitecoinTrustETFFiling
57,720 vues
1,132 mentions
2
#ClarityActFacesProceduralVoteSept15
179,026 vues
2,031 mentions
3
#US10YearTreasuryYieldNears5%
60,953 vues
1,113 mentions
4
#CryptoLiquidations$674MIn24H
12,896 vues
174 mentions
5
#TokenizedStockHoldersUp619.1%
57,981 vues
938 mentions
6
#RevolutConfirmsFakeGovEmailDataBreach
90,615 vues
1,228 mentions
7
#CanadaOSFISaysTokenizedDepositsEqualTraditionalDeposits
5,247 vues
101 mentions
8
#USBankCompletesCrossBorderPaymentPilotOnStellar
75,105 vues
1,176 mentions
9
#NvidiaInTalksToInvestUpTo$10BInAnthropicIPO
5,149 vues
89 mentions
10
#EtherRalliesAsBearishBetsLiquidate
119,007 vues
1,494 mentions