
#cryptotradingpro
cryptotradingpro
1.8M vues
3,301 mentions
Populaire
Récents

Voir la traduction
#cryptotradingpro #BTC
📊 $BTC /USDT: Compression Analysis and Liquidity Hunt
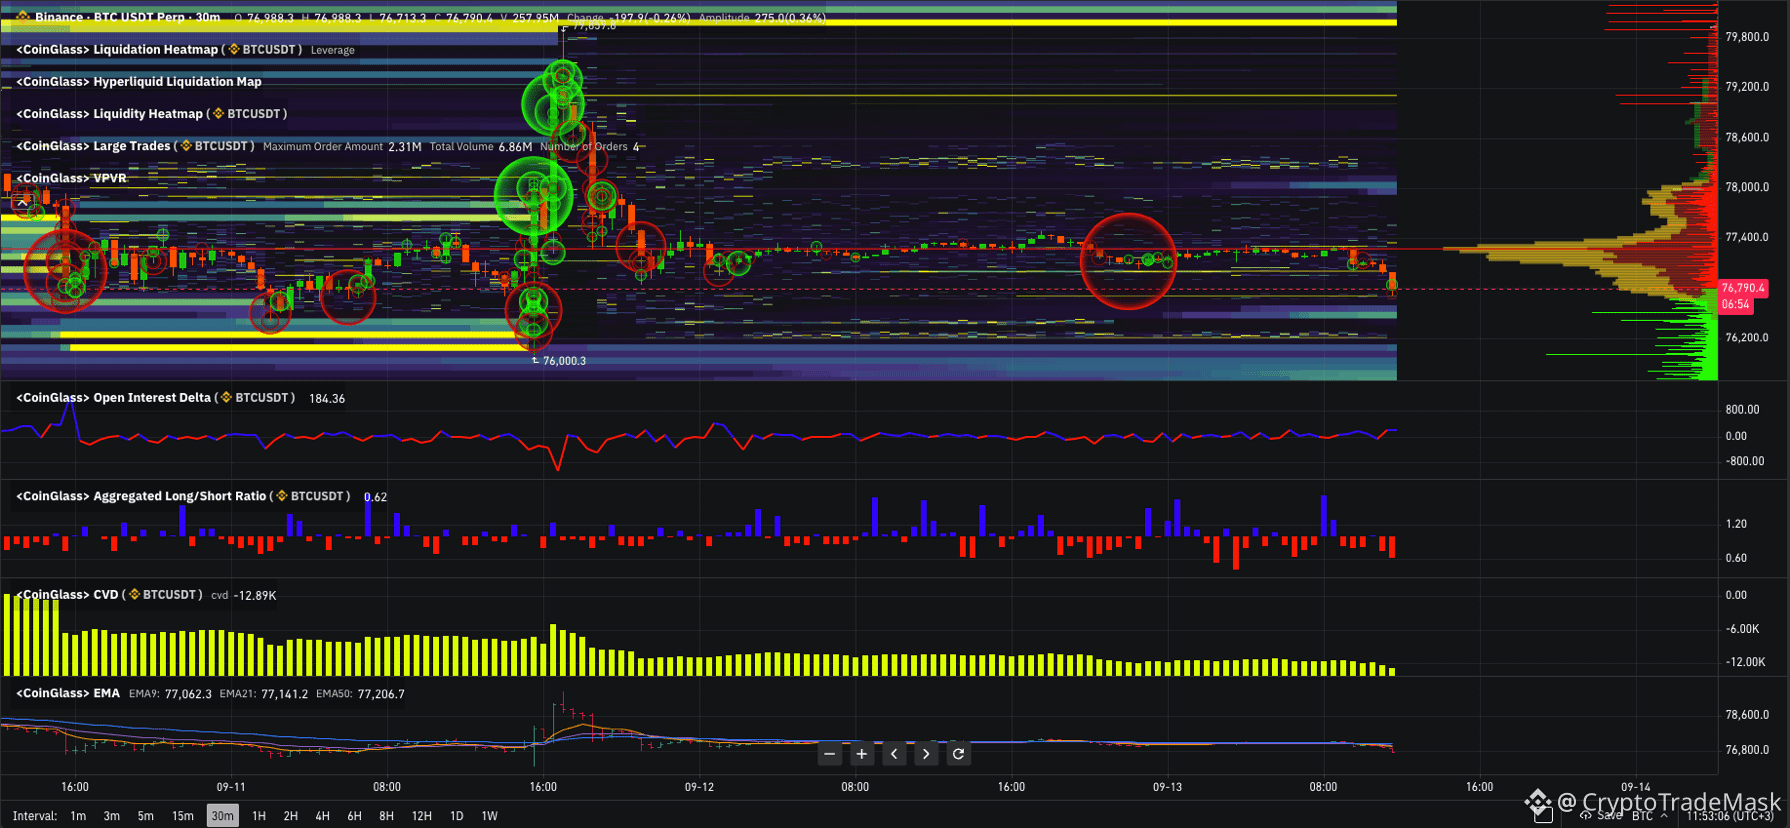
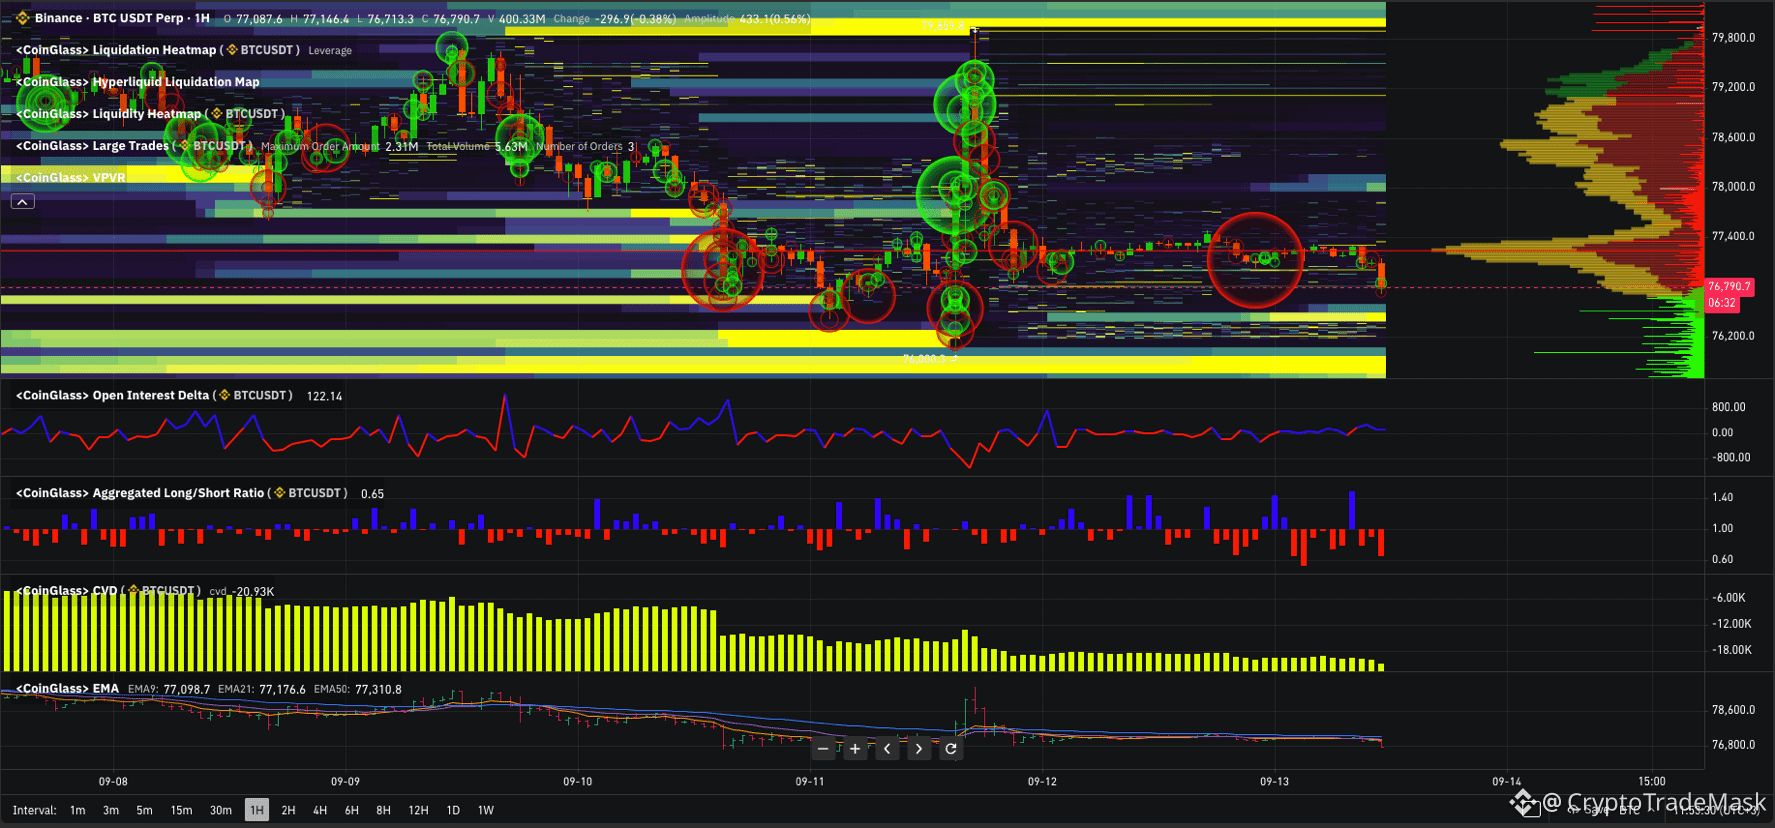
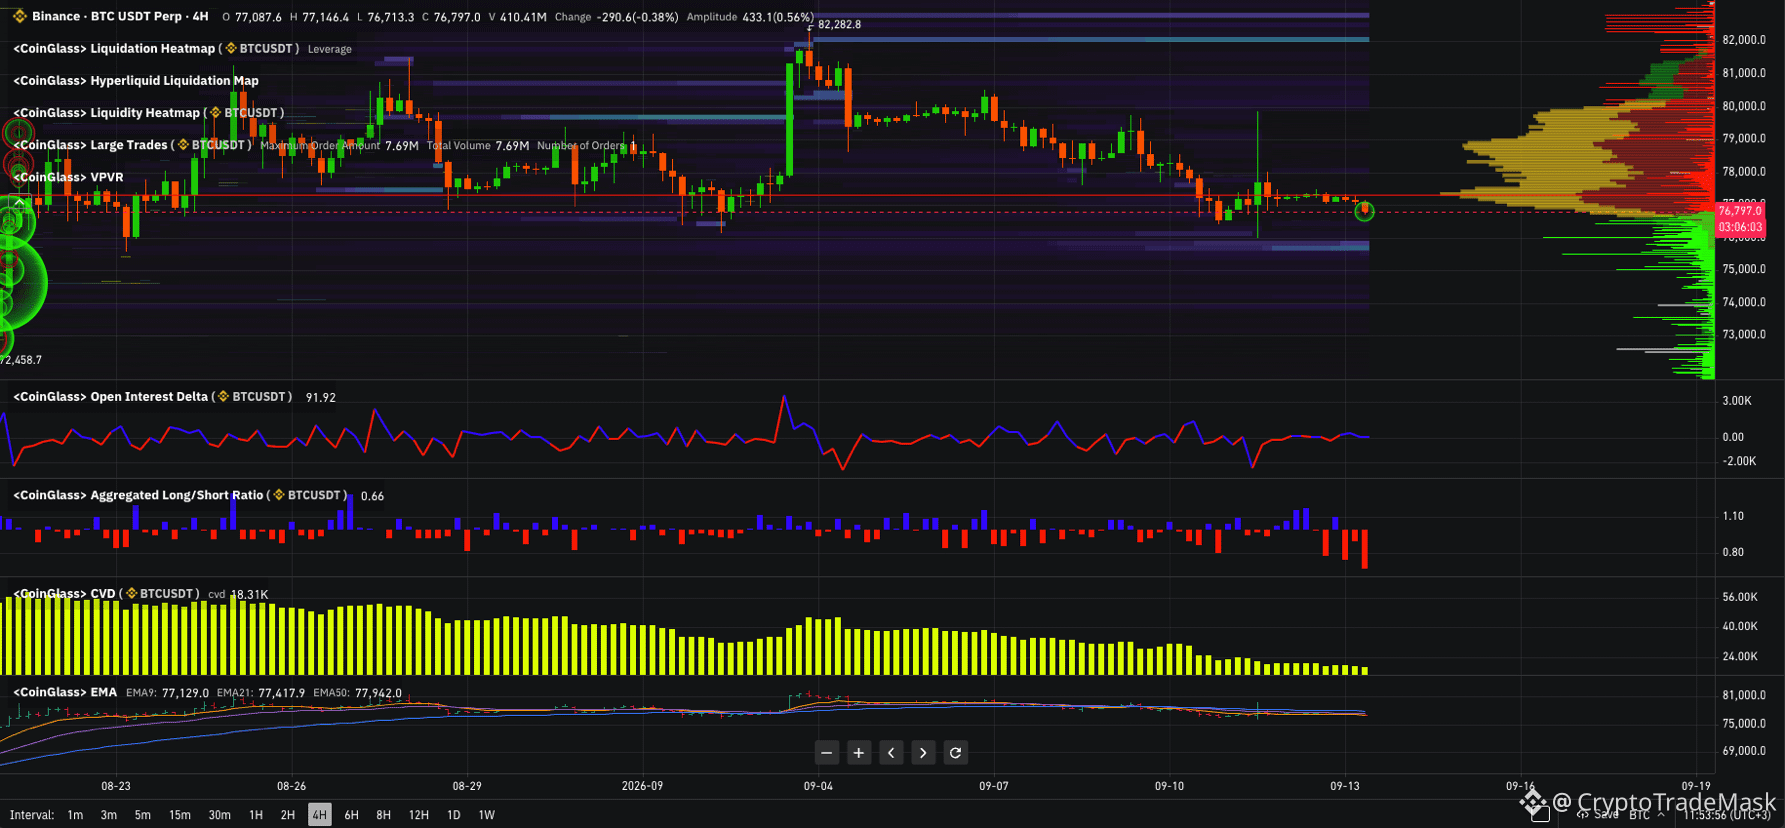
Bitcoin continues to trade within a narrow range following a corrective move from the local high of $82,282. On lower timeframes (1H / 30m), distinct consolidation and volatility compression are visible right above a strong support block.
🔑 Key Levels and Liquidity Map
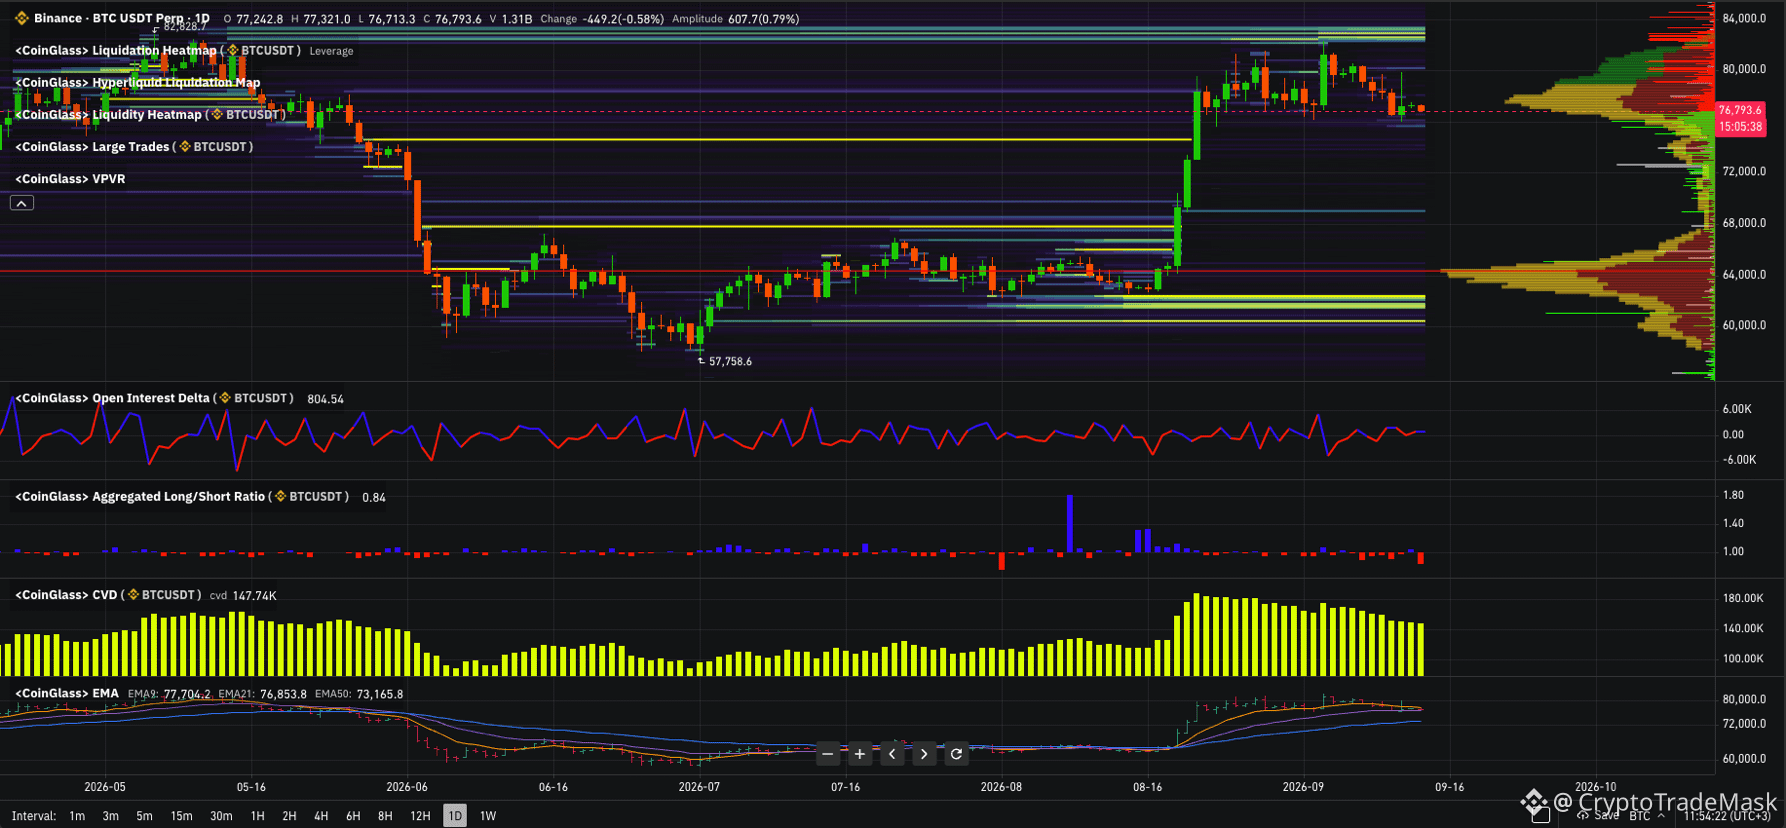
Support Zone ($75,800 – $76,000): The heatmap clearly shows a massive pool of limit buyers (bright yellow bands). The daily EMA21 ($76,800) also runs through this area, acting as dynamic support for the bullish structure.
Resistance Zone ($78,000 – $78,500): The nearest block for short position liquidations and high volume (VPVR).
Primary Upper Target ($80,000 – $82,000): The main cluster of short-seller stop orders.
📈 Derivatives and On-Chain Metrics
Long/Short Ratio: The ratio stands at 0.62 – 0.84, indicating a significant prevalence of short positions among retail and mid-sized traders. This creates ideal conditions to fuel a short squeeze.
CVD (Cumulative Volume Delta): Market order delta is declining (market selling dominates), yet the price is holding steady in the $76,500 – $77,300 range. This is a classic sign of passive absorption of sell orders by a large limit buyer.
Volumes (Large Trades): Aggressive volume spikes (green/red clusters) are observed on 1H/30m charts as the price approaches the range boundaries—indicating an active battle for control.
🎯 Price Action Scenarios
📈 Primary Scenario (Short Squeeze):
Holding support at $75,800–$76,000 and an impulsive breakout above $77,300 will trigger a cascade of short liquidations. First target: $78,500; subsequent target: $80,000+.
📉 Alternative Scenario (Deeper Correction):
A 4H candle close below $75,800 would open the way for a liquidity sweep around $73,150 (1D EMA50) or $72,000.
⚠️ Conclusion: Current conditions favor looking for long positions from the lower boundary of $76,000 with a tight stop, or upon a retest following a breakout above $77,300.
{future}(BTCUSDT)
#cryptotradingpro #BTC
📊 $BTC /USDT: Compression Analysis and Liquidity Hunt
Bitcoin continues to trade within a narrow range following a corrective move from the local high of $82,282. On lower timeframes (1H / 30m), distinct consolidation and volatility compression are visible right above a strong support block.
🔑 Key Levels and Liquidity Map
Support Zone ($75,800 – $76,000): The heatmap clearly shows a massive pool of limit buyers (bright yellow bands). The daily EMA21 ($76,800) also runs through this area, acting as dynamic support for the bullish structure.
Resistance Zone ($78,000 – $78,500): The nearest block for short position liquidations and high volume (VPVR).
Primary Upper Target ($80,000 – $82,000): The main cluster of short-seller stop orders.
📈 Derivatives and On-Chain Metrics
Long/Short Ratio: The ratio stands at 0.62 – 0.84, indicating a significant prevalence of short positions among retail and mid-sized traders. This creates ideal conditions to fuel a short squeeze.
CVD (Cumulative Volume Delta): Market order delta is declining (market selling dominates), yet the price is holding steady in the $76,500 – $77,300 range. This is a classic sign of passive absorption of sell orders by a large limit buyer.
Volumes (Large Trades): Aggressive volume spikes (green/red clusters) are observed on 1H/30m charts as the price approaches the range boundaries—indicating an active battle for control.
🎯 Price Action Scenarios
📈 Primary Scenario (Short Squeeze):
Holding support at $75,800–$76,000 and an impulsive breakout above $77,300 will trigger a cascade of short liquidations. First target: $78,500; subsequent target: $80,000+.
📉 Alternative Scenario (Deeper Correction):
A 4H candle close below $75,800 would open the way for a liquidity sweep around $73,150 (1D EMA50) or $72,000.
⚠️ Conclusion: Current conditions favor looking for long positions from the lower boundary of $76,000 with a tight stop, or upon a retest following a breakout above $77,300.
📊 $BTC /USDT: Compression Analysis and Liquidity Hunt
Bitcoin continues to trade within a narrow range following a corrective move from the local high of $82,282. On lower timeframes (1H / 30m), distinct consolidation and volatility compression are visible right above a strong support block.
🔑 Key Levels and Liquidity Map
Support Zone ($75,800 – $76,000): The heatmap clearly shows a massive pool of limit buyers (bright yellow bands). The daily EMA21 ($76,800) also runs through this area, acting as dynamic support for the bullish structure.
Resistance Zone ($78,000 – $78,500): The nearest block for short position liquidations and high volume (VPVR).
Primary Upper Target ($80,000 – $82,000): The main cluster of short-seller stop orders.
📈 Derivatives and On-Chain Metrics
Long/Short Ratio: The ratio stands at 0.62 – 0.84, indicating a significant prevalence of short positions among retail and mid-sized traders. This creates ideal conditions to fuel a short squeeze.
CVD (Cumulative Volume Delta): Market order delta is declining (market selling dominates), yet the price is holding steady in the $76,500 – $77,300 range. This is a classic sign of passive absorption of sell orders by a large limit buyer.
Volumes (Large Trades): Aggressive volume spikes (green/red clusters) are observed on 1H/30m charts as the price approaches the range boundaries—indicating an active battle for control.
🎯 Price Action Scenarios
📈 Primary Scenario (Short Squeeze):
Holding support at $75,800–$76,000 and an impulsive breakout above $77,300 will trigger a cascade of short liquidations. First target: $78,500; subsequent target: $80,000+.
📉 Alternative Scenario (Deeper Correction):
A 4H candle close below $75,800 would open the way for a liquidity sweep around $73,150 (1D EMA50) or $72,000.
⚠️ Conclusion: Current conditions favor looking for long positions from the lower boundary of $76,000 with a tight stop, or upon a retest following a breakout above $77,300.
23

·
--
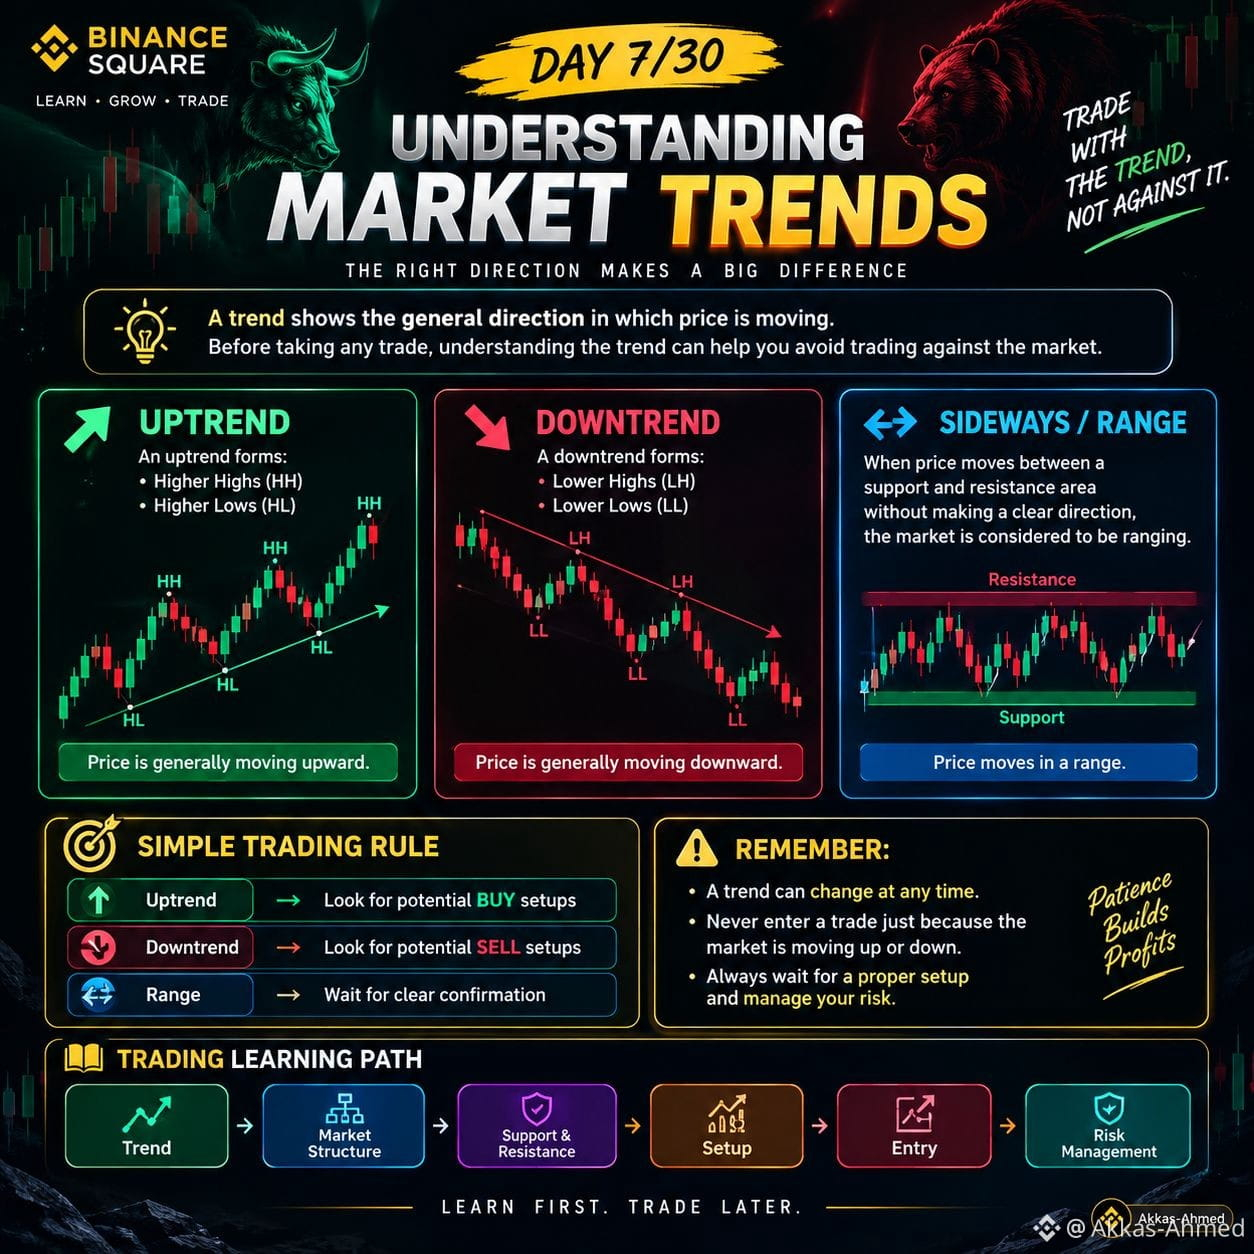
📅 JOUR 7/30 — Comprendre les tendances du marché 📊 $BTC
Avant de prendre une quelconque transaction, l’une des premières choses à comprendre est la tendance du marché.
Une tendance montre la direction générale dans laquelle le prix évolue.
📈 HAUSSE (UPTREND) Une tendance haussière se forme : • Sommets (Highs) plus élevés (HH) • Creux (Lows) plus élevés (HL)
➡️ Le prix évolue généralement à la hausse.
📉 BAISSE (DOWNTREND) Une tendance baissière se forme : • Sommets plus bas (LH) • Creux plus bas (LL)
➡️ Le prix évolue généralement à la baisse.
↔️ LATÉRAL / FOURCHETTE Quand le prix évolue entre une zone de support et une zone de résistance sans prendre une direction claire, le marché est considéré comme étant en range.
🧠 Règle simple
📈 Hausse → Cherchez des configurations d’ACHAT potentielles
📉 Baisse → Cherchez des configurations de VENTE potentielles
↔️ Range → Attendez une confirmation claire
⚠️ Rappelez-vous :
Une tendance peut changer à tout moment. N’entrez jamais dans une transaction simplement parce que le marché monte ou baisse. Attendez toujours une configuration appropriée et gérez votre risque.
📚 Parcours d’apprentissage du trading :
Tendance → Structure de marché → Support & Résistance → Configuration → Entrée → Gestion du risque
Apprenez d’abord. Tradez ensuite. 🚀
#cryptotradingpro #BinanceSquare #priceaction #Marketstructure @BTC- @Ethereum_official
📅 JOUR 7/30 — Comprendre les tendances du marché 📊 $BTC
Avant de prendre une quelconque transaction, l’une des premières choses à comprendre est la tendance du marché.
Une tendance montre la direction générale dans laquelle le prix évolue.
📈 HAUSSE (UPTREND) Une tendance haussière se forme : • Sommets (Highs) plus élevés (HH) • Creux (Lows) plus élevés (HL)
➡️ Le prix évolue généralement à la hausse.
📉 BAISSE (DOWNTREND) Une tendance baissière se forme : • Sommets plus bas (LH) • Creux plus bas (LL)
➡️ Le prix évolue généralement à la baisse.
↔️ LATÉRAL / FOURCHETTE Quand le prix évolue entre une zone de support et une zone de résistance sans prendre une direction claire, le marché est considéré comme étant en range.
🧠 Règle simple
📈 Hausse → Cherchez des configurations d’ACHAT potentielles
📉 Baisse → Cherchez des configurations de VENTE potentielles
↔️ Range → Attendez une confirmation claire
⚠️ Rappelez-vous :
Une tendance peut changer à tout moment. N’entrez jamais dans une transaction simplement parce que le marché monte ou baisse. Attendez toujours une configuration appropriée et gérez votre risque.
📚 Parcours d’apprentissage du trading :
Tendance → Structure de marché → Support & Résistance → Configuration → Entrée → Gestion du risque
Apprenez d’abord. Tradez ensuite. 🚀
#cryptotradingpro #BinanceSquare #priceaction #Marketstructure @BTC - @Ethereum
Avant de prendre une quelconque transaction, l’une des premières choses à comprendre est la tendance du marché.
Une tendance montre la direction générale dans laquelle le prix évolue.
📈 HAUSSE (UPTREND) Une tendance haussière se forme : • Sommets (Highs) plus élevés (HH) • Creux (Lows) plus élevés (HL)
➡️ Le prix évolue généralement à la hausse.
📉 BAISSE (DOWNTREND) Une tendance baissière se forme : • Sommets plus bas (LH) • Creux plus bas (LL)
➡️ Le prix évolue généralement à la baisse.
↔️ LATÉRAL / FOURCHETTE Quand le prix évolue entre une zone de support et une zone de résistance sans prendre une direction claire, le marché est considéré comme étant en range.
🧠 Règle simple
📈 Hausse → Cherchez des configurations d’ACHAT potentielles
📉 Baisse → Cherchez des configurations de VENTE potentielles
↔️ Range → Attendez une confirmation claire
⚠️ Rappelez-vous :
Une tendance peut changer à tout moment. N’entrez jamais dans une transaction simplement parce que le marché monte ou baisse. Attendez toujours une configuration appropriée et gérez votre risque.
📚 Parcours d’apprentissage du trading :
Tendance → Structure de marché → Support & Résistance → Configuration → Entrée → Gestion du risque
Apprenez d’abord. Tradez ensuite. 🚀
#cryptotradingpro #BinanceSquare #priceaction #Marketstructure @BTC - @Ethereum
70
#cryptotradingpro #BTC
🔥 $BTC /USDT : Analyse de liquidité et perspectives locales
Bitcoin a réalisé un mouvement d’impulsion solide depuis les plus bas de 50 000–55 000 $, atteignant un sommet local à 82 500 $. Nous observons désormais une consolidation naturelle et un relâchement de la tension du marché.
📊 Enseignements du heatmap des ordres :
Support (acheteurs) : Les blocs les plus denses d’ordres limités sont concentrés dans la zone 75 200–75 600 $, avec un soutien supplémentaire plus bas à 74 000–74 800. Il s’agit de la ligne de défense principale des haussiers.
Résistance (vendeurs) : La liquidité vendeuse majeure s’est accumulée à 78 400, 79 600, et autour du niveau clé des 80 000.
Situation actuelle : Le prix évolue de manière latérale près de 77 200 $ après un achat agressif de la liquidité des mèches inférieures.
🚦 Scénarios de mouvement :
🟢 Principal (haussier) : Maintenir la zone de support 75 200–76 000 $ — accumulation — re-test de 80 000 $ avec pour objectif de casser 82 500 $.
🔴 Alternative (baissier) : Une cassure confirmée sous 74 000 $ ouvrirait la voie à une correction plus profonde vers la zone 68 000–70 000 $.
⚠️ Conclusion : La tendance globale reste positive. Le mouvement latéral actuel correspond à un regroupement des forces avant le prochain mouvement.
{future}(BTCUSDT)
#cryptotradingpro #BTC
🔥 $BTC /USDT : Analyse de liquidité et perspectives locales
Bitcoin a réalisé un mouvement d’impulsion solide depuis les plus bas de 50 000–55 000 $, atteignant un sommet local à 82 500 $. Nous observons désormais une consolidation naturelle et un relâchement de la tension du marché.
📊 Enseignements du heatmap des ordres :
Support (acheteurs) : Les blocs les plus denses d’ordres limités sont concentrés dans la zone 75 200–75 600 $, avec un soutien supplémentaire plus bas à 74 000–74 800. Il s’agit de la ligne de défense principale des haussiers.
Résistance (vendeurs) : La liquidité vendeuse majeure s’est accumulée à 78 400, 79 600, et autour du niveau clé des 80 000.
Situation actuelle : Le prix évolue de manière latérale près de 77 200 $ après un achat agressif de la liquidité des mèches inférieures.
🚦 Scénarios de mouvement :
🟢 Principal (haussier) : Maintenir la zone de support 75 200–76 000 $ — accumulation — re-test de 80 000 $ avec pour objectif de casser 82 500 $.
🔴 Alternative (baissier) : Une cassure confirmée sous 74 000 $ ouvrirait la voie à une correction plus profonde vers la zone 68 000–70 000 $.
⚠️ Conclusion : La tendance globale reste positive. Le mouvement latéral actuel correspond à un regroupement des forces avant le prochain mouvement.
🔥 $BTC /USDT : Analyse de liquidité et perspectives locales
Bitcoin a réalisé un mouvement d’impulsion solide depuis les plus bas de 50 000–55 000 $, atteignant un sommet local à 82 500 $. Nous observons désormais une consolidation naturelle et un relâchement de la tension du marché.
📊 Enseignements du heatmap des ordres :
Support (acheteurs) : Les blocs les plus denses d’ordres limités sont concentrés dans la zone 75 200–75 600 $, avec un soutien supplémentaire plus bas à 74 000–74 800. Il s’agit de la ligne de défense principale des haussiers.
Résistance (vendeurs) : La liquidité vendeuse majeure s’est accumulée à 78 400, 79 600, et autour du niveau clé des 80 000.
Situation actuelle : Le prix évolue de manière latérale près de 77 200 $ après un achat agressif de la liquidité des mèches inférieures.
🚦 Scénarios de mouvement :
🟢 Principal (haussier) : Maintenir la zone de support 75 200–76 000 $ — accumulation — re-test de 80 000 $ avec pour objectif de casser 82 500 $.
🔴 Alternative (baissier) : Une cassure confirmée sous 74 000 $ ouvrirait la voie à une correction plus profonde vers la zone 68 000–70 000 $.
⚠️ Conclusion : La tendance globale reste positive. Le mouvement latéral actuel correspond à un regroupement des forces avant le prochain mouvement.


103
#cryptotradingpro #BTC
📊 $BTC /USD: Analyse technique, carte des liquidations et niveaux d’options (4H)
Bitcoin continue d’évoluer dans une zone d’incertitude locale après une baisse impulsive depuis la fourchette de 81 500–82 000 $. Voici une analyse de la situation actuelle du marché et de la direction que le volume semble indiquer :
🔍 Indicateurs clés et facteurs :
Prix actuel : ~77 122 $
➡️ Perspective technique (4H) : la tendance reste baissière après un signal local « Vente » au sommet. Le prix est actuellement comprimé près du niveau de support immédiat à 76 800–77 000 $. Une étagère de volume dense (VPVR) s’est formée au-dessus de ce niveau (78 450+), jouant le rôle de zone de résistance.
➡️ Carte des liquidations (KF - 24h) : un important groupe de stops pour vendeurs à découvert et de liquidations se situe au-dessus du prix actuel—précisément dans la zone 78 000–80 500 $. Pour l’instant, il y a moins de volume de liquidations critique en dessous de 76 000 $, ce qui crée une incitation pour les teneurs de marché à pousser le prix à la hausse afin de balayer cette liquidité.
➡️ GEX+ & carnet d’ordres (Options) : le niveau de parité (PAR) et la zone d’attraction basée sur l’exposition au gamma des options se situent autour de 78 400–80 000 $, avec une volatilité implicite (IV) d’environ 39,3 %.
🚦 Scénarios d’évolution des prix :
🟢 Principal (balayage de liquidité) :
Le maintien de la zone 76 800–77 000 $ crée une forte probabilité d’un rebond technique vers 78 500–79 500 $. L’objectif est de purger un groupe de liquidations courtes et de tester le niveau de résistance désormais retourné.
🔴 Baissier (rupture du support) :
La clôture sur une bougie de 4 heures sous 76 800 $ invalide le scénario haussier. Dans ce cas, le prix se dirigera vers le fort bloc de support à 74 500–75 000 $ à la recherche d’acheteurs.
{future}(BTCUSDT)
#cryptotradingpro #BTC
📊 $BTC /USD: Analyse technique, carte des liquidations et niveaux d’options (4H)
Bitcoin continue d’évoluer dans une zone d’incertitude locale après une baisse impulsive depuis la fourchette de 81 500–82 000 $. Voici une analyse de la situation actuelle du marché et de la direction que le volume semble indiquer :
🔍 Indicateurs clés et facteurs :
Prix actuel : ~77 122 $
➡️ Perspective technique (4H) : la tendance reste baissière après un signal local « Vente » au sommet. Le prix est actuellement comprimé près du niveau de support immédiat à 76 800–77 000 $. Une étagère de volume dense (VPVR) s’est formée au-dessus de ce niveau (78 450+), jouant le rôle de zone de résistance.
➡️ Carte des liquidations (KF - 24h) : un important groupe de stops pour vendeurs à découvert et de liquidations se situe au-dessus du prix actuel—précisément dans la zone 78 000–80 500 $. Pour l’instant, il y a moins de volume de liquidations critique en dessous de 76 000 $, ce qui crée une incitation pour les teneurs de marché à pousser le prix à la hausse afin de balayer cette liquidité.
➡️ GEX+ & carnet d’ordres (Options) : le niveau de parité (PAR) et la zone d’attraction basée sur l’exposition au gamma des options se situent autour de 78 400–80 000 $, avec une volatilité implicite (IV) d’environ 39,3 %.
🚦 Scénarios d’évolution des prix :
🟢 Principal (balayage de liquidité) :
Le maintien de la zone 76 800–77 000 $ crée une forte probabilité d’un rebond technique vers 78 500–79 500 $. L’objectif est de purger un groupe de liquidations courtes et de tester le niveau de résistance désormais retourné.
🔴 Baissier (rupture du support) :
La clôture sur une bougie de 4 heures sous 76 800 $ invalide le scénario haussier. Dans ce cas, le prix se dirigera vers le fort bloc de support à 74 500–75 000 $ à la recherche d’acheteurs.
📊 $BTC /USD: Analyse technique, carte des liquidations et niveaux d’options (4H)
Bitcoin continue d’évoluer dans une zone d’incertitude locale après une baisse impulsive depuis la fourchette de 81 500–82 000 $. Voici une analyse de la situation actuelle du marché et de la direction que le volume semble indiquer :
🔍 Indicateurs clés et facteurs :
Prix actuel : ~77 122 $
➡️ Perspective technique (4H) : la tendance reste baissière après un signal local « Vente » au sommet. Le prix est actuellement comprimé près du niveau de support immédiat à 76 800–77 000 $. Une étagère de volume dense (VPVR) s’est formée au-dessus de ce niveau (78 450+), jouant le rôle de zone de résistance.
➡️ Carte des liquidations (KF - 24h) : un important groupe de stops pour vendeurs à découvert et de liquidations se situe au-dessus du prix actuel—précisément dans la zone 78 000–80 500 $. Pour l’instant, il y a moins de volume de liquidations critique en dessous de 76 000 $, ce qui crée une incitation pour les teneurs de marché à pousser le prix à la hausse afin de balayer cette liquidité.
➡️ GEX+ & carnet d’ordres (Options) : le niveau de parité (PAR) et la zone d’attraction basée sur l’exposition au gamma des options se situent autour de 78 400–80 000 $, avec une volatilité implicite (IV) d’environ 39,3 %.
🚦 Scénarios d’évolution des prix :
🟢 Principal (balayage de liquidité) :
Le maintien de la zone 76 800–77 000 $ crée une forte probabilité d’un rebond technique vers 78 500–79 500 $. L’objectif est de purger un groupe de liquidations courtes et de tester le niveau de résistance désormais retourné.
🔴 Baissier (rupture du support) :
La clôture sur une bougie de 4 heures sous 76 800 $ invalide le scénario haussier. Dans ce cas, le prix se dirigera vers le fort bloc de support à 74 500–75 000 $ à la recherche d’acheteurs.

104
#cryptotradingpro #BTC
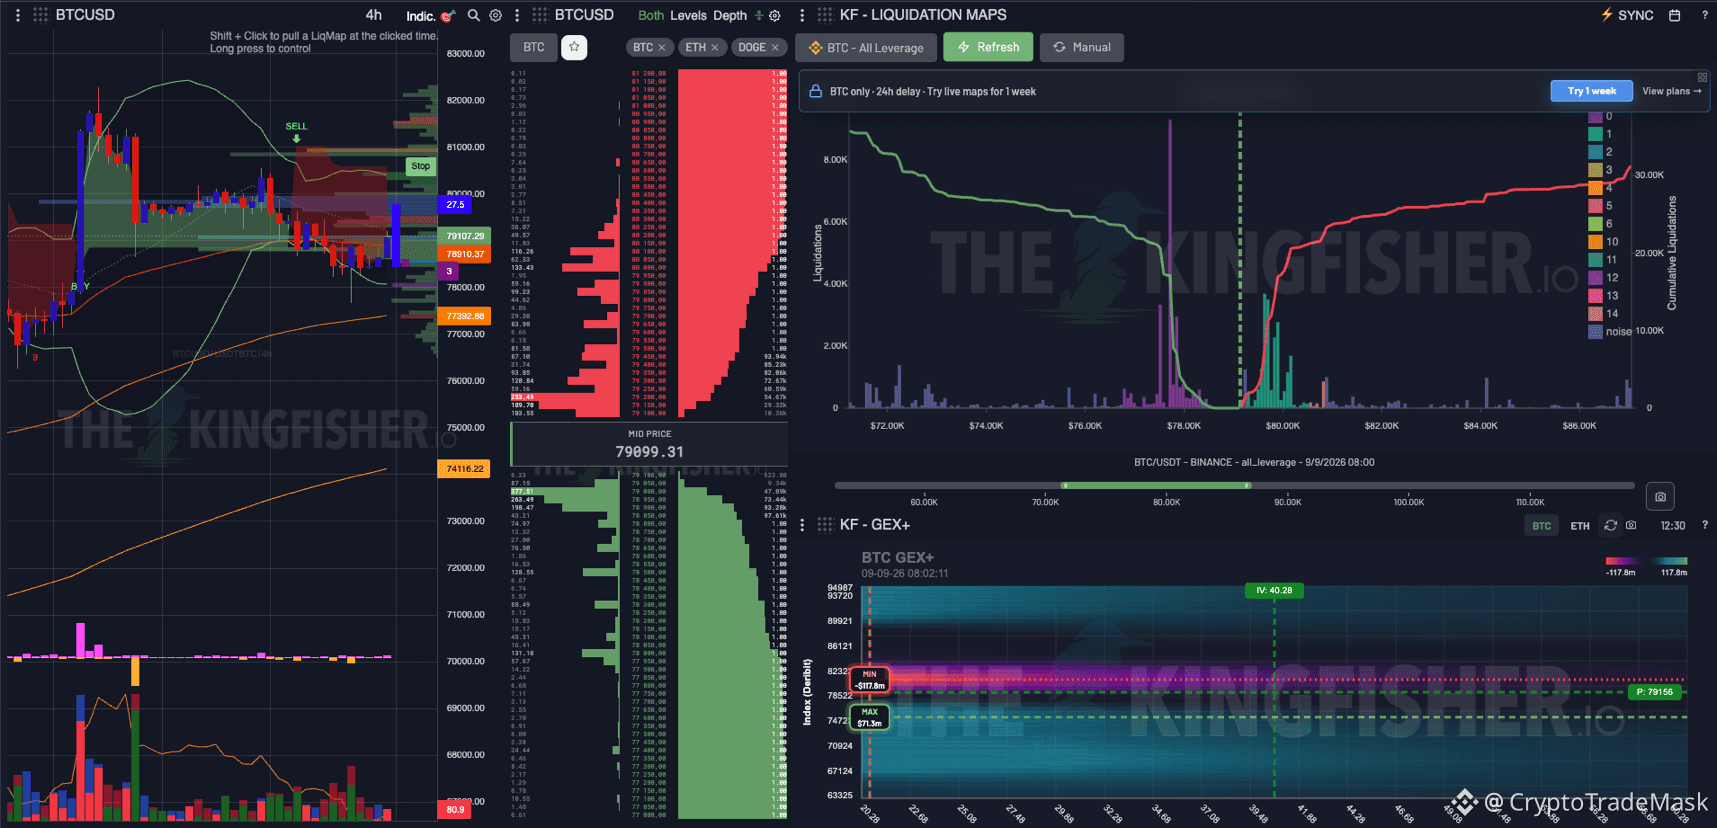
🔥 $BTC /USD: Accumulation avant l’explosion ou la suppression des stops ?
Le Bitcoin se négocie actuellement autour de 79 100 $, dans une phase de consolidation après le repli depuis les sommets. Une zone claire d’incertitude est apparue sur le graphique, mais la carte des liquidations suggère où le prix ira ensuite.
📊 Niveaux clés et analyse de la liquidité
Support (77 500 - 78 000 $) : Zone de liquidations longues locales. Tenir ce bloc est essentiel pour maintenir la structure haussière.
Résistance (81 000 - 83 000 $) : Le premier obstacle sérieux sur le chemin à la hausse, où se concentre l’essentiel du volume des shorts.
Le principal « aimant » (84 000 - 86 000 $) : Un énorme pool de liquidations courtes cumulées. Le market maker voit clairement ces niveaux.
🚦 Scénarios de trading
🟢 Priorité (Expansion haussière) :
Tenir 78 000 $ ➡️ Rupture impulsive à la hausse avec une cassure de 81 000 $ ➡️ Cascade de liquidations des shorts jusqu’à 85 000+.
🔴 Alternative (Sweep de liquidité) :
Squeeze rapide vers le bas jusqu’à la zone 77 000 - 77 500 $ (suppression des stops longs) ➡️ Rebond rapide en forme de V ➡️ Début d’un mouvement à la hausse.
⚠️ Résumé : Le marché se contracte, la tension augmente. Surveillez la réaction du prix au niveau de 78 000 $ et préparez-vous à une volatilité accrue !
{future}(BTCUSDT)
#cryptotradingpro #BTC
🔥 $BTC /USD: Accumulation avant l’explosion ou la suppression des stops ?
Le Bitcoin se négocie actuellement autour de 79 100 $, dans une phase de consolidation après le repli depuis les sommets. Une zone claire d’incertitude est apparue sur le graphique, mais la carte des liquidations suggère où le prix ira ensuite.
📊 Niveaux clés et analyse de la liquidité
Support (77 500 - 78 000 $) : Zone de liquidations longues locales. Tenir ce bloc est essentiel pour maintenir la structure haussière.
Résistance (81 000 - 83 000 $) : Le premier obstacle sérieux sur le chemin à la hausse, où se concentre l’essentiel du volume des shorts.
Le principal « aimant » (84 000 - 86 000 $) : Un énorme pool de liquidations courtes cumulées. Le market maker voit clairement ces niveaux.
🚦 Scénarios de trading
🟢 Priorité (Expansion haussière) :
Tenir 78 000 $ ➡️ Rupture impulsive à la hausse avec une cassure de 81 000 $ ➡️ Cascade de liquidations des shorts jusqu’à 85 000+.
🔴 Alternative (Sweep de liquidité) :
Squeeze rapide vers le bas jusqu’à la zone 77 000 - 77 500 $ (suppression des stops longs) ➡️ Rebond rapide en forme de V ➡️ Début d’un mouvement à la hausse.
⚠️ Résumé : Le marché se contracte, la tension augmente. Surveillez la réaction du prix au niveau de 78 000 $ et préparez-vous à une volatilité accrue !
🔥 $BTC /USD: Accumulation avant l’explosion ou la suppression des stops ?
Le Bitcoin se négocie actuellement autour de 79 100 $, dans une phase de consolidation après le repli depuis les sommets. Une zone claire d’incertitude est apparue sur le graphique, mais la carte des liquidations suggère où le prix ira ensuite.
📊 Niveaux clés et analyse de la liquidité
Support (77 500 - 78 000 $) : Zone de liquidations longues locales. Tenir ce bloc est essentiel pour maintenir la structure haussière.
Résistance (81 000 - 83 000 $) : Le premier obstacle sérieux sur le chemin à la hausse, où se concentre l’essentiel du volume des shorts.
Le principal « aimant » (84 000 - 86 000 $) : Un énorme pool de liquidations courtes cumulées. Le market maker voit clairement ces niveaux.
🚦 Scénarios de trading
🟢 Priorité (Expansion haussière) :
Tenir 78 000 $ ➡️ Rupture impulsive à la hausse avec une cassure de 81 000 $ ➡️ Cascade de liquidations des shorts jusqu’à 85 000+.
🔴 Alternative (Sweep de liquidité) :
Squeeze rapide vers le bas jusqu’à la zone 77 000 - 77 500 $ (suppression des stops longs) ➡️ Rebond rapide en forme de V ➡️ Début d’un mouvement à la hausse.
⚠️ Résumé : Le marché se contracte, la tension augmente. Surveillez la réaction du prix au niveau de 78 000 $ et préparez-vous à une volatilité accrue !
1
145

·
--
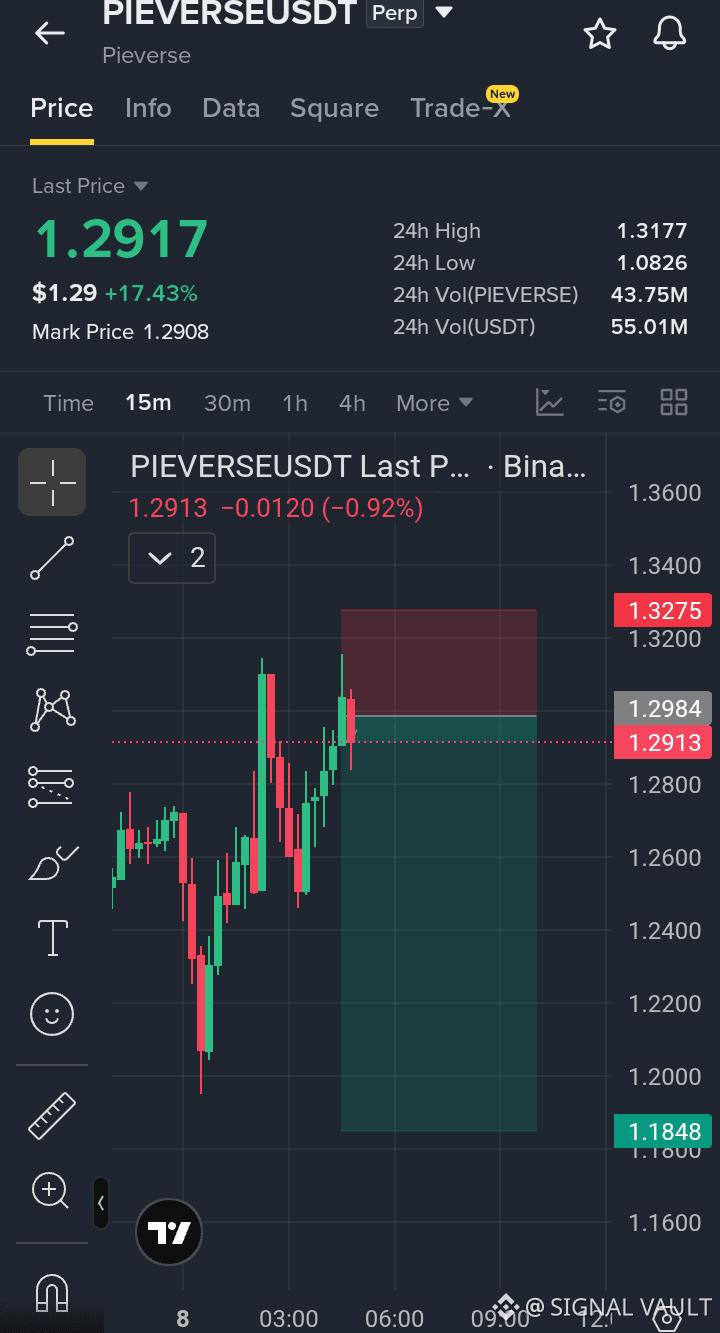
Je suis actuellement en train de surveiller un potentiel setup court autour de $PIEVERSE , vers 1,297–1,300 $. Après un fort mouvement haussier, le prix montre un rejet près de la zone des 1,30 $, ce qui suggère que l’élan à l’achat pourrait faiblir. Mon niveau d’invalidation est à 1,314 $, tandis que les objectifs à la baisse sont à 1,275, 1,250 et 1,228 $. Le niveau clé à surveiller est à 1,280 — si les vendeurs font passer le prix en dessous, l’élan baissier pourrait s’accélérer. Comme toujours, il s’agit d’une idée de transaction personnelle, alors gérez le risque et tradez de manière responsable. 📉
$IOST $SOPH
#PIEVERSE #cryptotradingpro #ShortSetup
Je suis actuellement en train de surveiller un potentiel setup court autour de $PIEVERSE , vers 1,297–1,300 $. Après un fort mouvement haussier, le prix montre un rejet près de la zone des 1,30 $, ce qui suggère que l’élan à l’achat pourrait faiblir. Mon niveau d’invalidation est à 1,314 $, tandis que les objectifs à la baisse sont à 1,275, 1,250 et 1,228 $. Le niveau clé à surveiller est à 1,280 — si les vendeurs font passer le prix en dessous, l’élan baissier pourrait s’accélérer. Comme toujours, il s’agit d’une idée de transaction personnelle, alors gérez le risque et tradez de manière responsable. 📉
$IOST $SOPH
#PIEVERSE #cryptotradingpro #ShortSetup
$IOST $SOPH
#PIEVERSE #cryptotradingpro #ShortSetup
205
#cryptotradingpro #BTC
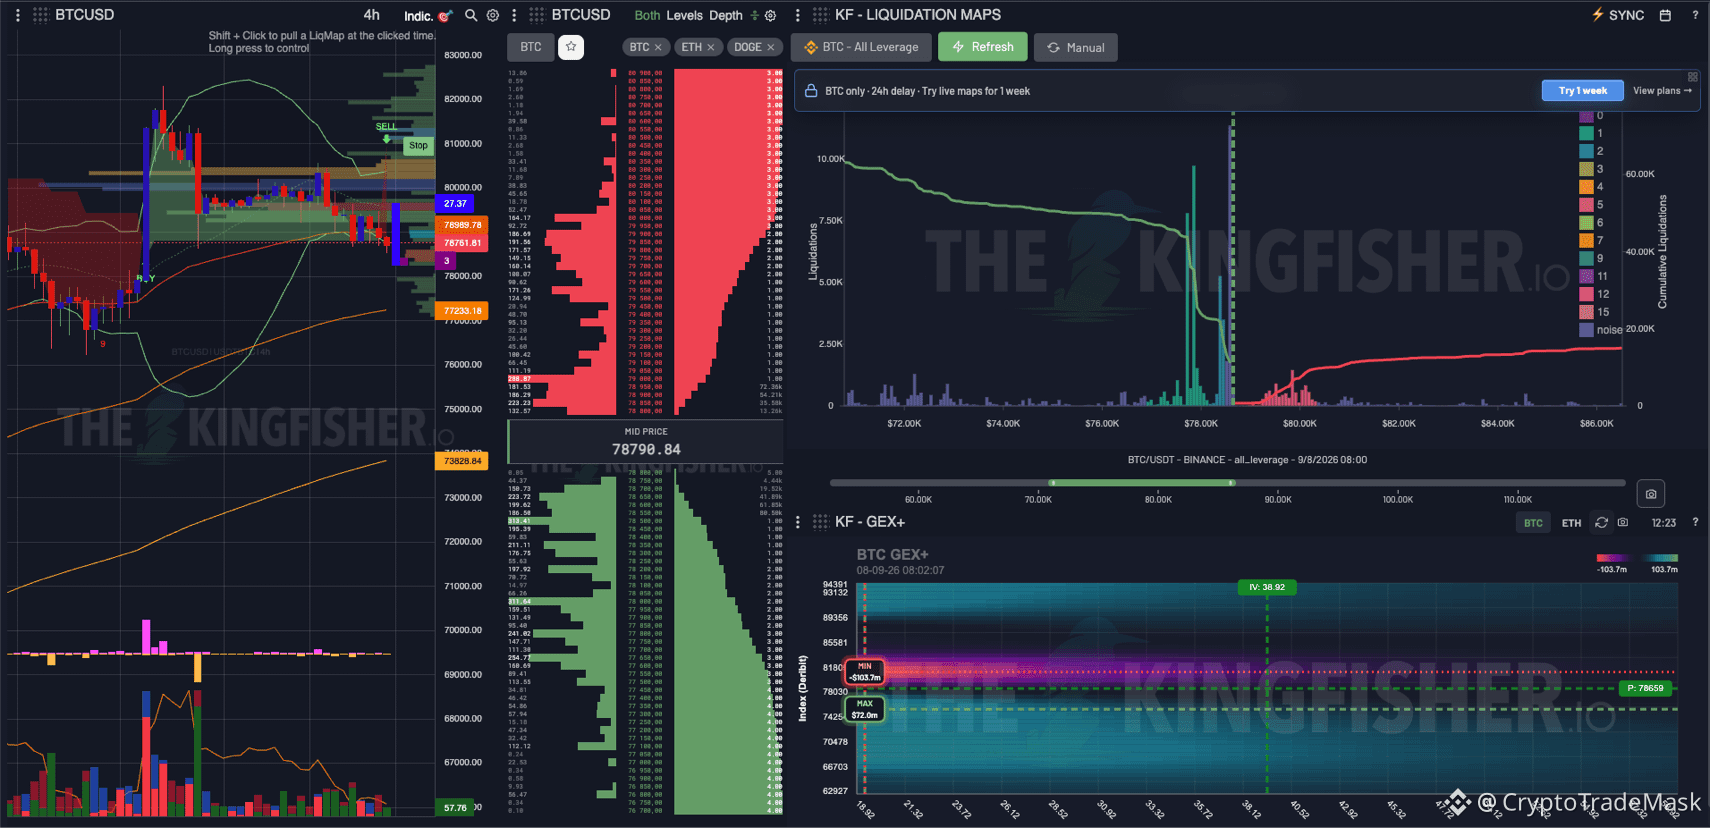
🚀 $BTC /USD : Analyse de la liquidité et préparation à une sortie en range
Bitcoin (78 798 $) continue de comprimer la volatilité dans la zone locale. Voyons ce que montrent les indicateurs (GEX, carnet d’ordres et carte des liquidations) :
📊 Ce qui se passe sur le graphique et dans le verre :
➡️ Vue technique (4 heures) : Le prix se consolide après une impulsion baissière depuis 82 500–83 000 $. Les vendeurs perdent progressivement du volume, mais un acheteur sûr pour un retournement rapide n’est pas encore visible.
➡️ Carte des liquidations (KF Liq Map) : La principale cascade de liquidité longue est concentrée dans la zone 77 000–78 500 (grand cluster vert-bleu). Le prix a déjà effectué la première rébellion dans cette zone, en rognant une partie des épaules.
➡️ Résistance : Il existe un mur dense de vendeurs à découvert dans le carnet d’ordres (Orderbook Depth) au-dessus de 79 500 $, qui répète des tentatives de croissance rapide.
➡️ Exposition gamma (GEX+) : Rester près de la zone neutre-négative (78 658 $) signale une forte probabilité d’une impulsion marquée lors de la sortie du couloir actuel.
🎯 Scénarios clés :
1️⃣ Priorité (Collecte de liquidité - Rebond) :
Acquisition manipulatrice de liquidité longue équilibrée dans la zone 77 500 - 78 000, avec rachat réactif et mouvement vers des cascades courtes dans la zone 80 500 - 81 500.
2️⃣ Alternative (Cassure baissière) :
Une consolidation sous 77 000 $ sur la bougie 4h ouvre la voie à des liquidations en cascade, avec un objectif dans la fourchette 73 800 – 74 500 $.
⚠️ En bref : Le marché se prépare à un mouvement fort. Le trade le plus logique à court terme est de rechercher des configurations de retournement après le concept de liquidité longue dans la fourchette 77,5k–78k.
{future}(BTCUSDT)
#cryptotradingpro #BTC
🚀 $BTC /USD : Analyse de la liquidité et préparation à une sortie en range
Bitcoin (78 798 $) continue de comprimer la volatilité dans la zone locale. Voyons ce que montrent les indicateurs (GEX, carnet d’ordres et carte des liquidations) :
📊 Ce qui se passe sur le graphique et dans le verre :
➡️ Vue technique (4 heures) : Le prix se consolide après une impulsion baissière depuis 82 500–83 000 $. Les vendeurs perdent progressivement du volume, mais un acheteur sûr pour un retournement rapide n’est pas encore visible.
➡️ Carte des liquidations (KF Liq Map) : La principale cascade de liquidité longue est concentrée dans la zone 77 000–78 500 (grand cluster vert-bleu). Le prix a déjà effectué la première rébellion dans cette zone, en rognant une partie des épaules.
➡️ Résistance : Il existe un mur dense de vendeurs à découvert dans le carnet d’ordres (Orderbook Depth) au-dessus de 79 500 $, qui répète des tentatives de croissance rapide.
➡️ Exposition gamma (GEX+) : Rester près de la zone neutre-négative (78 658 $) signale une forte probabilité d’une impulsion marquée lors de la sortie du couloir actuel.
🎯 Scénarios clés :
1️⃣ Priorité (Collecte de liquidité - Rebond) :
Acquisition manipulatrice de liquidité longue équilibrée dans la zone 77 500 - 78 000, avec rachat réactif et mouvement vers des cascades courtes dans la zone 80 500 - 81 500.
2️⃣ Alternative (Cassure baissière) :
Une consolidation sous 77 000 $ sur la bougie 4h ouvre la voie à des liquidations en cascade, avec un objectif dans la fourchette 73 800 – 74 500 $.
⚠️ En bref : Le marché se prépare à un mouvement fort. Le trade le plus logique à court terme est de rechercher des configurations de retournement après le concept de liquidité longue dans la fourchette 77,5k–78k.
🚀 $BTC /USD : Analyse de la liquidité et préparation à une sortie en range
Bitcoin (78 798 $) continue de comprimer la volatilité dans la zone locale. Voyons ce que montrent les indicateurs (GEX, carnet d’ordres et carte des liquidations) :
📊 Ce qui se passe sur le graphique et dans le verre :
➡️ Vue technique (4 heures) : Le prix se consolide après une impulsion baissière depuis 82 500–83 000 $. Les vendeurs perdent progressivement du volume, mais un acheteur sûr pour un retournement rapide n’est pas encore visible.
➡️ Carte des liquidations (KF Liq Map) : La principale cascade de liquidité longue est concentrée dans la zone 77 000–78 500 (grand cluster vert-bleu). Le prix a déjà effectué la première rébellion dans cette zone, en rognant une partie des épaules.
➡️ Résistance : Il existe un mur dense de vendeurs à découvert dans le carnet d’ordres (Orderbook Depth) au-dessus de 79 500 $, qui répète des tentatives de croissance rapide.
➡️ Exposition gamma (GEX+) : Rester près de la zone neutre-négative (78 658 $) signale une forte probabilité d’une impulsion marquée lors de la sortie du couloir actuel.
🎯 Scénarios clés :
1️⃣ Priorité (Collecte de liquidité - Rebond) :
Acquisition manipulatrice de liquidité longue équilibrée dans la zone 77 500 - 78 000, avec rachat réactif et mouvement vers des cascades courtes dans la zone 80 500 - 81 500.
2️⃣ Alternative (Cassure baissière) :
Une consolidation sous 77 000 $ sur la bougie 4h ouvre la voie à des liquidations en cascade, avec un objectif dans la fourchette 73 800 – 74 500 $.
⚠️ En bref : Le marché se prépare à un mouvement fort. Le trade le plus logique à court terme est de rechercher des configurations de retournement après le concept de liquidité longue dans la fourchette 77,5k–78k.
170

·
--
🚨 La plupart des traders ne perdent pas à cause d’une seule mauvaise transaction
Ils perdent parce qu’ils répètent la même erreur.
Une petite perte devient une plus grosse perte.
Une transaction de revanche en devient trois.
Une entrée manquée se transforme en FOMO.
Le véritable avantage n’est pas de prédire chaque mouvement.
C’est d’avoir un plan avant que le marché ne mette vos émotions à l’épreuve.
Connaissez votre entrée.
Connaissez votre invalidation.
Connaissez le montant que vous êtes prêt à perdre.
Quelle erreur de trading vous a appris la plus grande leçon ?
#cryptotradingpro #TradingPsychology #RiskManagementMastery
🚨 La plupart des traders ne perdent pas à cause d’une seule mauvaise transaction
Ils perdent parce qu’ils répètent la même erreur.
Une petite perte devient une plus grosse perte.
Une transaction de revanche en devient trois.
Une entrée manquée se transforme en FOMO.
Le véritable avantage n’est pas de prédire chaque mouvement.
C’est d’avoir un plan avant que le marché ne mette vos émotions à l’épreuve.
Connaissez votre entrée.
Connaissez votre invalidation.
Connaissez le montant que vous êtes prêt à perdre.
Quelle erreur de trading vous a appris la plus grande leçon ?
#cryptotradingpro #TradingPsychology #RiskManagementMastery
Ils perdent parce qu’ils répètent la même erreur.
Une petite perte devient une plus grosse perte.
Une transaction de revanche en devient trois.
Une entrée manquée se transforme en FOMO.
Le véritable avantage n’est pas de prédire chaque mouvement.
C’est d’avoir un plan avant que le marché ne mette vos émotions à l’épreuve.
Connaissez votre entrée.
Connaissez votre invalidation.
Connaissez le montant que vous êtes prêt à perdre.
Quelle erreur de trading vous a appris la plus grande leçon ?
#cryptotradingpro #TradingPsychology #RiskManagementMastery

3
82
#cryptotradingpro #BTC
🔥 $BTC /USDT Analyse : Où le prix ira-t-il ensuite ?
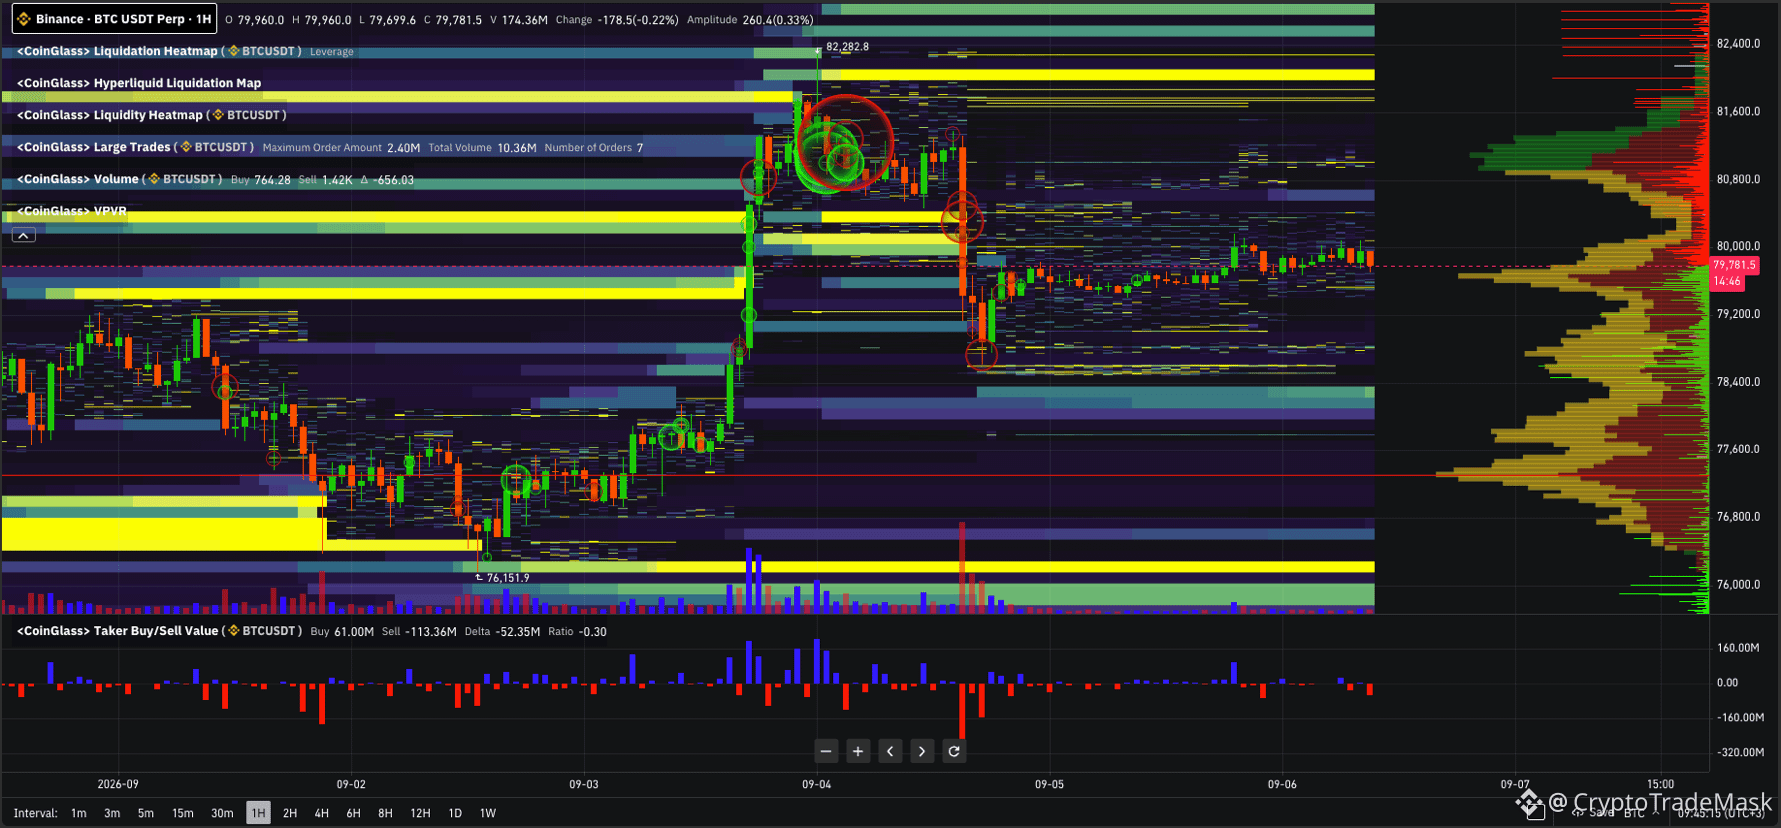
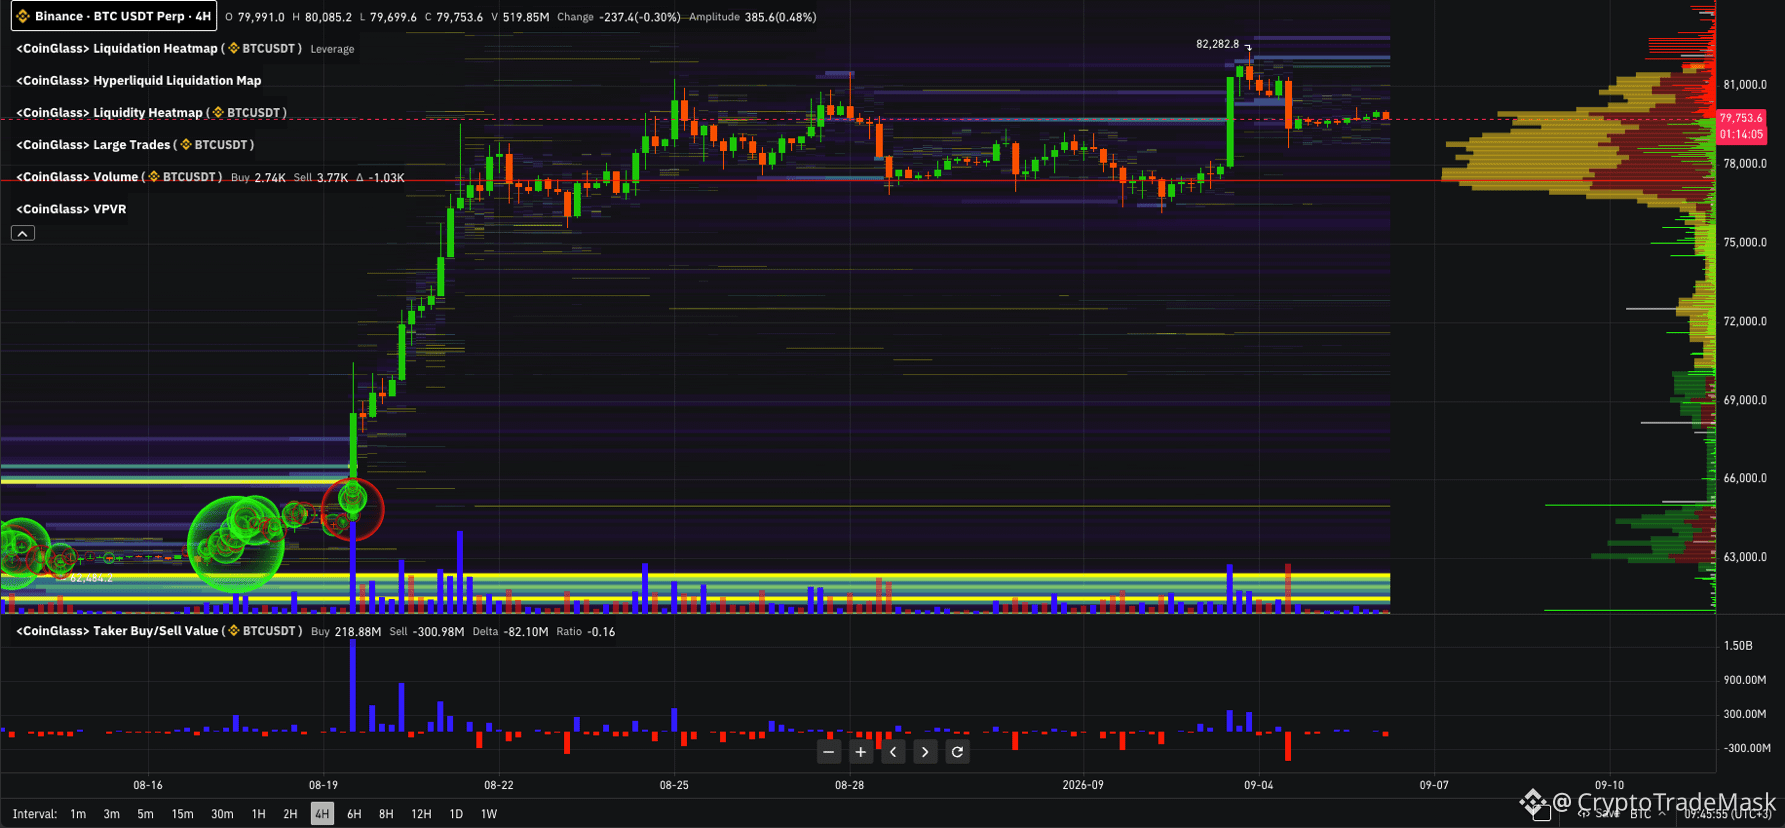
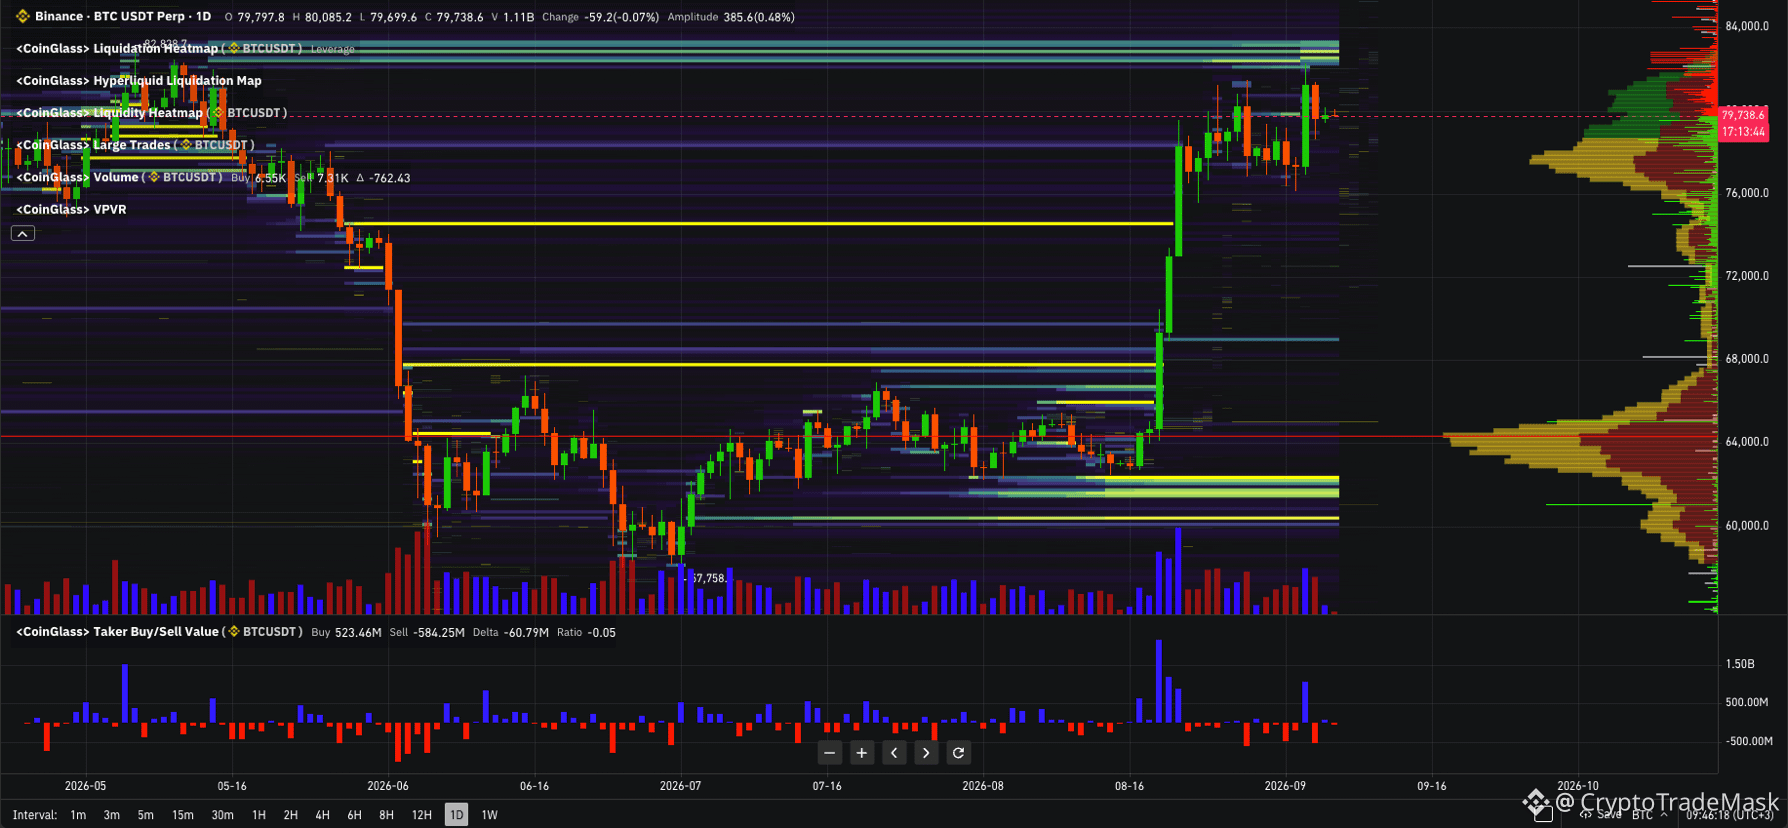
Bitcoin se négocie actuellement dans la fourchette de 79 750 $ à 79 800 $, coincé dans une plage étroite après un fort élan initial. Un coup d’œil à la Liquidation Heatmap et au VPVR montre une configuration intéressante.
🔑 Niveaux clés
Résistance (81 500 $ – 82 300 $) : La zone du plus haut local (82 282 $), où se concentre la principale poche de liquidations de positions shorts.
Zone actuelle (79 000 $ – 80 500 $) : Consolidation juste autour du Point of Control (POC).
Support (78 000 $ – 78 500 $) : Le bloc d’acheteurs le plus proche et la zone locale de forte densité.
Niveau global (74 500 $ – 76 000 $) : La zone miroir où le principal élan a commencé.
📊 Que se passe-t-il sur le marché ?
1. Delta : Sur les unités de temps locales (1H/4H), les ventes dominantes au comptant/ via taker prévalent — le marché se refroidit après la hausse.
2. Liquidité : Le principal aimant au-dessus est une cascade de stops de shorts au-dessus de 81 500 $+. Cependant, les premiers stops de longs se sont également accumulés en dessous, autour de 78 000 $.
🚦 Scénarios principaux
🟢 Priorité (Collecte de liquidité locale \rightarrow croissance) :
Nous attendons une suppression courte (sweep) de la densité vers 78 000 $ - 78 400 $, un schéma de retournement et une poursuite réactive du mouvement vers 81 600 $ - 82 300 $.
🔴 Alternative (Correction profonde) :
Une consolidation par une bougie 4H sous 78 000 $ ouvre la voie à un retest de la zone clé 75 000 $ - 76 000 $ avant la prochaine vague de hausse.
⚠️ Conclusion : La zone de plat actuelle est une préparation à une cassure. Localement, cela ressemble à une accumulation de force avant le breakout de 82 300 $, mais il vaut mieux entrer après un test des niveaux de 78k ou après une consolidation au-dessus de 80,5k.
{future}(BTCUSDT)
#cryptotradingpro #BTC
🔥 $BTC /USDT Analyse : Où le prix ira-t-il ensuite ?
Bitcoin se négocie actuellement dans la fourchette de 79 750 $ à 79 800 $, coincé dans une plage étroite après un fort élan initial. Un coup d’œil à la Liquidation Heatmap et au VPVR montre une configuration intéressante.
🔑 Niveaux clés
Résistance (81 500 $ – 82 300 $) : La zone du plus haut local (82 282 $), où se concentre la principale poche de liquidations de positions shorts.
Zone actuelle (79 000 $ – 80 500 $) : Consolidation juste autour du Point of Control (POC).
Support (78 000 $ – 78 500 $) : Le bloc d’acheteurs le plus proche et la zone locale de forte densité.
Niveau global (74 500 $ – 76 000 $) : La zone miroir où le principal élan a commencé.
📊 Que se passe-t-il sur le marché ?
1. Delta : Sur les unités de temps locales (1H/4H), les ventes dominantes au comptant/ via taker prévalent — le marché se refroidit après la hausse.
2. Liquidité : Le principal aimant au-dessus est une cascade de stops de shorts au-dessus de 81 500 $+. Cependant, les premiers stops de longs se sont également accumulés en dessous, autour de 78 000 $.
🚦 Scénarios principaux
🟢 Priorité (Collecte de liquidité locale \rightarrow croissance) :
Nous attendons une suppression courte (sweep) de la densité vers 78 000 $ - 78 400 $, un schéma de retournement et une poursuite réactive du mouvement vers 81 600 $ - 82 300 $.
🔴 Alternative (Correction profonde) :
Une consolidation par une bougie 4H sous 78 000 $ ouvre la voie à un retest de la zone clé 75 000 $ - 76 000 $ avant la prochaine vague de hausse.
⚠️ Conclusion : La zone de plat actuelle est une préparation à une cassure. Localement, cela ressemble à une accumulation de force avant le breakout de 82 300 $, mais il vaut mieux entrer après un test des niveaux de 78k ou après une consolidation au-dessus de 80,5k.
🔥 $BTC /USDT Analyse : Où le prix ira-t-il ensuite ?
Bitcoin se négocie actuellement dans la fourchette de 79 750 $ à 79 800 $, coincé dans une plage étroite après un fort élan initial. Un coup d’œil à la Liquidation Heatmap et au VPVR montre une configuration intéressante.
🔑 Niveaux clés
Résistance (81 500 $ – 82 300 $) : La zone du plus haut local (82 282 $), où se concentre la principale poche de liquidations de positions shorts.
Zone actuelle (79 000 $ – 80 500 $) : Consolidation juste autour du Point of Control (POC).
Support (78 000 $ – 78 500 $) : Le bloc d’acheteurs le plus proche et la zone locale de forte densité.
Niveau global (74 500 $ – 76 000 $) : La zone miroir où le principal élan a commencé.
📊 Que se passe-t-il sur le marché ?
1. Delta : Sur les unités de temps locales (1H/4H), les ventes dominantes au comptant/ via taker prévalent — le marché se refroidit après la hausse.
2. Liquidité : Le principal aimant au-dessus est une cascade de stops de shorts au-dessus de 81 500 $+. Cependant, les premiers stops de longs se sont également accumulés en dessous, autour de 78 000 $.
🚦 Scénarios principaux
🟢 Priorité (Collecte de liquidité locale \rightarrow croissance) :
Nous attendons une suppression courte (sweep) de la densité vers 78 000 $ - 78 400 $, un schéma de retournement et une poursuite réactive du mouvement vers 81 600 $ - 82 300 $.
🔴 Alternative (Correction profonde) :
Une consolidation par une bougie 4H sous 78 000 $ ouvre la voie à un retest de la zone clé 75 000 $ - 76 000 $ avant la prochaine vague de hausse.
⚠️ Conclusion : La zone de plat actuelle est une préparation à une cassure. Localement, cela ressemble à une accumulation de force avant le breakout de 82 300 $, mais il vaut mieux entrer après un test des niveaux de 78k ou après une consolidation au-dessus de 80,5k.
1
286
#cryptotradingpro #metrics #BTC
$BTC : Analyse du marché et indicateurs clés 📊
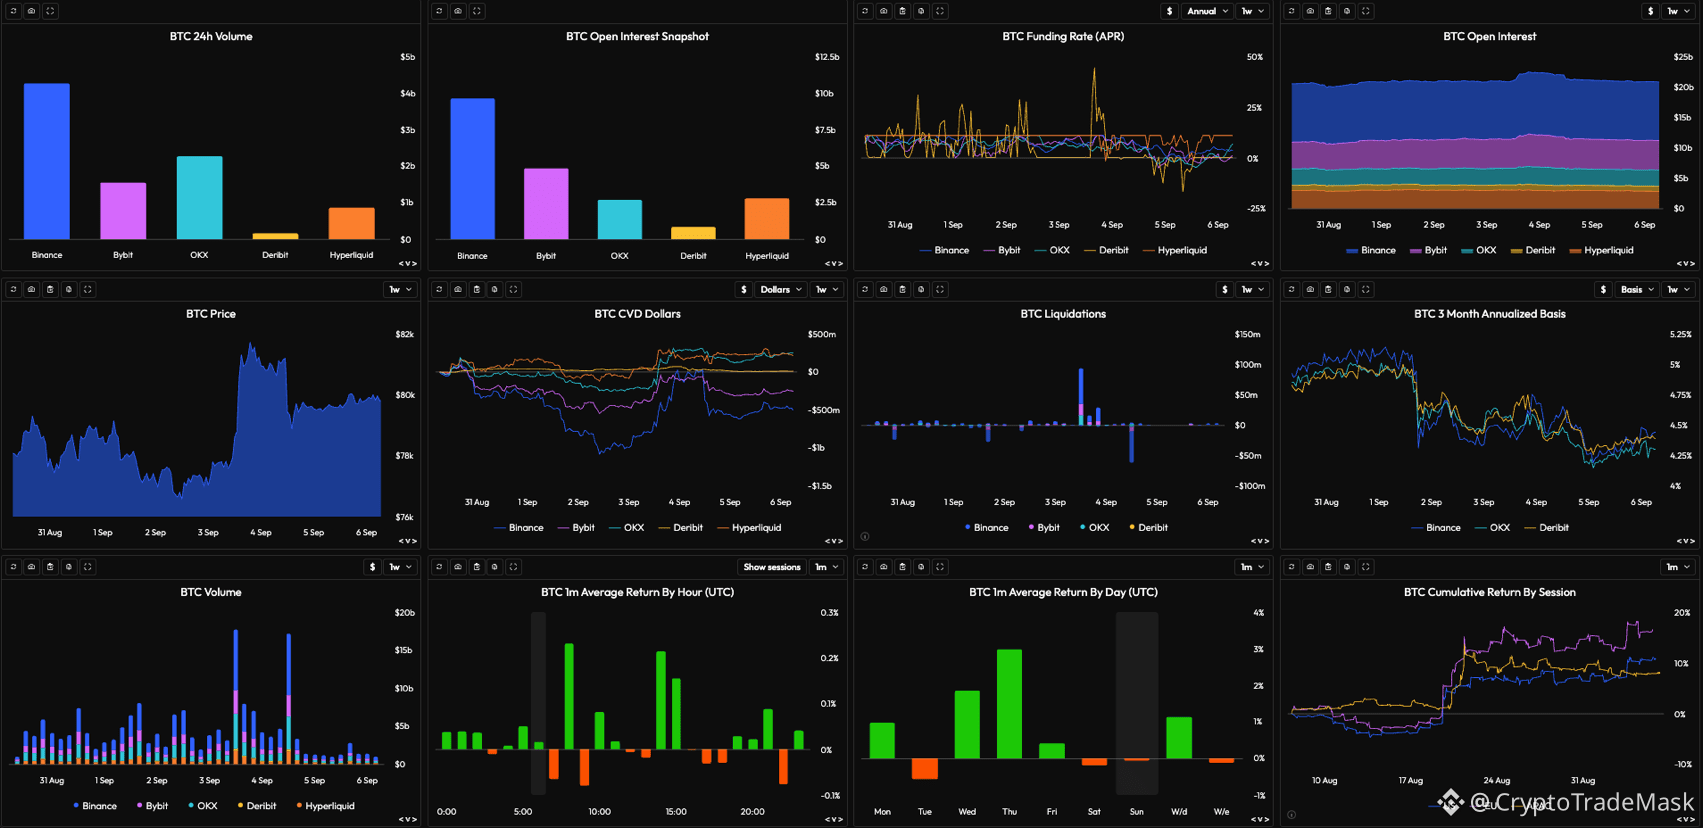
Après une forte dynamique les 3 et 4 septembre, le Bitcoin est entré dans une phase de consolidation aux sommets atteints. Analysons ce qui se passe actuellement sur le marché :
➡️ Prix et volumes : La croissance explosive a été soutenue par des volumes élevés (le principal volume est passé par Binance et Bybit). Maintenant, les volumes sont revenus à des niveaux moyens, ce qui indique une pause avant le prochain mouvement.
➡️ Liquidations et CVD : Le principal carburant de la hausse a été une cascade massive de liquidations de positions courtes. Il existe une différence intéressante dans le CVD - Binance et Bybit ont enregistré une croissance, tandis que les autres plateformes maintiennent un volume cumulatif neutre à positif.
➡️ Dérivés : L’intérêt ouvert (OI) reste élevé ($20B+), mais le taux de financement (Funding Rate) est déjà revenu dans la zone neutre. Le marché s’est refroidi après une surchauffe, ce qui crée une base saine pour la suite.
➡️ Sessions : Le principal moteur des acheteurs est la session américaine (US), suivie de l’Europe (EU). L’Asie affiche actuellement le moins d’activité.
⚠️ Conclusion :
Le marché est en phase d’accumulation après le short squeeze. L’absence de surchauffe du funding avec un OI élevé indique une préparation à un nouveau mouvement directionnel, peut-être après l’élimination du pool de liquidité en dessous. Le déclencheur clé pour la poursuite de la tendance haussière est de maintenir la fourchette actuelle et de faire venir un acheteur spot.
{future}(BTCUSDT)
#cryptotradingpro #metrics #BTC
$BTC : Analyse du marché et indicateurs clés 📊
Après une forte dynamique les 3 et 4 septembre, le Bitcoin est entré dans une phase de consolidation aux sommets atteints. Analysons ce qui se passe actuellement sur le marché :
➡️ Prix et volumes : La croissance explosive a été soutenue par des volumes élevés (le principal volume est passé par Binance et Bybit). Maintenant, les volumes sont revenus à des niveaux moyens, ce qui indique une pause avant le prochain mouvement.
➡️ Liquidations et CVD : Le principal carburant de la hausse a été une cascade massive de liquidations de positions courtes. Il existe une différence intéressante dans le CVD - Binance et Bybit ont enregistré une croissance, tandis que les autres plateformes maintiennent un volume cumulatif neutre à positif.
➡️ Dérivés : L’intérêt ouvert (OI) reste élevé ($20B+), mais le taux de financement (Funding Rate) est déjà revenu dans la zone neutre. Le marché s’est refroidi après une surchauffe, ce qui crée une base saine pour la suite.
➡️ Sessions : Le principal moteur des acheteurs est la session américaine (US), suivie de l’Europe (EU). L’Asie affiche actuellement le moins d’activité.
⚠️ Conclusion :
Le marché est en phase d’accumulation après le short squeeze. L’absence de surchauffe du funding avec un OI élevé indique une préparation à un nouveau mouvement directionnel, peut-être après l’élimination du pool de liquidité en dessous. Le déclencheur clé pour la poursuite de la tendance haussière est de maintenir la fourchette actuelle et de faire venir un acheteur spot.
$BTC : Analyse du marché et indicateurs clés 📊
Après une forte dynamique les 3 et 4 septembre, le Bitcoin est entré dans une phase de consolidation aux sommets atteints. Analysons ce qui se passe actuellement sur le marché :
➡️ Prix et volumes : La croissance explosive a été soutenue par des volumes élevés (le principal volume est passé par Binance et Bybit). Maintenant, les volumes sont revenus à des niveaux moyens, ce qui indique une pause avant le prochain mouvement.
➡️ Liquidations et CVD : Le principal carburant de la hausse a été une cascade massive de liquidations de positions courtes. Il existe une différence intéressante dans le CVD - Binance et Bybit ont enregistré une croissance, tandis que les autres plateformes maintiennent un volume cumulatif neutre à positif.
➡️ Dérivés : L’intérêt ouvert (OI) reste élevé ($20B+), mais le taux de financement (Funding Rate) est déjà revenu dans la zone neutre. Le marché s’est refroidi après une surchauffe, ce qui crée une base saine pour la suite.
➡️ Sessions : Le principal moteur des acheteurs est la session américaine (US), suivie de l’Europe (EU). L’Asie affiche actuellement le moins d’activité.
⚠️ Conclusion :
Le marché est en phase d’accumulation après le short squeeze. L’absence de surchauffe du funding avec un OI élevé indique une préparation à un nouveau mouvement directionnel, peut-être après l’élimination du pool de liquidité en dessous. Le déclencheur clé pour la poursuite de la tendance haussière est de maintenir la fourchette actuelle et de faire venir un acheteur spot.
1
90
#cryptotradingpro #BTC
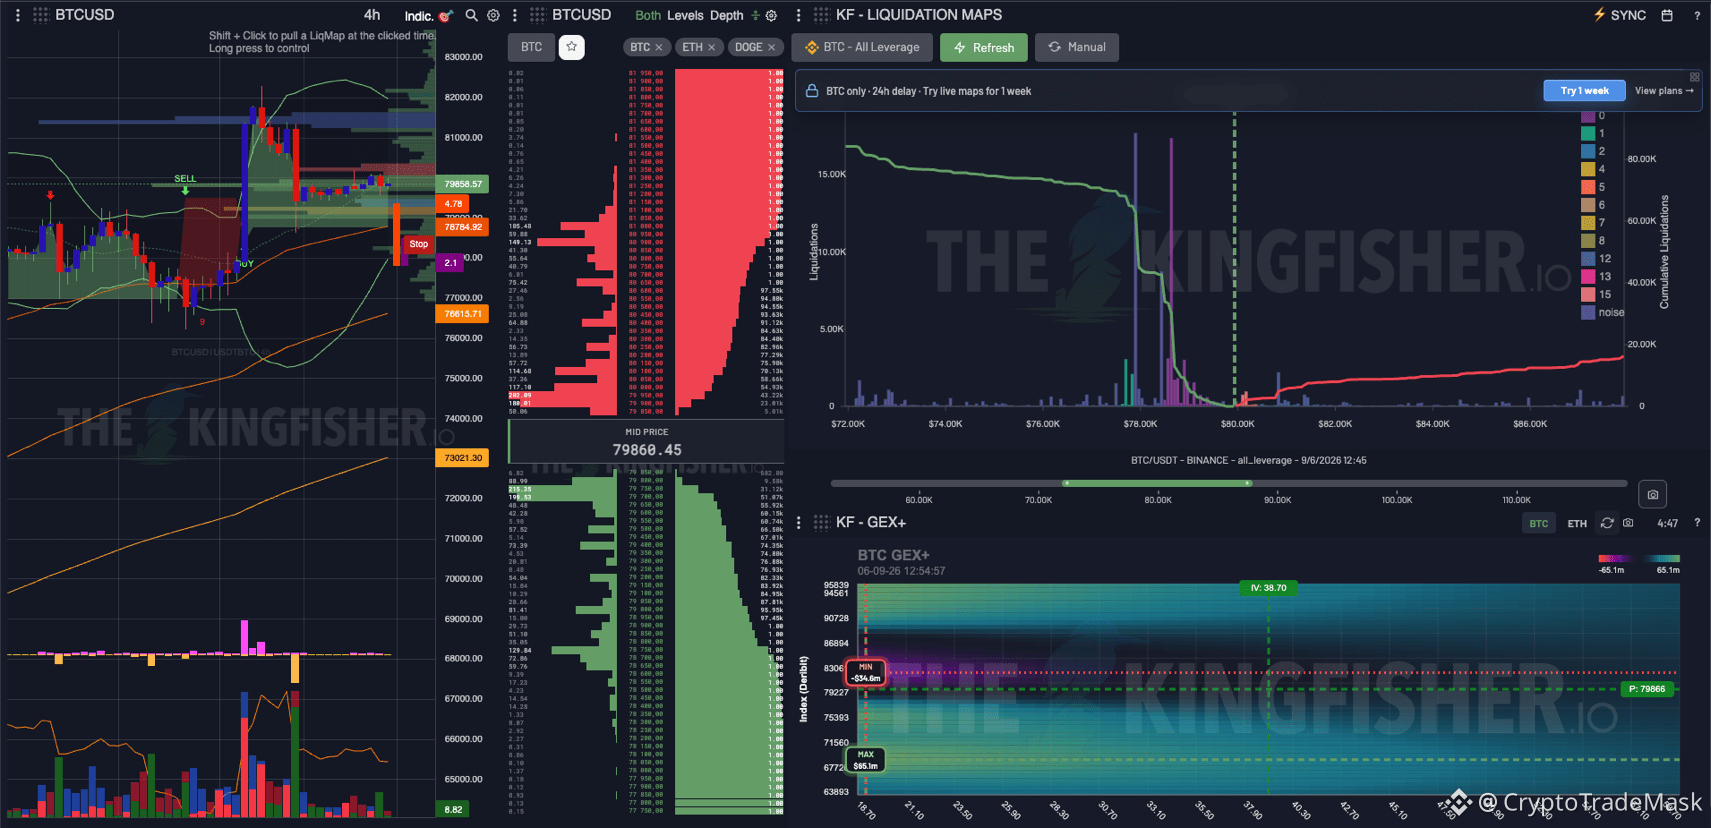
🚀 Analyse de $BTC /USD (4H) : quelle suite après le retrait de liquidité ?
Le graphique du Bitcoin a connu une correction locale prévue après une impulsion haussière vers $82,000+. Le prix actuel se négocie autour de $79,860, et les données montrent clairement ce qui s’est exactement passé sur le marché.
🔍 Facteurs clés issus des graphiques et des métriques
➡️ Carte des liquidations : Une puissante vague de liquidations des positions longues à fort effet de levier a eu lieu dans la zone $78,000–$79,000. Le marché a vidé les positions avant le prochain choix de direction.
➡️ Carnet d’ordres et volumes : Au-dessus du prix actuel ($81,000–$83,000), un mur dense d’ordres de vente limite demeure, ce qui freine un rebond rapide. Dans le même temps, un bon support acheteur s’est formé dans la zone $76,000–$78,000.
➡️ Zones Gamma (GEX+) : Le seuil inférieur du corridor de risque est déplacé vers $75,300–$78,200. Tant que le prix reste au-dessus de cette fourchette, le schéma global demeure constructif.
📊 Niveaux à surveiller
Résistance : $81,000–$82,500 (accumulation de liquidité short et zones de vente).
Support 1 : $78,500–$78,700 (creux local après le dernier drainage).
Support 2 (clé) : $76,600–$77,000 (ligne de tendance dynamique).
🎯 Scénarios
1. De base (Consolidation et rebond) : Le maintien de $78,500 ouvrira la voie à un retest de $81,000–$82,000 pour « retirer » la liquidité des shorts accumulés.
2. Alternative (Baisse plus profonde) : Une perte de $78,500 enverra le prix vers le support de tendance clé à $76,600–$77,000, où le sort de la dynamique haussière future sera décidé.
⚠️ Résumé : Il n’est pas conseillé de trader depuis le marché à ce stade. La stratégie optimale est d’attendre une confirmation de retournement sur les unités de temps inférieures à partir des niveaux de $78,700 ou $77,000.
{future}(BTCUSDT)
#cryptotradingpro #BTC
🚀 Analyse de $BTC /USD (4H) : quelle suite après le retrait de liquidité ?
Le graphique du Bitcoin a connu une correction locale prévue après une impulsion haussière vers $82,000+. Le prix actuel se négocie autour de $79,860, et les données montrent clairement ce qui s’est exactement passé sur le marché.
🔍 Facteurs clés issus des graphiques et des métriques
➡️ Carte des liquidations : Une puissante vague de liquidations des positions longues à fort effet de levier a eu lieu dans la zone $78,000–$79,000. Le marché a vidé les positions avant le prochain choix de direction.
➡️ Carnet d’ordres et volumes : Au-dessus du prix actuel ($81,000–$83,000), un mur dense d’ordres de vente limite demeure, ce qui freine un rebond rapide. Dans le même temps, un bon support acheteur s’est formé dans la zone $76,000–$78,000.
➡️ Zones Gamma (GEX+) : Le seuil inférieur du corridor de risque est déplacé vers $75,300–$78,200. Tant que le prix reste au-dessus de cette fourchette, le schéma global demeure constructif.
📊 Niveaux à surveiller
Résistance : $81,000–$82,500 (accumulation de liquidité short et zones de vente).
Support 1 : $78,500–$78,700 (creux local après le dernier drainage).
Support 2 (clé) : $76,600–$77,000 (ligne de tendance dynamique).
🎯 Scénarios
1. De base (Consolidation et rebond) : Le maintien de $78,500 ouvrira la voie à un retest de $81,000–$82,000 pour « retirer » la liquidité des shorts accumulés.
2. Alternative (Baisse plus profonde) : Une perte de $78,500 enverra le prix vers le support de tendance clé à $76,600–$77,000, où le sort de la dynamique haussière future sera décidé.
⚠️ Résumé : Il n’est pas conseillé de trader depuis le marché à ce stade. La stratégie optimale est d’attendre une confirmation de retournement sur les unités de temps inférieures à partir des niveaux de $78,700 ou $77,000.
🚀 Analyse de $BTC /USD (4H) : quelle suite après le retrait de liquidité ?
Le graphique du Bitcoin a connu une correction locale prévue après une impulsion haussière vers $82,000+. Le prix actuel se négocie autour de $79,860, et les données montrent clairement ce qui s’est exactement passé sur le marché.
🔍 Facteurs clés issus des graphiques et des métriques
➡️ Carte des liquidations : Une puissante vague de liquidations des positions longues à fort effet de levier a eu lieu dans la zone $78,000–$79,000. Le marché a vidé les positions avant le prochain choix de direction.
➡️ Carnet d’ordres et volumes : Au-dessus du prix actuel ($81,000–$83,000), un mur dense d’ordres de vente limite demeure, ce qui freine un rebond rapide. Dans le même temps, un bon support acheteur s’est formé dans la zone $76,000–$78,000.
➡️ Zones Gamma (GEX+) : Le seuil inférieur du corridor de risque est déplacé vers $75,300–$78,200. Tant que le prix reste au-dessus de cette fourchette, le schéma global demeure constructif.
📊 Niveaux à surveiller
Résistance : $81,000–$82,500 (accumulation de liquidité short et zones de vente).
Support 1 : $78,500–$78,700 (creux local après le dernier drainage).
Support 2 (clé) : $76,600–$77,000 (ligne de tendance dynamique).
🎯 Scénarios
1. De base (Consolidation et rebond) : Le maintien de $78,500 ouvrira la voie à un retest de $81,000–$82,000 pour « retirer » la liquidité des shorts accumulés.
2. Alternative (Baisse plus profonde) : Une perte de $78,500 enverra le prix vers le support de tendance clé à $76,600–$77,000, où le sort de la dynamique haussière future sera décidé.
⚠️ Résumé : Il n’est pas conseillé de trader depuis le marché à ce stade. La stratégie optimale est d’attendre une confirmation de retournement sur les unités de temps inférieures à partir des niveaux de $78,700 ou $77,000.
1
50
#cryptotradingpro #BTC
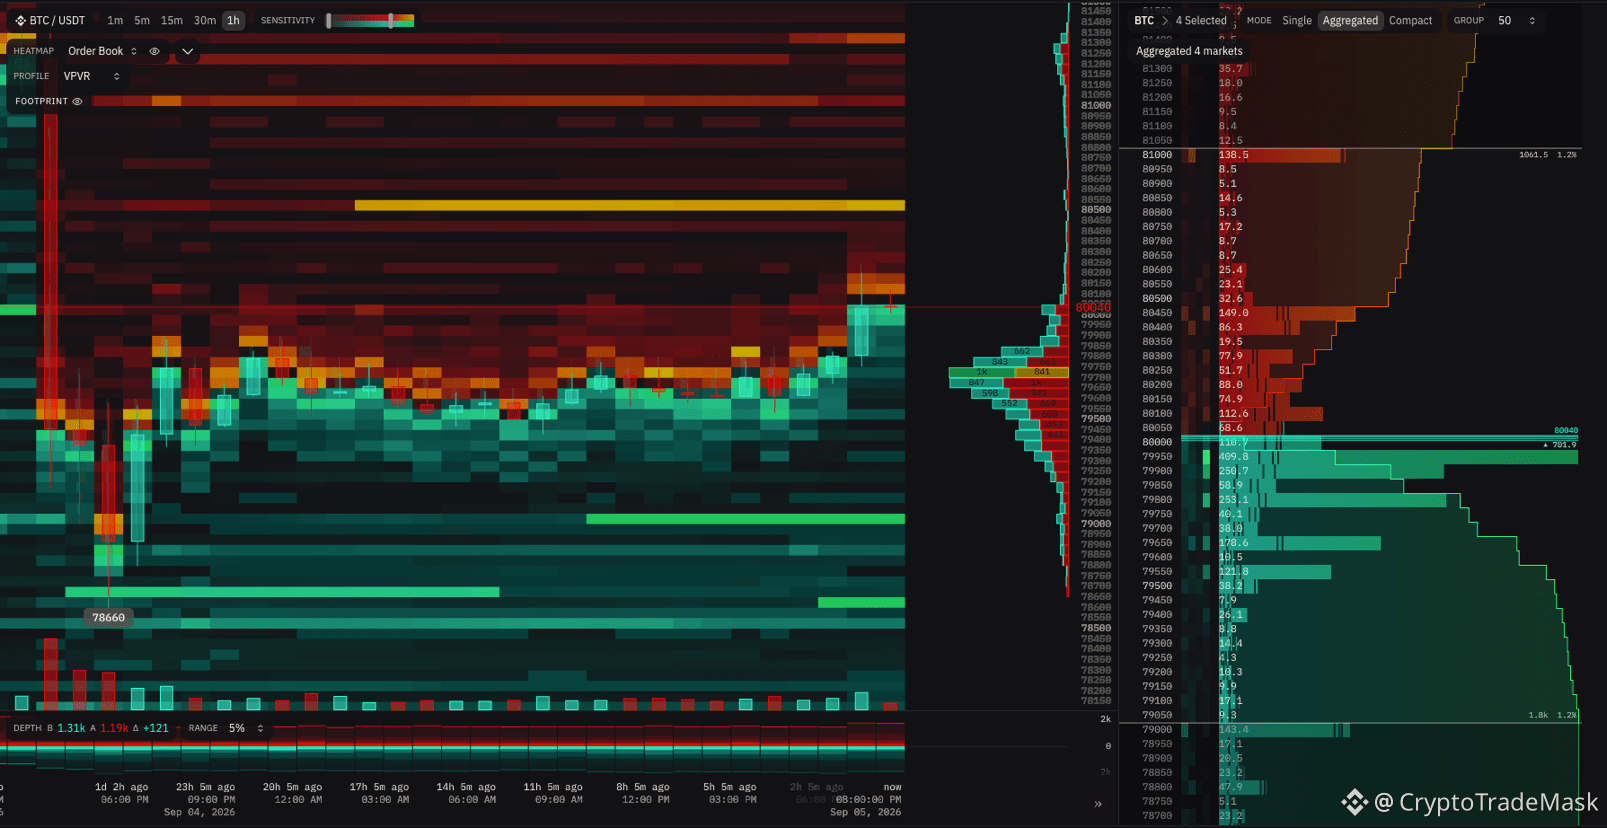
📊 $BTC /USDT (1h) : Analyse de la liquidité et de la carte thermique
Bitcoin montre un rebond local après avoir testé le plus bas à 78 660 $ et se négocie actuellement dans la zone de 80 400 $ - 80 500 $.
➡️ Niveaux clés et situation sur le carnet d'ordres :
Zone de résistance (80 500 $ - 81 000 $) : la carte thermique montre clairement une forte accumulation d'ordres limités de vente. Le plus grand plafond de liquidité est concentré à 81 000 $ (plus de 138 BTC dans le carnet).
➡️ Support clé (79 900 $ - 80 000 $) : les acheteurs ont formé un solide bloc de protection sous le prix actuel. Une importante liquidité est visible à 79 950 $ (plus de 400 BTC).
➡️ Profil de volume (VPVR) : le volume principal se négocie dans la zone de 80 100 $ - 80 300 $. Une consolidation au-dessus de ce niveau POC donne l'avantage aux acheteurs.
Scénarios de mouvement :
🟢 Priorité : maintien de la zone des 80 000 $ et cassure impulsive de 81 000 $ sur une cascade de liquidations de positions short.
🔴 Alternative : un rejet de la résistance 80 800 $ - 81 000 $ avec un retour sous 80 000 $ ouvrira la voie à un nouveau test de 79 500 $ et 78 660 $.
⚠️ La situation du marché nécessite de l'attention : nous surveillons la réaction à 81 000 $.
{future}(BTCUSDT)
#cryptotradingpro #BTC
📊 $BTC /USDT (1h) : Analyse de la liquidité et de la carte thermique
Bitcoin montre un rebond local après avoir testé le plus bas à 78 660 $ et se négocie actuellement dans la zone de 80 400 $ - 80 500 $.
➡️ Niveaux clés et situation sur le carnet d'ordres :
Zone de résistance (80 500 $ - 81 000 $) : la carte thermique montre clairement une forte accumulation d'ordres limités de vente. Le plus grand plafond de liquidité est concentré à 81 000 $ (plus de 138 BTC dans le carnet).
➡️ Support clé (79 900 $ - 80 000 $) : les acheteurs ont formé un solide bloc de protection sous le prix actuel. Une importante liquidité est visible à 79 950 $ (plus de 400 BTC).
➡️ Profil de volume (VPVR) : le volume principal se négocie dans la zone de 80 100 $ - 80 300 $. Une consolidation au-dessus de ce niveau POC donne l'avantage aux acheteurs.
Scénarios de mouvement :
🟢 Priorité : maintien de la zone des 80 000 $ et cassure impulsive de 81 000 $ sur une cascade de liquidations de positions short.
🔴 Alternative : un rejet de la résistance 80 800 $ - 81 000 $ avec un retour sous 80 000 $ ouvrira la voie à un nouveau test de 79 500 $ et 78 660 $.
⚠️ La situation du marché nécessite de l'attention : nous surveillons la réaction à 81 000 $.
📊 $BTC /USDT (1h) : Analyse de la liquidité et de la carte thermique
Bitcoin montre un rebond local après avoir testé le plus bas à 78 660 $ et se négocie actuellement dans la zone de 80 400 $ - 80 500 $.
➡️ Niveaux clés et situation sur le carnet d'ordres :
Zone de résistance (80 500 $ - 81 000 $) : la carte thermique montre clairement une forte accumulation d'ordres limités de vente. Le plus grand plafond de liquidité est concentré à 81 000 $ (plus de 138 BTC dans le carnet).
➡️ Support clé (79 900 $ - 80 000 $) : les acheteurs ont formé un solide bloc de protection sous le prix actuel. Une importante liquidité est visible à 79 950 $ (plus de 400 BTC).
➡️ Profil de volume (VPVR) : le volume principal se négocie dans la zone de 80 100 $ - 80 300 $. Une consolidation au-dessus de ce niveau POC donne l'avantage aux acheteurs.
Scénarios de mouvement :
🟢 Priorité : maintien de la zone des 80 000 $ et cassure impulsive de 81 000 $ sur une cascade de liquidations de positions short.
🔴 Alternative : un rejet de la résistance 80 800 $ - 81 000 $ avec un retour sous 80 000 $ ouvrira la voie à un nouveau test de 79 500 $ et 78 660 $.
⚠️ La situation du marché nécessite de l'attention : nous surveillons la réaction à 81 000 $.
2
60
#cryptotradingpro #BTC
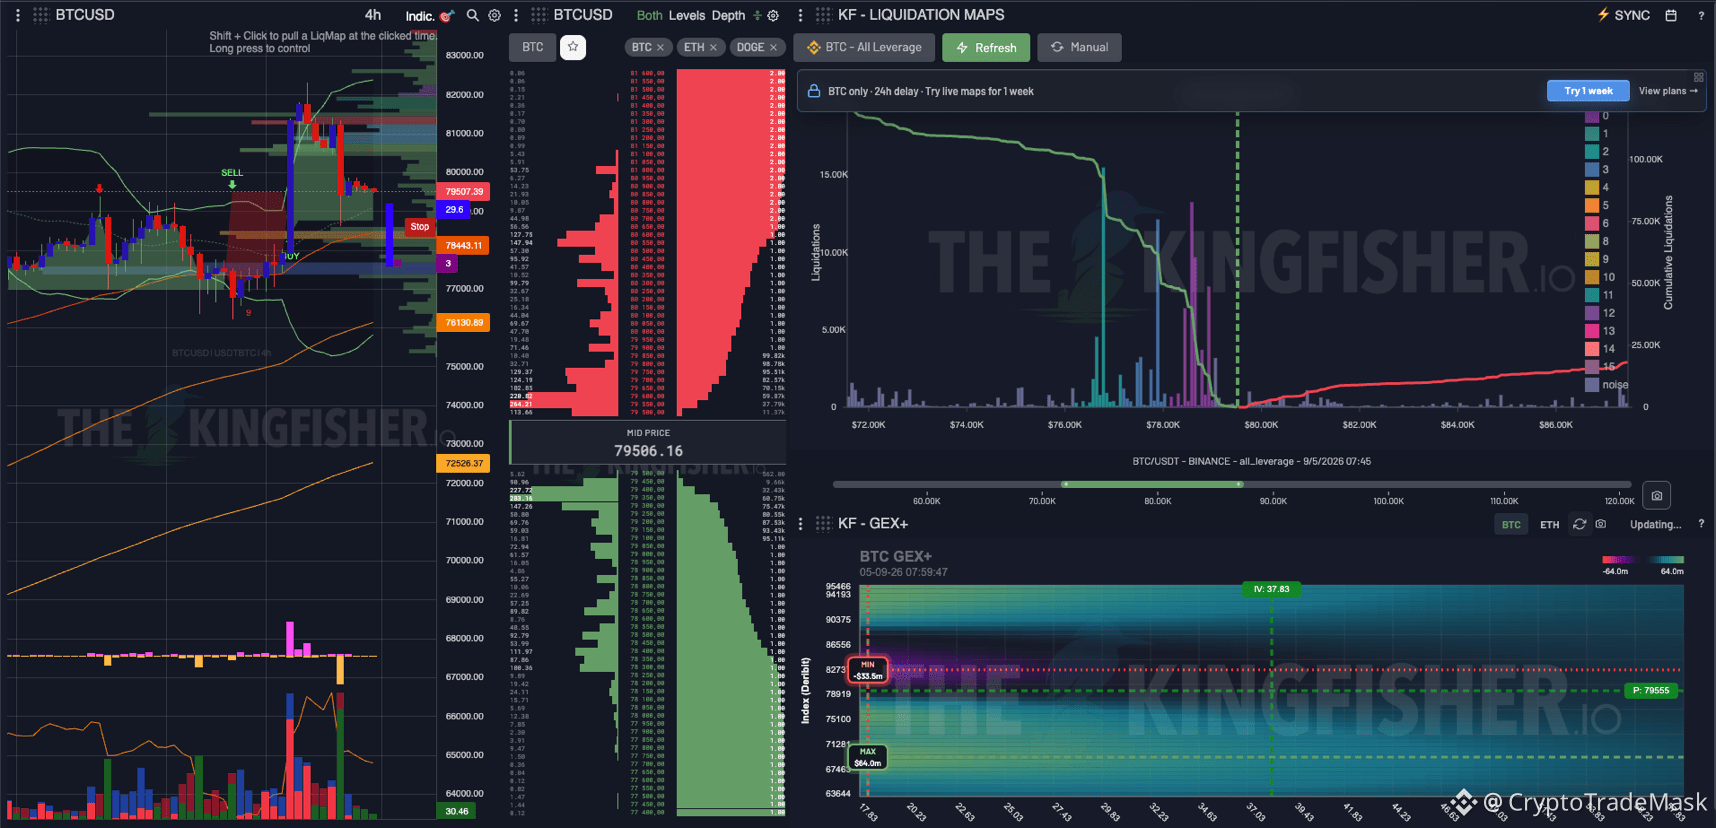
📊 $BTC /USD : Analyse de la liquidité et image locale (4H)
Le prix actuel du Bitcoin évolue entre 79 500 $ et 79 600 $. Après une tentative infructueuse de consolidation au-dessus de 82 000 $, le marché est entré dans une phase de consolidation locale avec une tendance baissière marquée.
🎯 Niveaux clés sur le graphique :
Résistance : 80 500 $–82 000 $ (zone d’accumulation des volumes pour la vente)
Support : 78 440 $ (près du niveau de stop)
Zone principale d’intérêt : 76 100 $–77 000 $
🗺️ Que dit la Liquidation Map (Le Martin-pêcheur) ?
Un vaste pool de liquidations de positions longues s’est accumulé sous le prix actuel (notamment dans la plage de 76 500 $–78 000 $). Il y a nettement moins de liquidité pour les positions courtes depuis le haut, ce qui fait du mouvement vers le bas une direction prioritaire pour le market maker.
📉 Scénario principal :
Le plus probable est un balayage (retrait) de liquidité depuis le bas. Le prix a besoin d’une impulsion pour décharger le marché ; on s’attend donc à une baisse vers la zone 76 000 $–77 000 $. À partir de là, s’il y a une réaction acheteuse, une inversion et une retest de 80 000 $+ sont possibles.
📈 Alternative :
Le retour d’une dynamique haussière n’est possible que si la bougie 4H clôture de manière impulsive au-dessus de 80 500 $.
⚠️ Résumé : Tant que le prix est sous 80 000 $, il est risqué de prendre des positions longues « sur le marché ». Il est plus logique d’attendre soit une réaction dans la zone de cascade de liquidations (76k–77k), soit après une cassure claire de la résistance.
{future}(BTCUSDT)
#cryptotradingpro #BTC
📊 $BTC /USD : Analyse de la liquidité et image locale (4H)
Le prix actuel du Bitcoin évolue entre 79 500 $ et 79 600 $. Après une tentative infructueuse de consolidation au-dessus de 82 000 $, le marché est entré dans une phase de consolidation locale avec une tendance baissière marquée.
🎯 Niveaux clés sur le graphique :
Résistance : 80 500 $–82 000 $ (zone d’accumulation des volumes pour la vente)
Support : 78 440 $ (près du niveau de stop)
Zone principale d’intérêt : 76 100 $–77 000 $
🗺️ Que dit la Liquidation Map (Le Martin-pêcheur) ?
Un vaste pool de liquidations de positions longues s’est accumulé sous le prix actuel (notamment dans la plage de 76 500 $–78 000 $). Il y a nettement moins de liquidité pour les positions courtes depuis le haut, ce qui fait du mouvement vers le bas une direction prioritaire pour le market maker.
📉 Scénario principal :
Le plus probable est un balayage (retrait) de liquidité depuis le bas. Le prix a besoin d’une impulsion pour décharger le marché ; on s’attend donc à une baisse vers la zone 76 000 $–77 000 $. À partir de là, s’il y a une réaction acheteuse, une inversion et une retest de 80 000 $+ sont possibles.
📈 Alternative :
Le retour d’une dynamique haussière n’est possible que si la bougie 4H clôture de manière impulsive au-dessus de 80 500 $.
⚠️ Résumé : Tant que le prix est sous 80 000 $, il est risqué de prendre des positions longues « sur le marché ». Il est plus logique d’attendre soit une réaction dans la zone de cascade de liquidations (76k–77k), soit après une cassure claire de la résistance.
📊 $BTC /USD : Analyse de la liquidité et image locale (4H)
Le prix actuel du Bitcoin évolue entre 79 500 $ et 79 600 $. Après une tentative infructueuse de consolidation au-dessus de 82 000 $, le marché est entré dans une phase de consolidation locale avec une tendance baissière marquée.
🎯 Niveaux clés sur le graphique :
Résistance : 80 500 $–82 000 $ (zone d’accumulation des volumes pour la vente)
Support : 78 440 $ (près du niveau de stop)
Zone principale d’intérêt : 76 100 $–77 000 $
🗺️ Que dit la Liquidation Map (Le Martin-pêcheur) ?
Un vaste pool de liquidations de positions longues s’est accumulé sous le prix actuel (notamment dans la plage de 76 500 $–78 000 $). Il y a nettement moins de liquidité pour les positions courtes depuis le haut, ce qui fait du mouvement vers le bas une direction prioritaire pour le market maker.
📉 Scénario principal :
Le plus probable est un balayage (retrait) de liquidité depuis le bas. Le prix a besoin d’une impulsion pour décharger le marché ; on s’attend donc à une baisse vers la zone 76 000 $–77 000 $. À partir de là, s’il y a une réaction acheteuse, une inversion et une retest de 80 000 $+ sont possibles.
📈 Alternative :
Le retour d’une dynamique haussière n’est possible que si la bougie 4H clôture de manière impulsive au-dessus de 80 500 $.
⚠️ Résumé : Tant que le prix est sous 80 000 $, il est risqué de prendre des positions longues « sur le marché ». Il est plus logique d’attendre soit une réaction dans la zone de cascade de liquidations (76k–77k), soit après une cassure claire de la résistance.
176

·
--
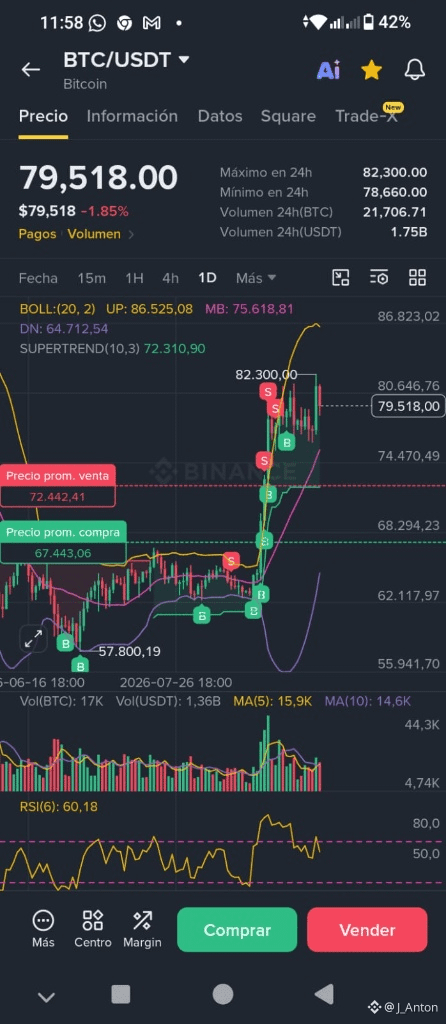
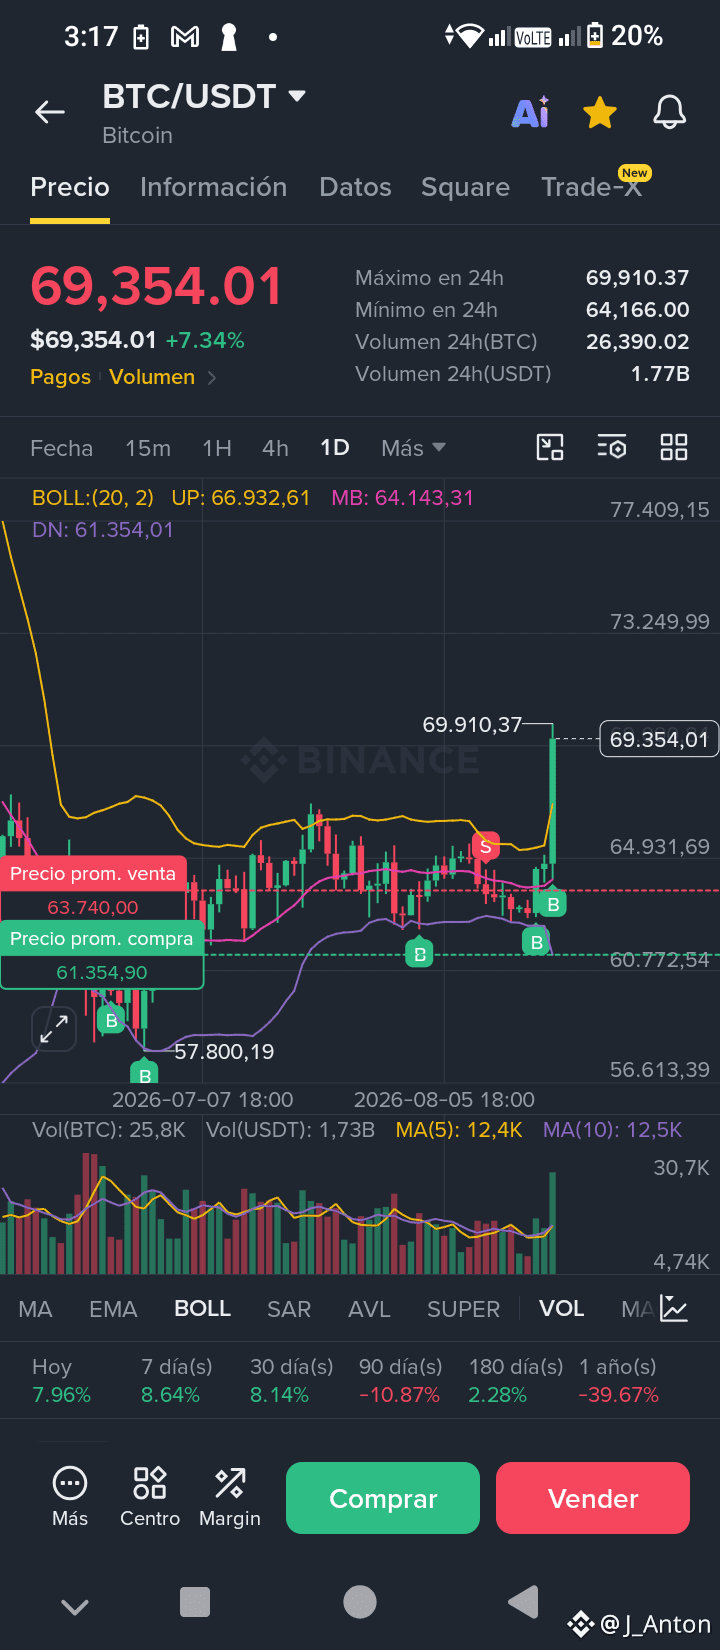
🚀 Des $69K à casser les $79,500 ! Où te situes-tu dans ce mouvement ? 🔥📊
Vous vous souvenez quand nous analysions la cassure des $69,000 ? Le marché ne s'arrête pas. Aujourd'hui, Bitcoin atteint $79,518, frôlant les plus hauts de $82,300 et défiant la bande supérieure de Bollinger ($86.5K). 📈⚡️
Beaucoup voient le graphique vert et ressentent le FOMO. Je préfère regarder l'exécution et la stratégie.
Regardez mes zones actuelles sur le graphique joint : 🟢 Zone d'Achat Moyen : ~$67,443 USDT 🔴 Zone de Vente Partielle : ~$72,442 $USDT 🎯 Le jeu actuel : Sécuriser les bénéfices avec sang-froid pendant que les bandes de Bollinger s'élargissent et que le prix vise son prochain objectif.
Il ne s'agit pas de deviner l'avenir, mais de respecter vos propres zones d'entrée et de sortie lorsque le marché devient euphorique. 🧠💼
👇 Je veux lire la communauté : Avec $BTC qui cote fortement dans cette zone des $79K...
Prends-tu des bénéfices partiels, attends-tu un repli pour accumuler, ou es-tu déjà tombé dans le piège du FOMO ?
{future}(BTCUSDT)
Laissez-moi ça dans les commentaires et débattons stratégie ! 🚀👇
#bitcoin #cryptotradingpro #AnalisisTecnico #HODL
🚀 Des $69K à casser les $79,500 ! Où te situes-tu dans ce mouvement ? 🔥📊
Vous vous souvenez quand nous analysions la cassure des $69,000 ? Le marché ne s'arrête pas. Aujourd'hui, Bitcoin atteint $79,518, frôlant les plus hauts de $82,300 et défiant la bande supérieure de Bollinger ($86.5K). 📈⚡️
Beaucoup voient le graphique vert et ressentent le FOMO. Je préfère regarder l'exécution et la stratégie.
Regardez mes zones actuelles sur le graphique joint : 🟢 Zone d'Achat Moyen : ~$67,443 USDT 🔴 Zone de Vente Partielle : ~$72,442 $USDT 🎯 Le jeu actuel : Sécuriser les bénéfices avec sang-froid pendant que les bandes de Bollinger s'élargissent et que le prix vise son prochain objectif.
Il ne s'agit pas de deviner l'avenir, mais de respecter vos propres zones d'entrée et de sortie lorsque le marché devient euphorique. 🧠💼
👇 Je veux lire la communauté : Avec $BTC qui cote fortement dans cette zone des $79K...
Prends-tu des bénéfices partiels, attends-tu un repli pour accumuler, ou es-tu déjà tombé dans le piège du FOMO ?
Laissez-moi ça dans les commentaires et débattons stratégie ! 🚀👇
#bitcoin #cryptotradingpro #AnalisisTecnico #HODL
Vous vous souvenez quand nous analysions la cassure des $69,000 ? Le marché ne s'arrête pas. Aujourd'hui, Bitcoin atteint $79,518, frôlant les plus hauts de $82,300 et défiant la bande supérieure de Bollinger ($86.5K). 📈⚡️
Beaucoup voient le graphique vert et ressentent le FOMO. Je préfère regarder l'exécution et la stratégie.
Regardez mes zones actuelles sur le graphique joint : 🟢 Zone d'Achat Moyen : ~$67,443 USDT 🔴 Zone de Vente Partielle : ~$72,442 $USDT 🎯 Le jeu actuel : Sécuriser les bénéfices avec sang-froid pendant que les bandes de Bollinger s'élargissent et que le prix vise son prochain objectif.
Il ne s'agit pas de deviner l'avenir, mais de respecter vos propres zones d'entrée et de sortie lorsque le marché devient euphorique. 🧠💼
👇 Je veux lire la communauté : Avec $BTC qui cote fortement dans cette zone des $79K...
Prends-tu des bénéfices partiels, attends-tu un repli pour accumuler, ou es-tu déjà tombé dans le piège du FOMO ?
Laissez-moi ça dans les commentaires et débattons stratégie ! 🚀👇
#bitcoin #cryptotradingpro #AnalisisTecnico #HODL
LM mis amores:
hola
3
1
551
#cryptotradingpro #BTC
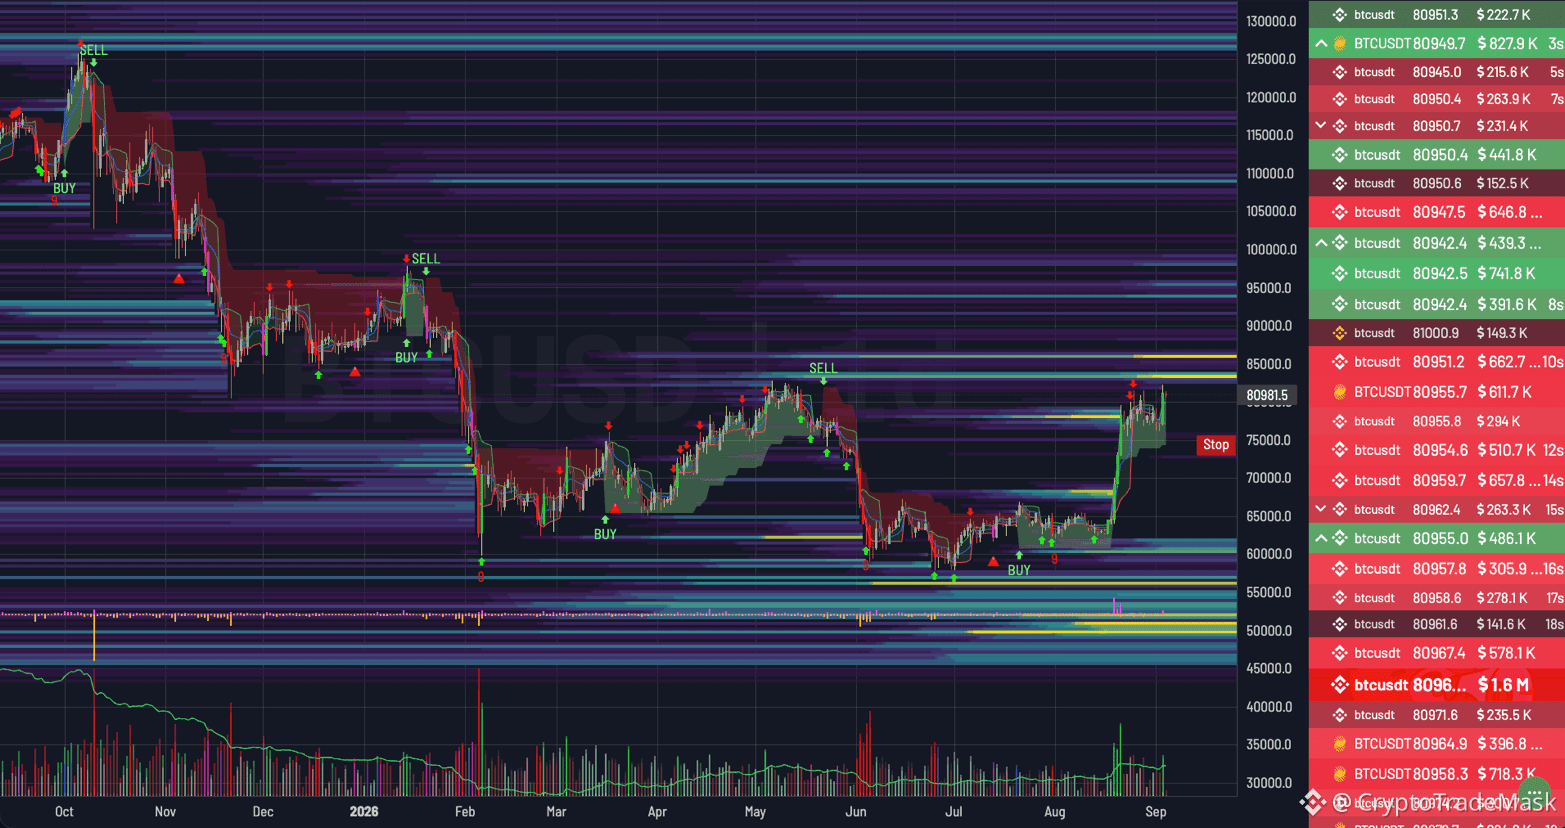
🔥 $BTC /USDT Analyse : Rupture d’impulsion et objectifs vers 100 000$
Le Bitcoin montre une forte dynamique haussière après une longue phase d’accumulation. Le prix sort de manière agressive de la zone 60 000–63 000 $, où les acheteurs ont formé un solide plancher et protègent leurs positions.
📊 Niveaux clés sur le graphique
Résistances :
83 000 – 85 000 $ — Le plus proche sommet local et une zone de forte densité de ventes.
95 000 – 100 000 $ — L’objectif principal psychologique et en termes de volume pour les haussiers.
Supports :
75 000 $ — Le niveau clé d’invalidation du scénario haussier (Stop).
68 000 – 70 000 $ — Zone de support miroir pour un retest.
🚦 Scénarios
🟢 Priorité (Haussier) : Conserver le prix au-dessus de 78 000–80 000 $ ouvre une voie directe vers la rupture de 85 000 $ et un mouvement supplémentaire vers 100 000 $.
🔴 Alternative (Correctionnelle) : En cas de rejet de 85 000 $, un repli local vers 75 000–68 000 $ est attendu afin d’éliminer la liquidité avant une nouvelle vague de croissance.
⚠️ Conclusion : L’initiative est entièrement du côté des acheteurs. Tant que le prix reste maintenu au-dessus de 75 000 $, chaque baisse locale est considérée comme un point potentiel pour la poursuite de la tendance.
{future}(BTCUSDT)
#cryptotradingpro #BTC
🔥 $BTC /USDT Analyse : Rupture d’impulsion et objectifs vers 100 000$
Le Bitcoin montre une forte dynamique haussière après une longue phase d’accumulation. Le prix sort de manière agressive de la zone 60 000–63 000 $, où les acheteurs ont formé un solide plancher et protègent leurs positions.
📊 Niveaux clés sur le graphique
Résistances :
83 000 – 85 000 $ — Le plus proche sommet local et une zone de forte densité de ventes.
95 000 – 100 000 $ — L’objectif principal psychologique et en termes de volume pour les haussiers.
Supports :
75 000 $ — Le niveau clé d’invalidation du scénario haussier (Stop).
68 000 – 70 000 $ — Zone de support miroir pour un retest.
🚦 Scénarios
🟢 Priorité (Haussier) : Conserver le prix au-dessus de 78 000–80 000 $ ouvre une voie directe vers la rupture de 85 000 $ et un mouvement supplémentaire vers 100 000 $.
🔴 Alternative (Correctionnelle) : En cas de rejet de 85 000 $, un repli local vers 75 000–68 000 $ est attendu afin d’éliminer la liquidité avant une nouvelle vague de croissance.
⚠️ Conclusion : L’initiative est entièrement du côté des acheteurs. Tant que le prix reste maintenu au-dessus de 75 000 $, chaque baisse locale est considérée comme un point potentiel pour la poursuite de la tendance.
🔥 $BTC /USDT Analyse : Rupture d’impulsion et objectifs vers 100 000$
Le Bitcoin montre une forte dynamique haussière après une longue phase d’accumulation. Le prix sort de manière agressive de la zone 60 000–63 000 $, où les acheteurs ont formé un solide plancher et protègent leurs positions.
📊 Niveaux clés sur le graphique
Résistances :
83 000 – 85 000 $ — Le plus proche sommet local et une zone de forte densité de ventes.
95 000 – 100 000 $ — L’objectif principal psychologique et en termes de volume pour les haussiers.
Supports :
75 000 $ — Le niveau clé d’invalidation du scénario haussier (Stop).
68 000 – 70 000 $ — Zone de support miroir pour un retest.
🚦 Scénarios
🟢 Priorité (Haussier) : Conserver le prix au-dessus de 78 000–80 000 $ ouvre une voie directe vers la rupture de 85 000 $ et un mouvement supplémentaire vers 100 000 $.
🔴 Alternative (Correctionnelle) : En cas de rejet de 85 000 $, un repli local vers 75 000–68 000 $ est attendu afin d’éliminer la liquidité avant une nouvelle vague de croissance.
⚠️ Conclusion : L’initiative est entièrement du côté des acheteurs. Tant que le prix reste maintenu au-dessus de 75 000 $, chaque baisse locale est considérée comme un point potentiel pour la poursuite de la tendance.
1
133
#cryptotradingpro #BTC
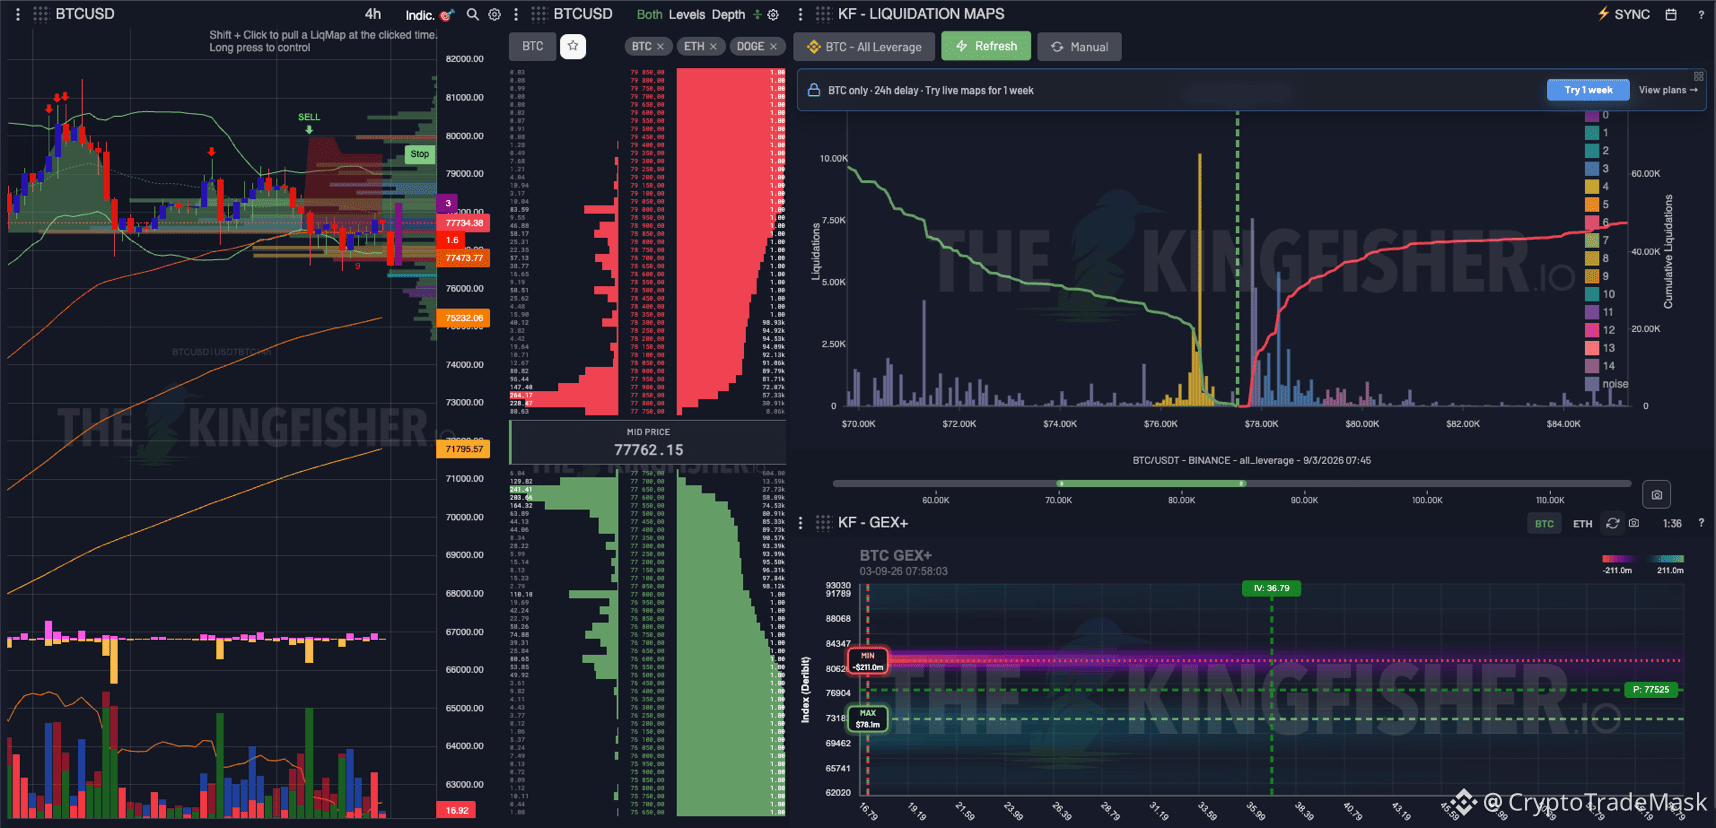
📊 $BTC /USD : Aperçu de la liquidité et de l’exposition gamma.
Le prix actuel du Bitcoin est bloqué dans la fourchette de 77 700 $ - 77 800 $. J’ai analysé les métriques Kingfisher (4H, carte des liquidations et GEX+) pour comprendre où le teneur de marché dirigera le prix ensuite.
1️⃣ Liquidité et cascades de stops (carte des liquidations)
Aimant inférieur (76 500 $ - 77 000 $) : Sous le prix actuel, un « pic jaune » distinct s’est formé : c’est un mur dense de liquidations longues. C’est la cible la plus proche et la plus attrayante pour la suppression de liquidité locale (sweep).
Bassin supérieur (78 000 $ - 79 500 $) : Il existe une cascade de liquidations courtes au-dessus, mais elle est plus floue.
2️⃣ Exposition gamma (GEX+)
Niveau zéro / minimum : ~80 028 $
Niveau maximum : ~73 184 $
Le prix évolue sous la zone neutre du gamma des options, ce qui maintient une volatilité accrue et le risque d’un squeeze à la baisse.
3️⃣ Profil de volume
Le volume principal des échanges est fixé dans la fourchette de 77 000 $ - 78 500 $. Désormais, nous avons une zone de consolidation plate classique.
🚦 Scénarios de mouvement principaux :
Priorité (collecte de liquidité locale - croissance) :
🔴 J’attends un débordement vers la zone de 76 500 $ - 76 800 $ afin de retirer les « épaules ». S’il y a un rachat rapide et une réaction de l’acheteur, le chemin vers un retournement en direction de 78 500 $ - 79 200 $ s’ouvrira.
🟢 Alternative (momentum haussier) :
Le maintien des niveaux actuels et une consolidation confiante au-dessus de 78 200 $ déclencheront un test de la résistance clé située entre 79 500 $ – 80 000 $.
⚠️ Résumé : Prendre une position longue depuis les niveaux actuels est dangereux en raison du risque d’un « pin » jusqu’à 76 500 $. Il est optimal de chercher des configurations soit après la suppression de la liquidité inférieure, soit après consolidation au-dessus de 78 200 $.
{future}(BTCUSDT)
#cryptotradingpro #BTC
📊 $BTC /USD : Aperçu de la liquidité et de l’exposition gamma.
Le prix actuel du Bitcoin est bloqué dans la fourchette de 77 700 $ - 77 800 $. J’ai analysé les métriques Kingfisher (4H, carte des liquidations et GEX+) pour comprendre où le teneur de marché dirigera le prix ensuite.
1️⃣ Liquidité et cascades de stops (carte des liquidations)
Aimant inférieur (76 500 $ - 77 000 $) : Sous le prix actuel, un « pic jaune » distinct s’est formé : c’est un mur dense de liquidations longues. C’est la cible la plus proche et la plus attrayante pour la suppression de liquidité locale (sweep).
Bassin supérieur (78 000 $ - 79 500 $) : Il existe une cascade de liquidations courtes au-dessus, mais elle est plus floue.
2️⃣ Exposition gamma (GEX+)
Niveau zéro / minimum : ~80 028 $
Niveau maximum : ~73 184 $
Le prix évolue sous la zone neutre du gamma des options, ce qui maintient une volatilité accrue et le risque d’un squeeze à la baisse.
3️⃣ Profil de volume
Le volume principal des échanges est fixé dans la fourchette de 77 000 $ - 78 500 $. Désormais, nous avons une zone de consolidation plate classique.
🚦 Scénarios de mouvement principaux :
Priorité (collecte de liquidité locale - croissance) :
🔴 J’attends un débordement vers la zone de 76 500 $ - 76 800 $ afin de retirer les « épaules ». S’il y a un rachat rapide et une réaction de l’acheteur, le chemin vers un retournement en direction de 78 500 $ - 79 200 $ s’ouvrira.
🟢 Alternative (momentum haussier) :
Le maintien des niveaux actuels et une consolidation confiante au-dessus de 78 200 $ déclencheront un test de la résistance clé située entre 79 500 $ – 80 000 $.
⚠️ Résumé : Prendre une position longue depuis les niveaux actuels est dangereux en raison du risque d’un « pin » jusqu’à 76 500 $. Il est optimal de chercher des configurations soit après la suppression de la liquidité inférieure, soit après consolidation au-dessus de 78 200 $.
📊 $BTC /USD : Aperçu de la liquidité et de l’exposition gamma.
Le prix actuel du Bitcoin est bloqué dans la fourchette de 77 700 $ - 77 800 $. J’ai analysé les métriques Kingfisher (4H, carte des liquidations et GEX+) pour comprendre où le teneur de marché dirigera le prix ensuite.
1️⃣ Liquidité et cascades de stops (carte des liquidations)
Aimant inférieur (76 500 $ - 77 000 $) : Sous le prix actuel, un « pic jaune » distinct s’est formé : c’est un mur dense de liquidations longues. C’est la cible la plus proche et la plus attrayante pour la suppression de liquidité locale (sweep).
Bassin supérieur (78 000 $ - 79 500 $) : Il existe une cascade de liquidations courtes au-dessus, mais elle est plus floue.
2️⃣ Exposition gamma (GEX+)
Niveau zéro / minimum : ~80 028 $
Niveau maximum : ~73 184 $
Le prix évolue sous la zone neutre du gamma des options, ce qui maintient une volatilité accrue et le risque d’un squeeze à la baisse.
3️⃣ Profil de volume
Le volume principal des échanges est fixé dans la fourchette de 77 000 $ - 78 500 $. Désormais, nous avons une zone de consolidation plate classique.
🚦 Scénarios de mouvement principaux :
Priorité (collecte de liquidité locale - croissance) :
🔴 J’attends un débordement vers la zone de 76 500 $ - 76 800 $ afin de retirer les « épaules ». S’il y a un rachat rapide et une réaction de l’acheteur, le chemin vers un retournement en direction de 78 500 $ - 79 200 $ s’ouvrira.
🟢 Alternative (momentum haussier) :
Le maintien des niveaux actuels et une consolidation confiante au-dessus de 78 200 $ déclencheront un test de la résistance clé située entre 79 500 $ – 80 000 $.
⚠️ Résumé : Prendre une position longue depuis les niveaux actuels est dangereux en raison du risque d’un « pin » jusqu’à 76 500 $. Il est optimal de chercher des configurations soit après la suppression de la liquidité inférieure, soit après consolidation au-dessus de 78 200 $.
1
313

·
--
🟢 $SOMI — LONG SETUP 🚀
$SOMI tente de mettre en place une configuration de reprise alors que les acheteurs cherchent à reprendre le contrôle après une forte baisse de -14,66 %. L’entrée long prévue se situe au-dessus du prix de marché actuel, donc une confirmation d’un rebond vers la zone d’entrée est importante avant d’envisager les objectifs à la hausse.
📌 ENTRÉE LONGUE : 0.1210
🎯 TP1 : 0.1330
🎯 TP2 : 0.1380
🎯 TP3 : 0.1450
🛑 STOP LOSS : 0.1200
📊 Prix actuel : 0.1146
💹 Marché : SOMIUSDT Perpétuel
Si les acheteurs reprennent et maintiennent la zone 0.1210, la structure de reprise pourrait se renforcer et ouvrir la voie vers TP1, TP2 et potentiellement TP3. D’ici là, la patience et la confirmation sont essentielles.
⚠️ Gestion du risque : Une baisse récente marquée signifie que la volatilité pourrait rester élevée. Utilisez un dimensionnement de position approprié, respectez le stop-loss et ne tradez qu’avec un capital à risque. Ceci n’est pas un conseil financier.
#SOMI #SOMIUSDT #Crypto #cryptotradingpro #LongSetup #BinancePizzaVN #Futures_signal
🟢 $SOMI — LONG SETUP 🚀
$SOMI tente de mettre en place une configuration de reprise alors que les acheteurs cherchent à reprendre le contrôle après une forte baisse de -14,66 %. L’entrée long prévue se situe au-dessus du prix de marché actuel, donc une confirmation d’un rebond vers la zone d’entrée est importante avant d’envisager les objectifs à la hausse.
📌 ENTRÉE LONGUE : 0.1210
🎯 TP1 : 0.1330
🎯 TP2 : 0.1380
🎯 TP3 : 0.1450
🛑 STOP LOSS : 0.1200
📊 Prix actuel : 0.1146
💹 Marché : SOMIUSDT Perpétuel
Si les acheteurs reprennent et maintiennent la zone 0.1210, la structure de reprise pourrait se renforcer et ouvrir la voie vers TP1, TP2 et potentiellement TP3. D’ici là, la patience et la confirmation sont essentielles.
⚠️ Gestion du risque : Une baisse récente marquée signifie que la volatilité pourrait rester élevée. Utilisez un dimensionnement de position approprié, respectez le stop-loss et ne tradez qu’avec un capital à risque. Ceci n’est pas un conseil financier.
#SOMI #SOMIUSDT #Crypto #cryptotradingpro #LongSetup #BinancePizzaVN #Futures_signal
$SOMI tente de mettre en place une configuration de reprise alors que les acheteurs cherchent à reprendre le contrôle après une forte baisse de -14,66 %. L’entrée long prévue se situe au-dessus du prix de marché actuel, donc une confirmation d’un rebond vers la zone d’entrée est importante avant d’envisager les objectifs à la hausse.
📌 ENTRÉE LONGUE : 0.1210
🎯 TP1 : 0.1330
🎯 TP2 : 0.1380
🎯 TP3 : 0.1450
🛑 STOP LOSS : 0.1200
📊 Prix actuel : 0.1146
💹 Marché : SOMIUSDT Perpétuel
Si les acheteurs reprennent et maintiennent la zone 0.1210, la structure de reprise pourrait se renforcer et ouvrir la voie vers TP1, TP2 et potentiellement TP3. D’ici là, la patience et la confirmation sont essentielles.
⚠️ Gestion du risque : Une baisse récente marquée signifie que la volatilité pourrait rester élevée. Utilisez un dimensionnement de position approprié, respectez le stop-loss et ne tradez qu’avec un capital à risque. Ceci n’est pas un conseil financier.
#SOMI #SOMIUSDT #Crypto #cryptotradingpro #LongSetup #BinancePizzaVN #Futures_signal
111
·
--
🔴 $USELESS — CONFIG COURTE 📉
$USELESS a livré un énorme mouvement vertical, gagnant +46,76 %, mais la forte reprise montre désormais des signes d’essoufflement. Après une hausse aussi agressive, les vendeurs pourraient intervenir et déclencher un retournement à court terme si l’élan haussier commence à faiblir.
📌 ENTRÉE SHORT : 0.1030
🎯 TP1 : 0.0960
🎯 TP2 : 0.0910
🎯 TP3 : 0.0850
🛑 STOP LOSS : 0.1185
💰 Prix actuel : 0.10109
📊 Marché : USELESSUSDT Perpétuel
Si $USELESS ne parvient pas à maintenir les récents plus hauts et casse à la baisse depuis la zone actuelle, les objectifs baissiers pourraient redevenir pertinents. La confirmation est importante, surtout après une reprise à forte volatilité.
⚠️ Gestion du risque : La forte volatilité peut provoquer des variations de prix rapides. Utilisez un stop-loss strict, gérez soigneusement la taille de position et ne tradez qu’avec du capital de risque. Ceci n’est pas un conseil financier.
#USELESS #USELESSUSDT #Crypto #cryptotradingpro #ShortSetups #BinancePizzaVN #Futures
🔴 $USELESS — CONFIG COURTE 📉
$USELESS a livré un énorme mouvement vertical, gagnant +46,76 %, mais la forte reprise montre désormais des signes d’essoufflement. Après une hausse aussi agressive, les vendeurs pourraient intervenir et déclencher un retournement à court terme si l’élan haussier commence à faiblir.
📌 ENTRÉE SHORT : 0.1030
🎯 TP1 : 0.0960
🎯 TP2 : 0.0910
🎯 TP3 : 0.0850
🛑 STOP LOSS : 0.1185
💰 Prix actuel : 0.10109
📊 Marché : USELESSUSDT Perpétuel
Si $USELESS ne parvient pas à maintenir les récents plus hauts et casse à la baisse depuis la zone actuelle, les objectifs baissiers pourraient redevenir pertinents. La confirmation est importante, surtout après une reprise à forte volatilité.
⚠️ Gestion du risque : La forte volatilité peut provoquer des variations de prix rapides. Utilisez un stop-loss strict, gérez soigneusement la taille de position et ne tradez qu’avec du capital de risque. Ceci n’est pas un conseil financier.
#USELESS #USELESSUSDT #Crypto #cryptotradingpro #ShortSetups #BinancePizzaVN #Futures
$USELESS a livré un énorme mouvement vertical, gagnant +46,76 %, mais la forte reprise montre désormais des signes d’essoufflement. Après une hausse aussi agressive, les vendeurs pourraient intervenir et déclencher un retournement à court terme si l’élan haussier commence à faiblir.
📌 ENTRÉE SHORT : 0.1030
🎯 TP1 : 0.0960
🎯 TP2 : 0.0910
🎯 TP3 : 0.0850
🛑 STOP LOSS : 0.1185
💰 Prix actuel : 0.10109
📊 Marché : USELESSUSDT Perpétuel
Si $USELESS ne parvient pas à maintenir les récents plus hauts et casse à la baisse depuis la zone actuelle, les objectifs baissiers pourraient redevenir pertinents. La confirmation est importante, surtout après une reprise à forte volatilité.
⚠️ Gestion du risque : La forte volatilité peut provoquer des variations de prix rapides. Utilisez un stop-loss strict, gérez soigneusement la taille de position et ne tradez qu’avec du capital de risque. Ceci n’est pas un conseil financier.
#USELESS #USELESSUSDT #Crypto #cryptotradingpro #ShortSetups #BinancePizzaVN #Futures
57

·
--
Baissier
📊 XAUT/USDT — ANALYSE 4H | OR
D’après mon analyse technique, je m’attends à un retracement avant le prochain mouvement majeur.
🔹 Prix actuel : ~4,430
🔹 Retracement / Zone d’offre : 4,480 – 4,555
🔹 Prochaine zone de réaction : 4,350 – 4,400
🔹 Support majeur : 4,324
Le prix a déjà montré de la faiblesse après avoir rejeté les niveaux plus élevés. Mon idée est d’observer comment le prix réagit s’il retrace et revient dans la zone 4,480–4,555.
Si nous obtenons un rejet clair depuis cette zone, je chercherai une continuation vers 4,400 → 4,350 → 4,324.
⚠️ Ceci est mon analyse, pas une prédiction garantie. J’attendrai une confirmation avant de prendre une quelconque position. Gérez toujours votre risque.
Qu’en pensez-vous ? 👀📉
XAUT va-t-il retracer dans la zone avant de continuer plus bas ?
#cryptotradingpro #TechnicalAnalysiss #BinanceSquare $XAUT
{spot}(XAUTUSDT)
📊 XAUT/USDT — ANALYSE 4H | OR
D’après mon analyse technique, je m’attends à un retracement avant le prochain mouvement majeur.
🔹 Prix actuel : ~4,430
🔹 Retracement / Zone d’offre : 4,480 – 4,555
🔹 Prochaine zone de réaction : 4,350 – 4,400
🔹 Support majeur : 4,324
Le prix a déjà montré de la faiblesse après avoir rejeté les niveaux plus élevés. Mon idée est d’observer comment le prix réagit s’il retrace et revient dans la zone 4,480–4,555.
Si nous obtenons un rejet clair depuis cette zone, je chercherai une continuation vers 4,400 → 4,350 → 4,324.
⚠️ Ceci est mon analyse, pas une prédiction garantie. J’attendrai une confirmation avant de prendre une quelconque position. Gérez toujours votre risque.
Qu’en pensez-vous ? 👀📉
XAUT va-t-il retracer dans la zone avant de continuer plus bas ?
#cryptotradingpro #TechnicalAnalysiss #BinanceSquare $XAUT
D’après mon analyse technique, je m’attends à un retracement avant le prochain mouvement majeur.
🔹 Prix actuel : ~4,430
🔹 Retracement / Zone d’offre : 4,480 – 4,555
🔹 Prochaine zone de réaction : 4,350 – 4,400
🔹 Support majeur : 4,324
Le prix a déjà montré de la faiblesse après avoir rejeté les niveaux plus élevés. Mon idée est d’observer comment le prix réagit s’il retrace et revient dans la zone 4,480–4,555.
Si nous obtenons un rejet clair depuis cette zone, je chercherai une continuation vers 4,400 → 4,350 → 4,324.
⚠️ Ceci est mon analyse, pas une prédiction garantie. J’attendrai une confirmation avant de prendre une quelconque position. Gérez toujours votre risque.
Qu’en pensez-vous ? 👀📉
XAUT va-t-il retracer dans la zone avant de continuer plus bas ?
#cryptotradingpro #TechnicalAnalysiss #BinanceSquare $XAUT
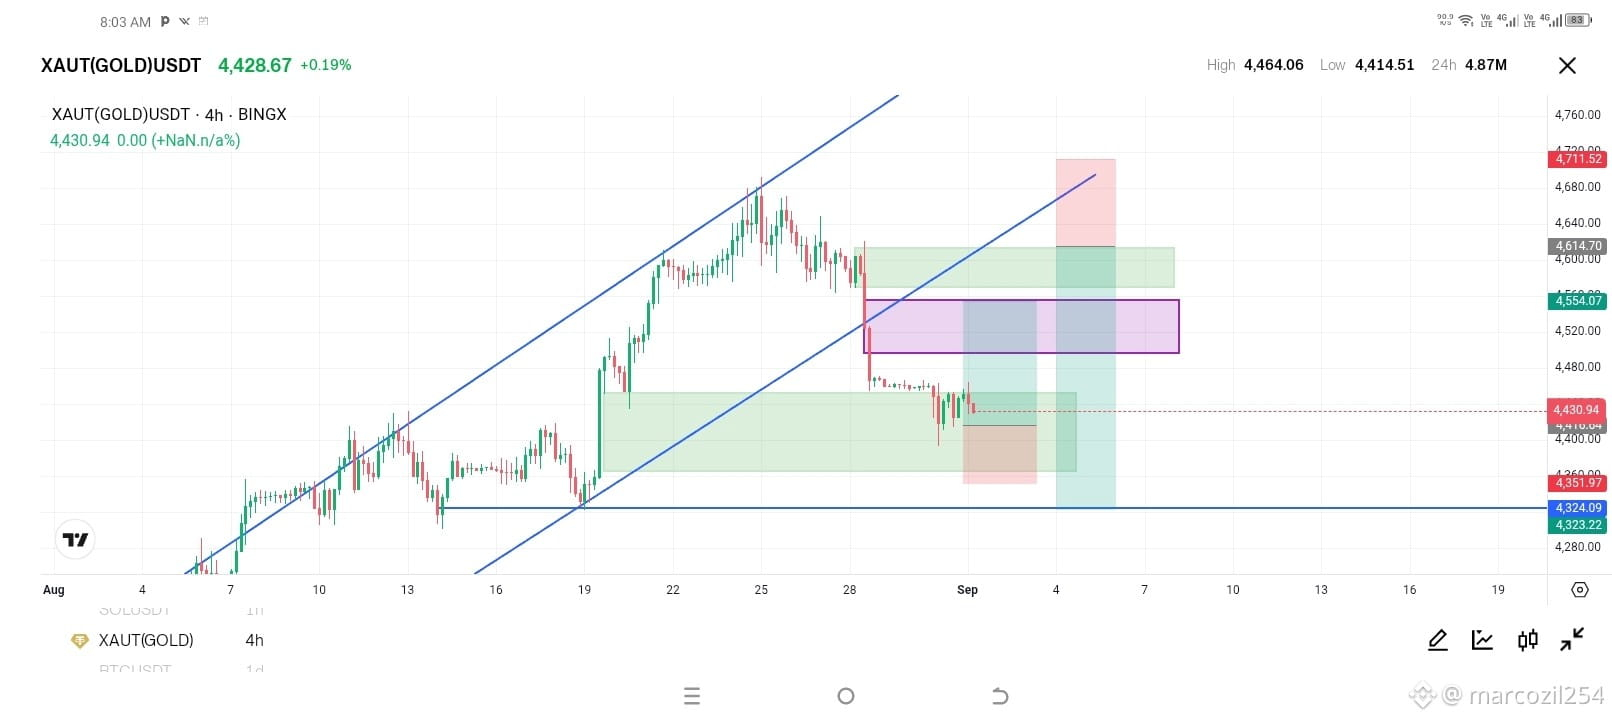
97

📊 $PORTAL | CONFIGURATION COURTE
📍 Zone d’entrée : 0,01416 $ – 0,01460 $
🎯 Objectifs :
TP1 : 0,01402 $
TP2 : 0,01331 $
TP3 : 0,01287 $
🛑 Stop Loss : 0,01560 $
💹 Tradez cette configuration directement depuis ici sur Binance.
{spot}(PORTALUSDT)
📈 Perspectives de trading :
PORTAL présente une opportunité de vente à découvert depuis la zone d’entrée actuelle, avec une configuration favorisant un mouvement vers des niveaux plus bas. Restez discipliné et gérez le risque.
🔔 Suivez-moi pour des configurations de trading quotidiennes, des signaux en temps réel et des analyses du marché — restez en avance sur le prochain mouvement !
⚠️ Avertissement : Ceci ne constitue pas un conseil financier. Faites toujours vos propres recherches (DYOR) et tradez de manière responsable.
#PORTALL #PORTALUSDT #ShortSetup #cryptotradingpro #TradeIdeas
📊 $PORTAL | CONFIGURATION COURTE
📍 Zone d’entrée : 0,01416 $ – 0,01460 $
🎯 Objectifs :
TP1 : 0,01402 $
TP2 : 0,01331 $
TP3 : 0,01287 $
🛑 Stop Loss : 0,01560 $
💹 Tradez cette configuration directement depuis ici sur Binance.
📈 Perspectives de trading :
PORTAL présente une opportunité de vente à découvert depuis la zone d’entrée actuelle, avec une configuration favorisant un mouvement vers des niveaux plus bas. Restez discipliné et gérez le risque.
🔔 Suivez-moi pour des configurations de trading quotidiennes, des signaux en temps réel et des analyses du marché — restez en avance sur le prochain mouvement !
⚠️ Avertissement : Ceci ne constitue pas un conseil financier. Faites toujours vos propres recherches (DYOR) et tradez de manière responsable.
#PORTALL #PORTALUSDT #ShortSetup #cryptotradingpro #TradeIdeas
📍 Zone d’entrée : 0,01416 $ – 0,01460 $
🎯 Objectifs :
TP1 : 0,01402 $
TP2 : 0,01331 $
TP3 : 0,01287 $
🛑 Stop Loss : 0,01560 $
💹 Tradez cette configuration directement depuis ici sur Binance.
📈 Perspectives de trading :
PORTAL présente une opportunité de vente à découvert depuis la zone d’entrée actuelle, avec une configuration favorisant un mouvement vers des niveaux plus bas. Restez discipliné et gérez le risque.
🔔 Suivez-moi pour des configurations de trading quotidiennes, des signaux en temps réel et des analyses du marché — restez en avance sur le prochain mouvement !
⚠️ Avertissement : Ceci ne constitue pas un conseil financier. Faites toujours vos propres recherches (DYOR) et tradez de manière responsable.
#PORTALL #PORTALUSDT #ShortSetup #cryptotradingpro #TradeIdeas

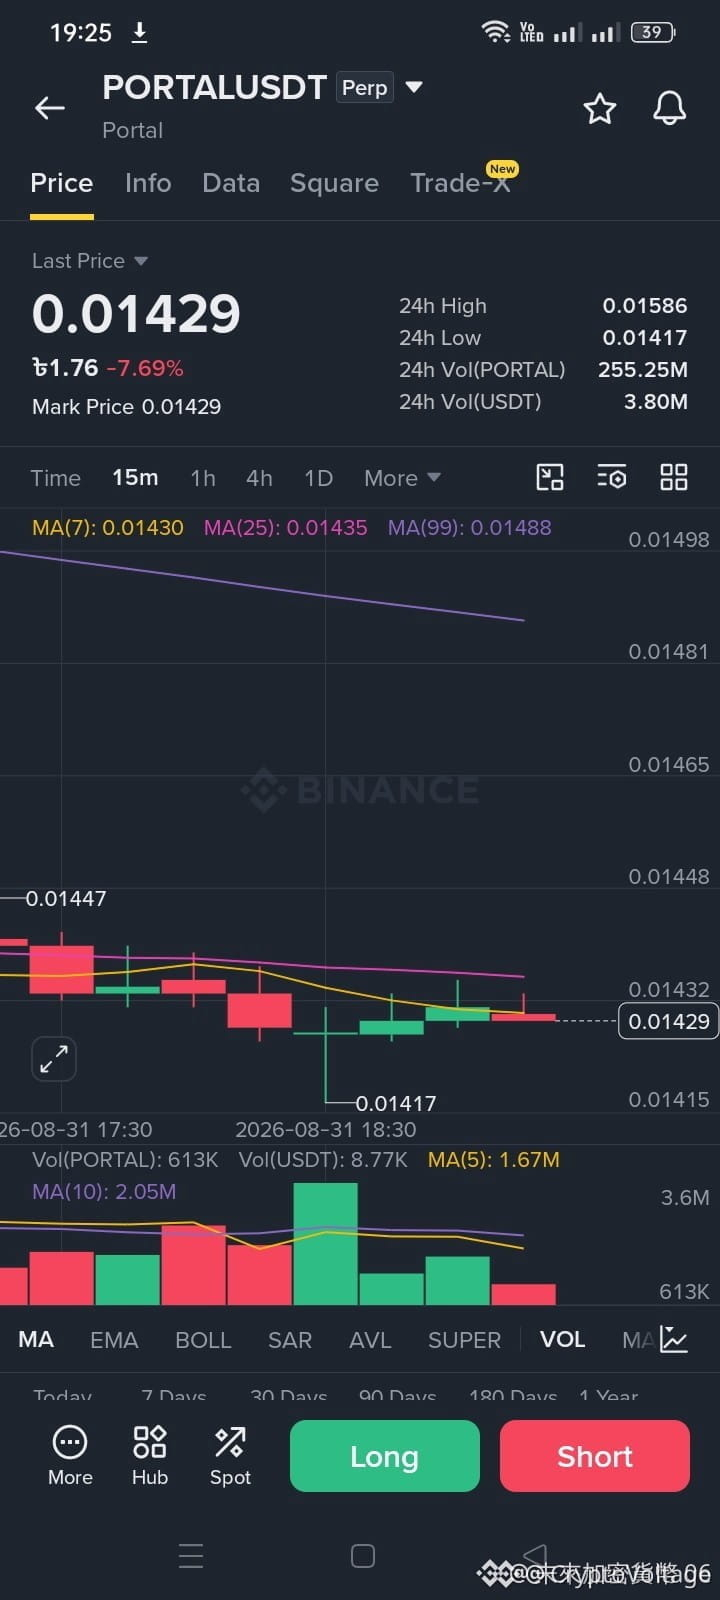
11
Connectez-vous pour découvrir plus de contenu
Rejoignez la communauté mondiale des adeptes de cryptomonnaies sur Binance Square
⚡️ Suviez les dernières informations importantes sur les cryptomonnaies.
💬 Jugé digne de confiance par la plus grande plateforme d’échange de cryptomonnaies au monde.
👍 Découvrez les connaissances que partagent les créateurs vérifiés.
Adresse e-mail/Nº de téléphone
Sujets d’actualité
1
#SECReceivesGrayscaleLitecoinTrustETFFiling
48,296 vues
975 mentions
2
#ClarityActFacesProceduralVoteSept15
167,253 vues
1,914 mentions
3
#US10YearTreasuryYieldNears5%
56,964 vues
1,035 mentions
4
#CryptoLiquidations$674MIn24H
11,739 vues
165 mentions
5
#TokenizedStockHoldersUp619.1%
54,788 vues
890 mentions
6
#RevolutConfirmsFakeGovEmailDataBreach
85,624 vues
1,186 mentions
7
#CanadaOSFISaysTokenizedDepositsEqualTraditionalDeposits
4,990 vues
99 mentions
8
#USBankCompletesCrossBorderPaymentPilotOnStellar
72,735 vues
1,155 mentions
9
#NvidiaInTalksToInvestUpTo$10BInAnthropicIPO
4,989 vues
86 mentions
10
#EtherRalliesAsBearishBetsLiquidate
113,574 vues
1,448 mentions