

#colecolen
colecolen
2.5M vues
3,609 mentions
Populaire
Récents

BCH & UNI: CME EXPANDS CRYPTO DERIVATIVES FROM OCTOBER 19
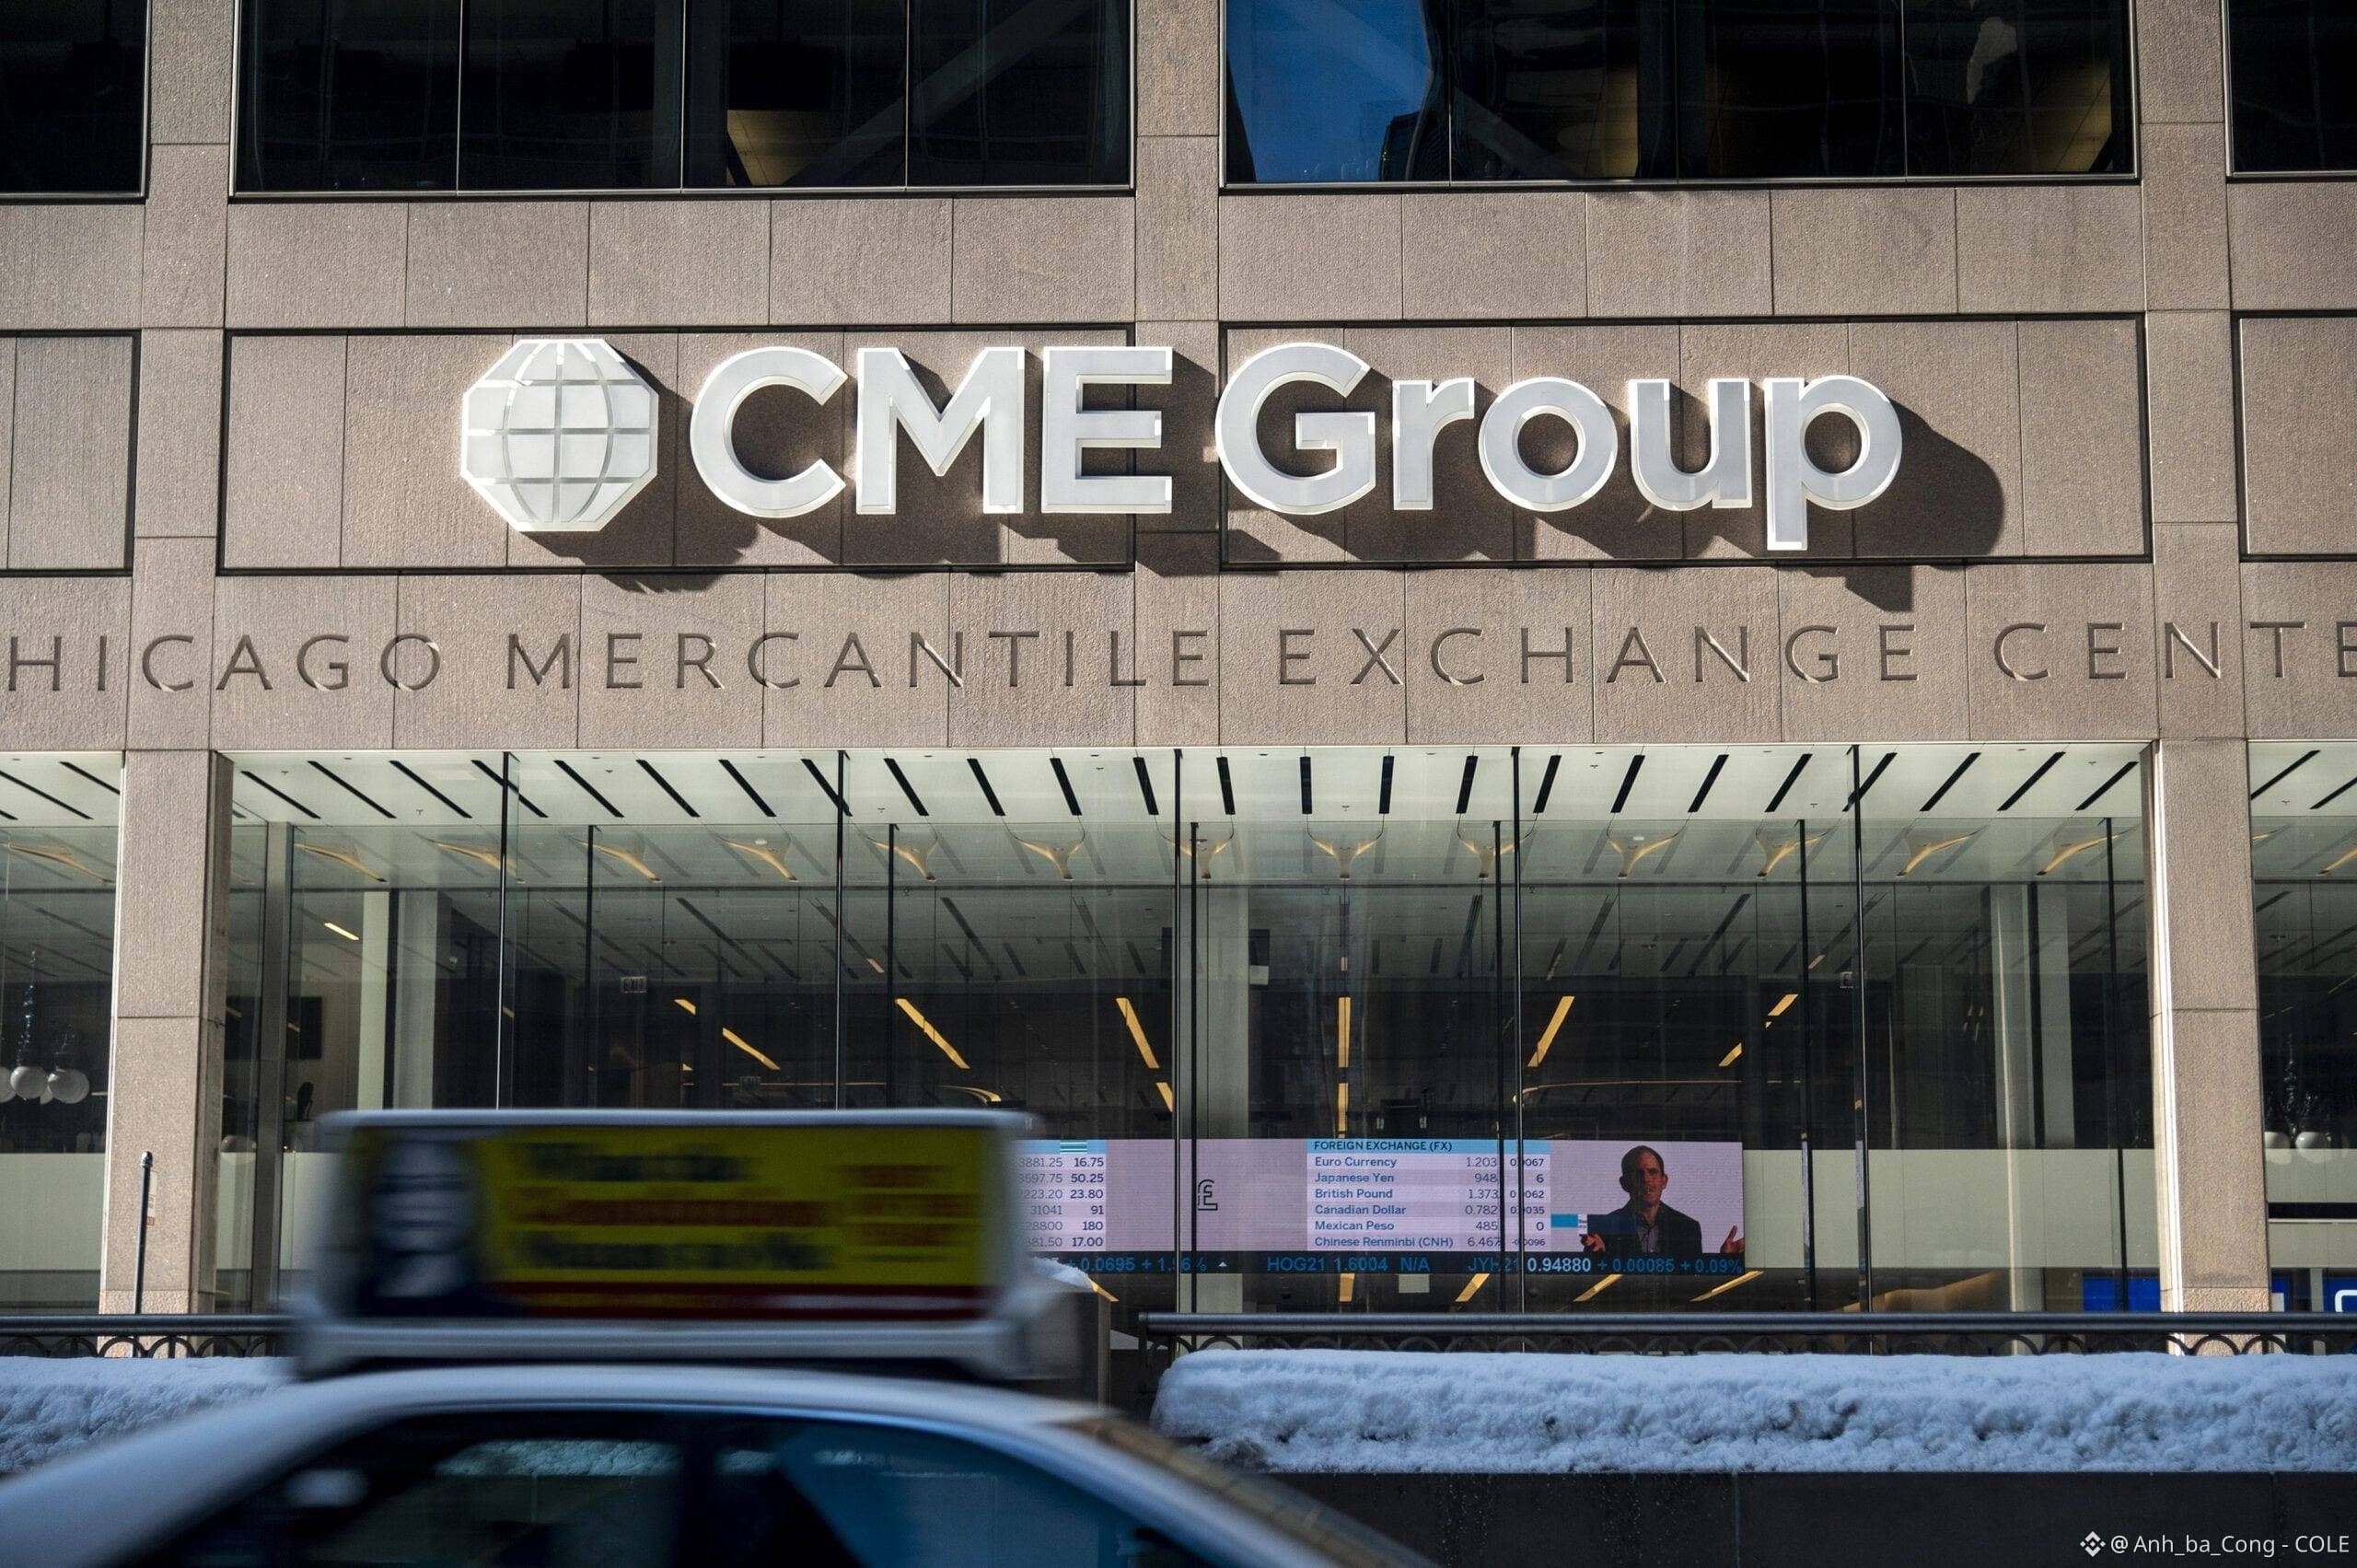
CME Group plans to launch Bitcoin Cash (BCH) and Uniswap (UNI) futures on October 19, pending regulatory review. Each asset will have larger and Micro contracts: BCH at 250/25 BCH and UNI at 10,000/1,000 UNI.
My take: the important point is not simply adding two tickers, but bringing BCH and UNI deeper into regulated derivatives infrastructure. When institutions need to hedge, manage leverage or price risk without trading the underlying asset directly, futures create another channel for capital access and liquidity. CME reported H1 2026 crypto futures and options ADV of 279,800 contracts, or USD 8.3 billion notional, while average open interest reached 264,600 contracts, or USD 15.4 billion. That provides meaningful demand infrastructure for further expansion.
I would not treat the announcement as an automatic bullish signal for BCH or UNI. What matters more to me is volume and open interest after launch, because those figures will show whether real derivatives demand arrives. Do you think BCH and UNI can attract enough institutional flow to make a meaningful difference? If this logic makes sense, drop a follow for more market breakdowns.
Please do your own research carefully before making any transactions (DYOR). $BCH $UNI #Colecolen $TAKE
{future}(TAKEUSDT)
{future}(UNIUSDT)
{future}(BCHUSDT)
BCH & UNI: CME EXPANDS CRYPTO DERIVATIVES FROM OCTOBER 19
CME Group plans to launch Bitcoin Cash (BCH) and Uniswap (UNI) futures on October 19, pending regulatory review. Each asset will have larger and Micro contracts: BCH at 250/25 BCH and UNI at 10,000/1,000 UNI.
My take: the important point is not simply adding two tickers, but bringing BCH and UNI deeper into regulated derivatives infrastructure. When institutions need to hedge, manage leverage or price risk without trading the underlying asset directly, futures create another channel for capital access and liquidity. CME reported H1 2026 crypto futures and options ADV of 279,800 contracts, or USD 8.3 billion notional, while average open interest reached 264,600 contracts, or USD 15.4 billion. That provides meaningful demand infrastructure for further expansion.
I would not treat the announcement as an automatic bullish signal for BCH or UNI. What matters more to me is volume and open interest after launch, because those figures will show whether real derivatives demand arrives. Do you think BCH and UNI can attract enough institutional flow to make a meaningful difference? If this logic makes sense, drop a follow for more market breakdowns.
Please do your own research carefully before making any transactions (DYOR). $BCH $UNI #Colecolen $TAKE
CME Group plans to launch Bitcoin Cash (BCH) and Uniswap (UNI) futures on October 19, pending regulatory review. Each asset will have larger and Micro contracts: BCH at 250/25 BCH and UNI at 10,000/1,000 UNI.
My take: the important point is not simply adding two tickers, but bringing BCH and UNI deeper into regulated derivatives infrastructure. When institutions need to hedge, manage leverage or price risk without trading the underlying asset directly, futures create another channel for capital access and liquidity. CME reported H1 2026 crypto futures and options ADV of 279,800 contracts, or USD 8.3 billion notional, while average open interest reached 264,600 contracts, or USD 15.4 billion. That provides meaningful demand infrastructure for further expansion.
I would not treat the announcement as an automatic bullish signal for BCH or UNI. What matters more to me is volume and open interest after launch, because those figures will show whether real derivatives demand arrives. Do you think BCH and UNI can attract enough institutional flow to make a meaningful difference? If this logic makes sense, drop a follow for more market breakdowns.
Please do your own research carefully before making any transactions (DYOR). $BCH $UNI #Colecolen $TAKE
510
DOGE ETF: RECORD WEEKLY INFLOWS AS BITWISE PREPARES TO EXIT
U.S. spot Dogecoin ETFs recorded USD 2.89 million in net inflows for the week ending September 25, their highest weekly total since launch. Notably, the record came just 11 days after Bitwise announced the liquidation of its BWOW fund.
My take: this is an interesting signal of diverging demand for DOGE exposure through ETFs. One product leaving the market does not necessarily mean demand for the underlying asset is disappearing. In fact, Grayscale’s GDOG saw cumulative inflows rise from USD 11.7 million to USD 15.46 million after Bitwise’s announcement, while 21Shares’ TDOG fell from USD 1.63 million to USD 1.03 million. That suggests capital may be concentrating in products receiving stronger market demand rather than leaving DOGE altogether.
Still, the scale remains small: the funds hold only about 0.11% of DOGE’s market value, while U.S. spot Bitcoin ETFs attracted USD 2.39 billion in net inflows during the same week. For DOGE, I’ll watch sustained ETF flows and the funds’ share of total market value before deciding whether to accumulate or stay defensive. Do you think this record flow signals improving demand or simply an unusual week? If this logic makes sense, drop a follow for more market breakdowns.
Please do your own research carefully before making any transactions (DYOR). $DOGE $QNT $INX #Colecolen
{future}(INXUSDT)
{future}(QNTUSDT)
{future}(DOGEUSDT)
DOGE ETF: RECORD WEEKLY INFLOWS AS BITWISE PREPARES TO EXIT
U.S. spot Dogecoin ETFs recorded USD 2.89 million in net inflows for the week ending September 25, their highest weekly total since launch. Notably, the record came just 11 days after Bitwise announced the liquidation of its BWOW fund.
My take: this is an interesting signal of diverging demand for DOGE exposure through ETFs. One product leaving the market does not necessarily mean demand for the underlying asset is disappearing. In fact, Grayscale’s GDOG saw cumulative inflows rise from USD 11.7 million to USD 15.46 million after Bitwise’s announcement, while 21Shares’ TDOG fell from USD 1.63 million to USD 1.03 million. That suggests capital may be concentrating in products receiving stronger market demand rather than leaving DOGE altogether.
Still, the scale remains small: the funds hold only about 0.11% of DOGE’s market value, while U.S. spot Bitcoin ETFs attracted USD 2.39 billion in net inflows during the same week. For DOGE, I’ll watch sustained ETF flows and the funds’ share of total market value before deciding whether to accumulate or stay defensive. Do you think this record flow signals improving demand or simply an unusual week? If this logic makes sense, drop a follow for more market breakdowns.
Please do your own research carefully before making any transactions (DYOR). $DOGE $QNT $INX #Colecolen
U.S. spot Dogecoin ETFs recorded USD 2.89 million in net inflows for the week ending September 25, their highest weekly total since launch. Notably, the record came just 11 days after Bitwise announced the liquidation of its BWOW fund.
My take: this is an interesting signal of diverging demand for DOGE exposure through ETFs. One product leaving the market does not necessarily mean demand for the underlying asset is disappearing. In fact, Grayscale’s GDOG saw cumulative inflows rise from USD 11.7 million to USD 15.46 million after Bitwise’s announcement, while 21Shares’ TDOG fell from USD 1.63 million to USD 1.03 million. That suggests capital may be concentrating in products receiving stronger market demand rather than leaving DOGE altogether.
Still, the scale remains small: the funds hold only about 0.11% of DOGE’s market value, while U.S. spot Bitcoin ETFs attracted USD 2.39 billion in net inflows during the same week. For DOGE, I’ll watch sustained ETF flows and the funds’ share of total market value before deciding whether to accumulate or stay defensive. Do you think this record flow signals improving demand or simply an unusual week? If this logic makes sense, drop a follow for more market breakdowns.
Please do your own research carefully before making any transactions (DYOR). $DOGE $QNT $INX #Colecolen

1
260
·
--
Baissier
BTC: Tests Upper Boundary of Consolidation Wedge Under MA100 – Strategic Breakdown Short Targeting $82,000 Support
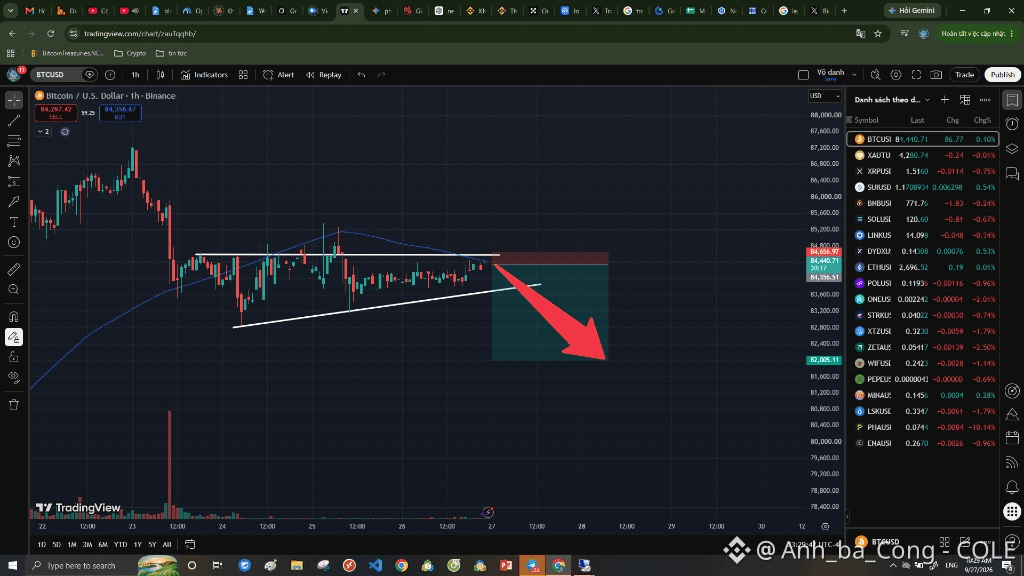
Bitcoin (BTC) is displaying clear bearish reversal signatures on the 1-hour timeframe as its technical relief bounce halts directly at the overhead resistance ceiling of a narrowing consolidation wedge. Following the steep sell-off from the $87,000 peak, recent sluggish price action represents merely a temporary pause before dominant sellers reassert control. Based on visual data from the 1-hour chart , price candles near the $84,440 handle are repeatedly printing upper rejection wicks against the horizontal resistance shelf at $84,800. Significantly, price action remains firmly capped beneath the downward-sloping dynamic MA100 trendline. Diminishing trading volume throughout this consolidation reflects drying buyer momentum, indicating that institutional capital is unwilling to support higher valuations. With buyers lacking the order flow to force a legitimate breakout, prevailing sell-side pressure is primed to break the lower ascending trendline and trigger a sharp downward continuation leg. The optimal trading approach is to initiate Short positions within the $84,400–$84,500 zone. A protective stop-loss parameter should be placed safely above the resistance level at $85,056. The primary strategic take-profit objective targets the prior liquidity base near $82,005, securing an attractive risk-to-reward setup.
Disclaimer: This is not financial advice, DYOR. $BTC $QNT $Q #Colecolen
{future}(QUSDT)
{future}(QNTUSDT)
{future}(BTCUSDT)
BTC: Tests Upper Boundary of Consolidation Wedge Under MA100 – Strategic Breakdown Short Targeting $82,000 Support
Bitcoin (BTC) is displaying clear bearish reversal signatures on the 1-hour timeframe as its technical relief bounce halts directly at the overhead resistance ceiling of a narrowing consolidation wedge. Following the steep sell-off from the $87,000 peak, recent sluggish price action represents merely a temporary pause before dominant sellers reassert control. Based on visual data from the 1-hour chart , price candles near the $84,440 handle are repeatedly printing upper rejection wicks against the horizontal resistance shelf at $84,800. Significantly, price action remains firmly capped beneath the downward-sloping dynamic MA100 trendline. Diminishing trading volume throughout this consolidation reflects drying buyer momentum, indicating that institutional capital is unwilling to support higher valuations. With buyers lacking the order flow to force a legitimate breakout, prevailing sell-side pressure is primed to break the lower ascending trendline and trigger a sharp downward continuation leg. The optimal trading approach is to initiate Short positions within the $84,400–$84,500 zone. A protective stop-loss parameter should be placed safely above the resistance level at $85,056. The primary strategic take-profit objective targets the prior liquidity base near $82,005, securing an attractive risk-to-reward setup.
Disclaimer: This is not financial advice, DYOR. $BTC $QNT $Q #Colecolen
Bitcoin (BTC) is displaying clear bearish reversal signatures on the 1-hour timeframe as its technical relief bounce halts directly at the overhead resistance ceiling of a narrowing consolidation wedge. Following the steep sell-off from the $87,000 peak, recent sluggish price action represents merely a temporary pause before dominant sellers reassert control. Based on visual data from the 1-hour chart , price candles near the $84,440 handle are repeatedly printing upper rejection wicks against the horizontal resistance shelf at $84,800. Significantly, price action remains firmly capped beneath the downward-sloping dynamic MA100 trendline. Diminishing trading volume throughout this consolidation reflects drying buyer momentum, indicating that institutional capital is unwilling to support higher valuations. With buyers lacking the order flow to force a legitimate breakout, prevailing sell-side pressure is primed to break the lower ascending trendline and trigger a sharp downward continuation leg. The optimal trading approach is to initiate Short positions within the $84,400–$84,500 zone. A protective stop-loss parameter should be placed safely above the resistance level at $85,056. The primary strategic take-profit objective targets the prior liquidity base near $82,005, securing an attractive risk-to-reward setup.
Disclaimer: This is not financial advice, DYOR. $BTC $QNT $Q #Colecolen
543
Partiellement vrai
HYPE: HYPERLIQUID IS BURNING TOKENS AT NEARLY USD 1M A DAY
According to Onchain Lens, Hyperliquid bought and burned 10,400 HYPE in 24 hours at a volume-weighted average price of USD 91.97, worth about USD 956,800. Total HYPE burned has reached 48.96 million tokens, equal to 4.9% of the maximum supply. Meanwhile, Hyperliquid reportedly generated USD 58.27 million in revenue over the past 30 days.
My take: the key point is not the 10,400 HYPE alone, but the mechanism linking economic activity to lower token supply. If revenue remains strong and part of that value continues to fund HYPE buybacks and burns, circulating supply could face gradual downward pressure. Still, a token burn does not automatically create price appreciation. The more important variables are revenue durability, real protocol demand and the scale of capital flows. I see this as a useful signal for tracking the link between Hyperliquid’s business activity and HYPE tokenomics.
For HYPE, I would watch burn velocity against revenue and liquidity before deciding whether to accumulate or stay defensive. If cash flow and protocol activity keep expanding, the supply-reduction narrative becomes more relevant. Do you think this buy-and-burn mechanism can make a meaningful difference for HYPE over the long term? If this logic makes sense, drop a follow for more market breakdowns.
Please do your own research carefully before making any transactions (DYOR). $HYPE #Colecolen $QNT $Q
{future}(QUSDT)
{future}(QNTUSDT)
{future}(HYPEUSDT)
HYPE: HYPERLIQUID IS BURNING TOKENS AT NEARLY USD 1M A DAY
According to Onchain Lens, Hyperliquid bought and burned 10,400 HYPE in 24 hours at a volume-weighted average price of USD 91.97, worth about USD 956,800. Total HYPE burned has reached 48.96 million tokens, equal to 4.9% of the maximum supply. Meanwhile, Hyperliquid reportedly generated USD 58.27 million in revenue over the past 30 days.
My take: the key point is not the 10,400 HYPE alone, but the mechanism linking economic activity to lower token supply. If revenue remains strong and part of that value continues to fund HYPE buybacks and burns, circulating supply could face gradual downward pressure. Still, a token burn does not automatically create price appreciation. The more important variables are revenue durability, real protocol demand and the scale of capital flows. I see this as a useful signal for tracking the link between Hyperliquid’s business activity and HYPE tokenomics.
For HYPE, I would watch burn velocity against revenue and liquidity before deciding whether to accumulate or stay defensive. If cash flow and protocol activity keep expanding, the supply-reduction narrative becomes more relevant. Do you think this buy-and-burn mechanism can make a meaningful difference for HYPE over the long term? If this logic makes sense, drop a follow for more market breakdowns.
Please do your own research carefully before making any transactions (DYOR). $HYPE #Colecolen $QNT $Q
According to Onchain Lens, Hyperliquid bought and burned 10,400 HYPE in 24 hours at a volume-weighted average price of USD 91.97, worth about USD 956,800. Total HYPE burned has reached 48.96 million tokens, equal to 4.9% of the maximum supply. Meanwhile, Hyperliquid reportedly generated USD 58.27 million in revenue over the past 30 days.
My take: the key point is not the 10,400 HYPE alone, but the mechanism linking economic activity to lower token supply. If revenue remains strong and part of that value continues to fund HYPE buybacks and burns, circulating supply could face gradual downward pressure. Still, a token burn does not automatically create price appreciation. The more important variables are revenue durability, real protocol demand and the scale of capital flows. I see this as a useful signal for tracking the link between Hyperliquid’s business activity and HYPE tokenomics.
For HYPE, I would watch burn velocity against revenue and liquidity before deciding whether to accumulate or stay defensive. If cash flow and protocol activity keep expanding, the supply-reduction narrative becomes more relevant. Do you think this buy-and-burn mechanism can make a meaningful difference for HYPE over the long term? If this logic makes sense, drop a follow for more market breakdowns.
Please do your own research carefully before making any transactions (DYOR). $HYPE #Colecolen $QNT $Q

206 Atlas:
Burns only matter if demand holds. Watch if revenue actually supports the buybacks or if it's just marketing fluff.
1
2
776
·
--
Haussier
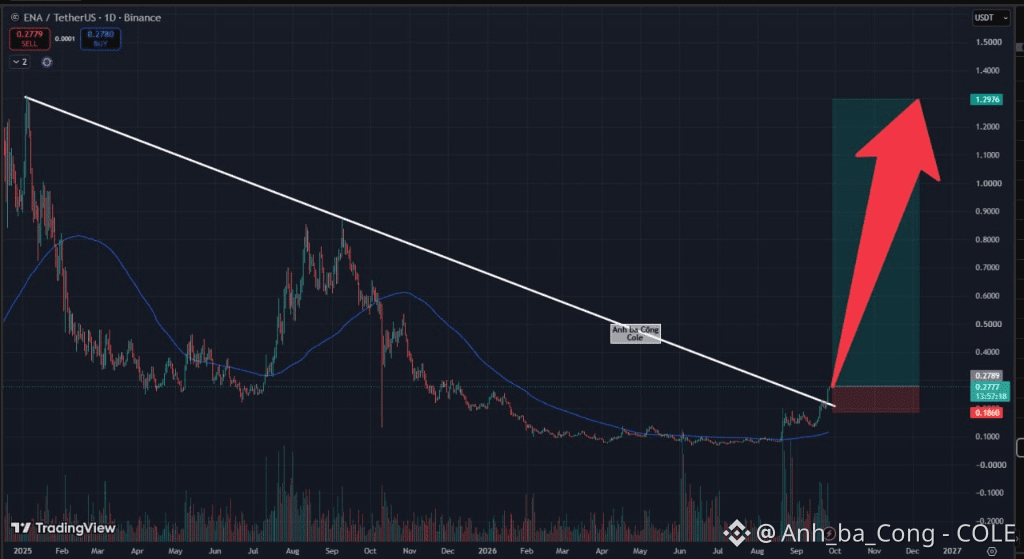
The ENA daily chart on confirms a major macro trend-reversal breakout as price action breaches the secular descending trendline connecting peaks from early 2025. Trading securely above the rising dynamic MA100 alongside persistent accumulation volume verifies complete buyer absorption of circulating supply. The preferred strategy is to initiate a Long position near $0.277–$0.278 with a protective stop-loss parameter beneath $0.1860, targeting the $1.2976 macro resistance shelf for superior risk-to-reward performance. $ENA $RARE $2Z #Colecolen
{future}(2ZUSDT)
{future}(RAREUSDT)
{future}(ENAUSDT)
The ENA daily chart on confirms a major macro trend-reversal breakout as price action breaches the secular descending trendline connecting peaks from early 2025. Trading securely above the rising dynamic MA100 alongside persistent accumulation volume verifies complete buyer absorption of circulating supply. The preferred strategy is to initiate a Long position near $0.277–$0.278 with a protective stop-loss parameter beneath $0.1860, targeting the $1.2976 macro resistance shelf for superior risk-to-reward performance. $ENA $RARE $2Z #Colecolen
423
HASHFLY: A FRUIT FLY BRAIN IS BEING TESTED FOR BTC MINING
FutureBit has unveiled HashFly, an experiment that simulates a fruit fly brain to perform SHA-256, the core algorithm used by Bitcoin mining. The model currently uses 2,914 neural traces from MaleCNS v1.0 and reaches only around 200 kH/s on a conventional computer.
My take: the interesting part is not simply that a “fruit fly brain” can mine BTC, but that biological research could point toward a completely different path to energy efficiency than ASICs. FutureBit estimates that if the model could someday run on real biological neurons, theoretical efficiency could reach around 1 W/TH, roughly 10 times more efficient than today’s leading 3 nm ASICs. But this remains a hypothesis because it assumes all neurons can continuously contribute to computation.
The gap today is still enormous: HashFly runs at about 200 kH/s, while FutureBit’s Apollo III reaches up to 18 TH/s. So I would not treat this as a change to Bitcoin mining yet. I’ll view HashFly as long-term research and watch whether the model expands to the full neuron dataset or produces measurable real-world efficiency gains.
Do you think BTC mining will remain dominated by ASICs, or could biology eventually open a completely different path? If this logic makes sense, drop a follow for more market breakdowns.
Please do your own research carefully before making any transactions (DYOR). $BTC $LTC $BCH #Colecolen
{future}(BCHUSDT)
{future}(LTCUSDT)
{future}(BTCUSDT)
HASHFLY: A FRUIT FLY BRAIN IS BEING TESTED FOR BTC MINING
FutureBit has unveiled HashFly, an experiment that simulates a fruit fly brain to perform SHA-256, the core algorithm used by Bitcoin mining. The model currently uses 2,914 neural traces from MaleCNS v1.0 and reaches only around 200 kH/s on a conventional computer.
My take: the interesting part is not simply that a “fruit fly brain” can mine BTC, but that biological research could point toward a completely different path to energy efficiency than ASICs. FutureBit estimates that if the model could someday run on real biological neurons, theoretical efficiency could reach around 1 W/TH, roughly 10 times more efficient than today’s leading 3 nm ASICs. But this remains a hypothesis because it assumes all neurons can continuously contribute to computation.
The gap today is still enormous: HashFly runs at about 200 kH/s, while FutureBit’s Apollo III reaches up to 18 TH/s. So I would not treat this as a change to Bitcoin mining yet. I’ll view HashFly as long-term research and watch whether the model expands to the full neuron dataset or produces measurable real-world efficiency gains.
Do you think BTC mining will remain dominated by ASICs, or could biology eventually open a completely different path? If this logic makes sense, drop a follow for more market breakdowns.
Please do your own research carefully before making any transactions (DYOR). $BTC $LTC $BCH #Colecolen
FutureBit has unveiled HashFly, an experiment that simulates a fruit fly brain to perform SHA-256, the core algorithm used by Bitcoin mining. The model currently uses 2,914 neural traces from MaleCNS v1.0 and reaches only around 200 kH/s on a conventional computer.
My take: the interesting part is not simply that a “fruit fly brain” can mine BTC, but that biological research could point toward a completely different path to energy efficiency than ASICs. FutureBit estimates that if the model could someday run on real biological neurons, theoretical efficiency could reach around 1 W/TH, roughly 10 times more efficient than today’s leading 3 nm ASICs. But this remains a hypothesis because it assumes all neurons can continuously contribute to computation.
The gap today is still enormous: HashFly runs at about 200 kH/s, while FutureBit’s Apollo III reaches up to 18 TH/s. So I would not treat this as a change to Bitcoin mining yet. I’ll view HashFly as long-term research and watch whether the model expands to the full neuron dataset or produces measurable real-world efficiency gains.
Do you think BTC mining will remain dominated by ASICs, or could biology eventually open a completely different path? If this logic makes sense, drop a follow for more market breakdowns.
Please do your own research carefully before making any transactions (DYOR). $BTC $LTC $BCH #Colecolen

2.1k
BTC: THE QUESTION IS SHIFTING FROM “SHOULD WE INVEST?” TO “HOW MUCH?”
Calamos Investments says sovereign wealth funds are beginning to allocate capital to Bitcoin, while just one year ago many major banks were still cautious about BTC.
My take: the important part is not one isolated statement, but the change in how BTC is being viewed. As institutions managing very large pools of capital start treating Bitcoin as a potential long-term portfolio asset, the debate can shift from “should we own it?” to “what allocation makes sense?” That matters because even a small, recurring allocation from institutional capital could support long-term demand without requiring extreme short-term speculation.
Still, I would not treat this narrative as a reason to chase price. Any sovereign fund allocation needs time to show up in actual flows and meaningful size. I’ll focus on institutional flow data, portfolio positioning and BTC’s reaction around key price levels before deciding whether to accumulate or stay defensive.
Do you think BTC’s future will be shaped more by its price or by its portfolio weight among institutions? If this logic makes sense, drop a follow for more market breakdowns.
Please do your own research carefully before making any transactions (DYOR). $BTC $LTC $TST #Colecolen
{future}(TSTUSDT)
{future}(LTCUSDT)
{future}(BTCUSDT)
BTC: THE QUESTION IS SHIFTING FROM “SHOULD WE INVEST?” TO “HOW MUCH?”
Calamos Investments says sovereign wealth funds are beginning to allocate capital to Bitcoin, while just one year ago many major banks were still cautious about BTC.
My take: the important part is not one isolated statement, but the change in how BTC is being viewed. As institutions managing very large pools of capital start treating Bitcoin as a potential long-term portfolio asset, the debate can shift from “should we own it?” to “what allocation makes sense?” That matters because even a small, recurring allocation from institutional capital could support long-term demand without requiring extreme short-term speculation.
Still, I would not treat this narrative as a reason to chase price. Any sovereign fund allocation needs time to show up in actual flows and meaningful size. I’ll focus on institutional flow data, portfolio positioning and BTC’s reaction around key price levels before deciding whether to accumulate or stay defensive.
Do you think BTC’s future will be shaped more by its price or by its portfolio weight among institutions? If this logic makes sense, drop a follow for more market breakdowns.
Please do your own research carefully before making any transactions (DYOR). $BTC $LTC $TST #Colecolen
Calamos Investments says sovereign wealth funds are beginning to allocate capital to Bitcoin, while just one year ago many major banks were still cautious about BTC.
My take: the important part is not one isolated statement, but the change in how BTC is being viewed. As institutions managing very large pools of capital start treating Bitcoin as a potential long-term portfolio asset, the debate can shift from “should we own it?” to “what allocation makes sense?” That matters because even a small, recurring allocation from institutional capital could support long-term demand without requiring extreme short-term speculation.
Still, I would not treat this narrative as a reason to chase price. Any sovereign fund allocation needs time to show up in actual flows and meaningful size. I’ll focus on institutional flow data, portfolio positioning and BTC’s reaction around key price levels before deciding whether to accumulate or stay defensive.
Do you think BTC’s future will be shaped more by its price or by its portfolio weight among institutions? If this logic makes sense, drop a follow for more market breakdowns.
Please do your own research carefully before making any transactions (DYOR). $BTC $LTC $TST #Colecolen

237
CIRCLE BRINGS BTC INTO INSTITUTIONAL USDC LENDING
BTC is no longer just an asset to hold: Circle now lets institutional clients deposit Bitcoin, convert it into cirBTC, and use it as collateral to borrow USDC, with the loan sent directly to their Circle Mint account.
My take: the key point is not simply “borrowing more USDC”, but turning BTC into a liquidity-producing asset without transferring ownership. cirBTC launched on Arc on Sept. 21 and is backed 1:1 by real Bitcoin held by Circle National Trust. Morpho is the first supported protocol, while Aave is expected to be added later. Interest rates and lending terms are set by third-party protocols, so the model still depends heavily on the DeFi infrastructure underneath it.
I see this as another sign that institutional credit is moving deeper into digital assets. Instead of only buying BTC, institutions now have a way to use BTC as collateral to access liquidity. If adoption scales, capital could be reused across the ecosystem without necessarily creating additional BTC transfer pressure. Still, I would watch cirBTC liquidity, loan utilization and protocol risk before treating this as a major BTC catalyst.
Do you think BTC becoming collateral for institutional credit can create stronger long-term demand for BTC? If this logic makes sense, drop a follow for more market breakdowns.
Please do your own research carefully before making any transactions (DYOR). $BTC $USDC $TAKE #Colecolen
{future}(TAKEUSDT)
{future}(USDCUSDT)
{future}(BTCUSDT)
CIRCLE BRINGS BTC INTO INSTITUTIONAL USDC LENDING
BTC is no longer just an asset to hold: Circle now lets institutional clients deposit Bitcoin, convert it into cirBTC, and use it as collateral to borrow USDC, with the loan sent directly to their Circle Mint account.
My take: the key point is not simply “borrowing more USDC”, but turning BTC into a liquidity-producing asset without transferring ownership. cirBTC launched on Arc on Sept. 21 and is backed 1:1 by real Bitcoin held by Circle National Trust. Morpho is the first supported protocol, while Aave is expected to be added later. Interest rates and lending terms are set by third-party protocols, so the model still depends heavily on the DeFi infrastructure underneath it.
I see this as another sign that institutional credit is moving deeper into digital assets. Instead of only buying BTC, institutions now have a way to use BTC as collateral to access liquidity. If adoption scales, capital could be reused across the ecosystem without necessarily creating additional BTC transfer pressure. Still, I would watch cirBTC liquidity, loan utilization and protocol risk before treating this as a major BTC catalyst.
Do you think BTC becoming collateral for institutional credit can create stronger long-term demand for BTC? If this logic makes sense, drop a follow for more market breakdowns.
Please do your own research carefully before making any transactions (DYOR). $BTC $USDC $TAKE #Colecolen
BTC is no longer just an asset to hold: Circle now lets institutional clients deposit Bitcoin, convert it into cirBTC, and use it as collateral to borrow USDC, with the loan sent directly to their Circle Mint account.
My take: the key point is not simply “borrowing more USDC”, but turning BTC into a liquidity-producing asset without transferring ownership. cirBTC launched on Arc on Sept. 21 and is backed 1:1 by real Bitcoin held by Circle National Trust. Morpho is the first supported protocol, while Aave is expected to be added later. Interest rates and lending terms are set by third-party protocols, so the model still depends heavily on the DeFi infrastructure underneath it.
I see this as another sign that institutional credit is moving deeper into digital assets. Instead of only buying BTC, institutions now have a way to use BTC as collateral to access liquidity. If adoption scales, capital could be reused across the ecosystem without necessarily creating additional BTC transfer pressure. Still, I would watch cirBTC liquidity, loan utilization and protocol risk before treating this as a major BTC catalyst.
Do you think BTC becoming collateral for institutional credit can create stronger long-term demand for BTC? If this logic makes sense, drop a follow for more market breakdowns.
Please do your own research carefully before making any transactions (DYOR). $BTC $USDC $TAKE #Colecolen

252
·
--
Haussier
LSK: Dual Breakout Above Descending Trendline and Dynamic MA100 – High-RR Reversal Long Targeting $0.852 Resistance Shelf
Lisk (LSK) is confirming a high-conviction bullish trend-reversal breakout on the 1-hour timeframe as price action powers cleanly through its primary descending diagonal trendline. Following an extended period of structural compression and lower lows, persistent base accumulation has successfully culminated in aggressive buy-side order flow taking center stage.
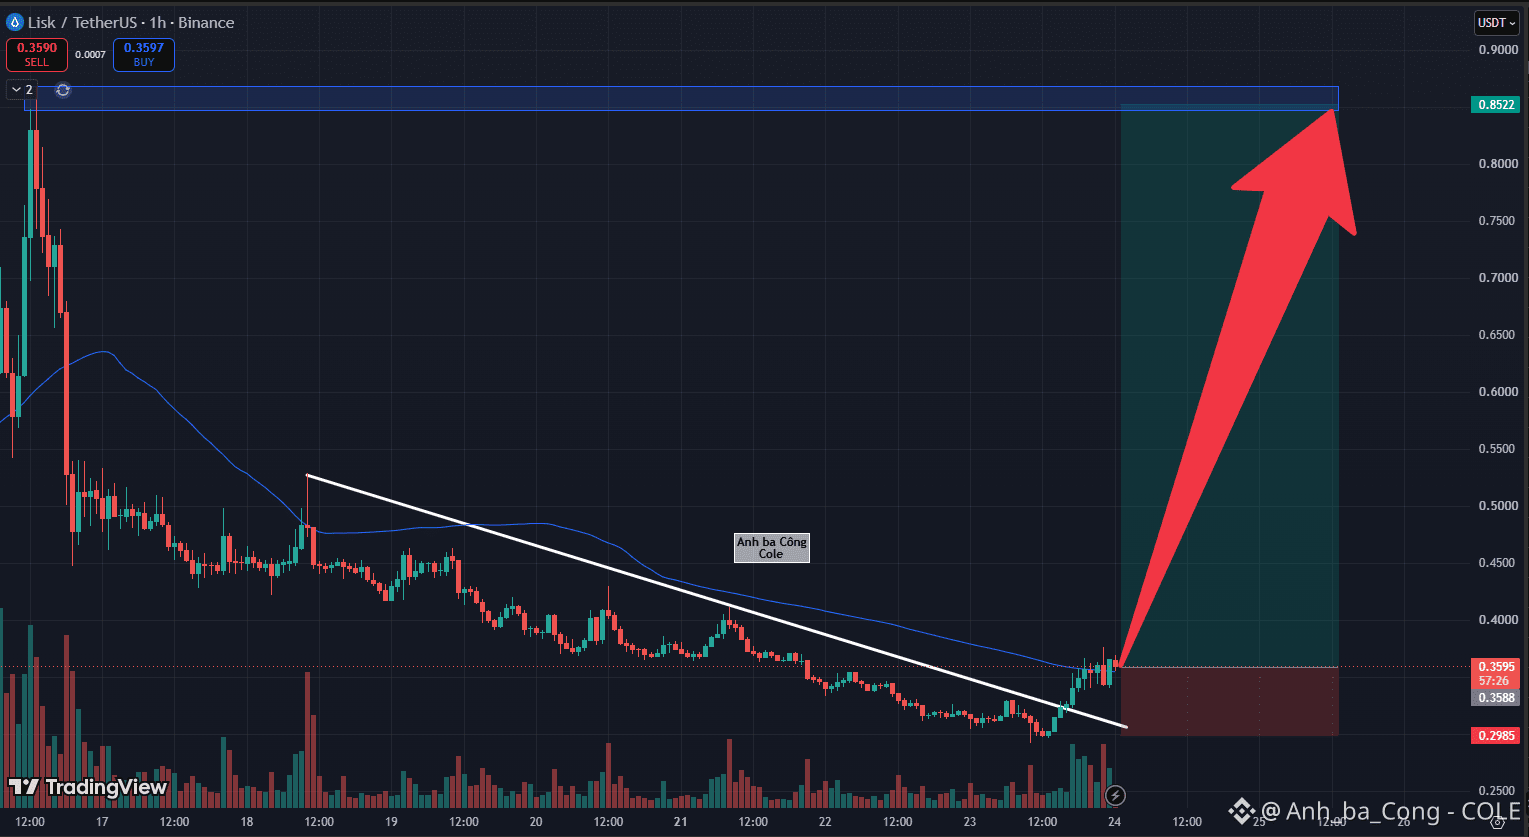
Based on visual data from the 1-hour chart , active candles near the $0.358–$0.359 handle have surged decisively above both the white descending resistance barrier and the dynamic MA100 line. This dual breakout is validated by a visible expansion in green accumulation volume, indicating that residual sell-side pressure has been systematically absorbed. The active consolidation near $0.3588 represents an orderly technical pause to verify newfound support. With prior structural resistance flipping into a dependable launchpad, technical momentum is well-positioned to trigger an aggressive continuation wave. This setup presents an asymmetric trend-reversal Long execution opportunity featuring minimal downside exposure. The optimal trading strategy is to build Long positions within the $0.358–$0.359 zone, anchoring a protective stop-loss parameter directly beneath the recent swing pivot at $0.2985. The primary strategic take-profit objective targets the macro resistance ceiling near $0.8522, securing exceptional risk-to-reward metrics.
Disclaimer: This is not financial advice, DYOR. $LSK #Colecolen $NIL $NOM
{future}(NOMUSDT)
{future}(NILUSDT)
{future}(LSKUSDT)
LSK: Dual Breakout Above Descending Trendline and Dynamic MA100 – High-RR Reversal Long Targeting $0.852 Resistance Shelf
Lisk (LSK) is confirming a high-conviction bullish trend-reversal breakout on the 1-hour timeframe as price action powers cleanly through its primary descending diagonal trendline. Following an extended period of structural compression and lower lows, persistent base accumulation has successfully culminated in aggressive buy-side order flow taking center stage.
Based on visual data from the 1-hour chart , active candles near the $0.358–$0.359 handle have surged decisively above both the white descending resistance barrier and the dynamic MA100 line. This dual breakout is validated by a visible expansion in green accumulation volume, indicating that residual sell-side pressure has been systematically absorbed. The active consolidation near $0.3588 represents an orderly technical pause to verify newfound support. With prior structural resistance flipping into a dependable launchpad, technical momentum is well-positioned to trigger an aggressive continuation wave. This setup presents an asymmetric trend-reversal Long execution opportunity featuring minimal downside exposure. The optimal trading strategy is to build Long positions within the $0.358–$0.359 zone, anchoring a protective stop-loss parameter directly beneath the recent swing pivot at $0.2985. The primary strategic take-profit objective targets the macro resistance ceiling near $0.8522, securing exceptional risk-to-reward metrics.
Disclaimer: This is not financial advice, DYOR. $LSK #Colecolen $NIL $NOM
Lisk (LSK) is confirming a high-conviction bullish trend-reversal breakout on the 1-hour timeframe as price action powers cleanly through its primary descending diagonal trendline. Following an extended period of structural compression and lower lows, persistent base accumulation has successfully culminated in aggressive buy-side order flow taking center stage.
Based on visual data from the 1-hour chart , active candles near the $0.358–$0.359 handle have surged decisively above both the white descending resistance barrier and the dynamic MA100 line. This dual breakout is validated by a visible expansion in green accumulation volume, indicating that residual sell-side pressure has been systematically absorbed. The active consolidation near $0.3588 represents an orderly technical pause to verify newfound support. With prior structural resistance flipping into a dependable launchpad, technical momentum is well-positioned to trigger an aggressive continuation wave. This setup presents an asymmetric trend-reversal Long execution opportunity featuring minimal downside exposure. The optimal trading strategy is to build Long positions within the $0.358–$0.359 zone, anchoring a protective stop-loss parameter directly beneath the recent swing pivot at $0.2985. The primary strategic take-profit objective targets the macro resistance ceiling near $0.8522, securing exceptional risk-to-reward metrics.
Disclaimer: This is not financial advice, DYOR. $LSK #Colecolen $NIL $NOM
1
522
·
--
Haussier
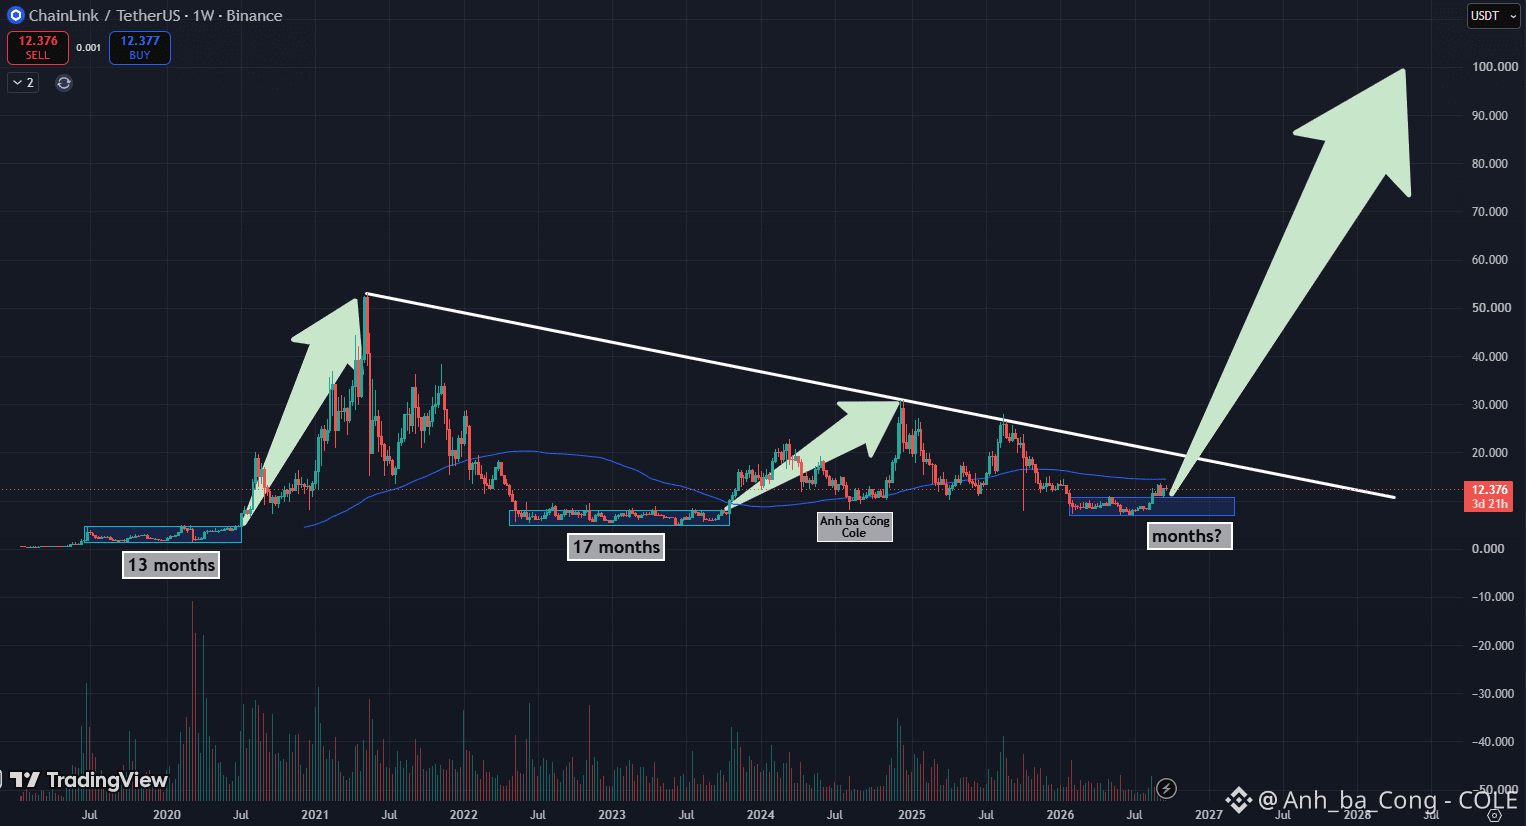
LINK: Replicates Historical Multi-Month Base Accumulation – Macro Breakout Long Targeting $100 Ceiling
Chainlink (LINK) is flashing extraordinary macro accumulation signals on the weekly timeframe (1W), indicating that a major new expansion cycle is preparing to unfold. Over multi-year horizons, price action has consistently adhered to an orderly cyclical blueprint: multi-month compression ranges followed by parabolic markup phases. Based on visual data from the weekly chart , previous bull waves originated from extended range consolidations: a 13-month base in 2019–2020 propelled prices toward $53, while a 17-month accumulation band in 2022–2023 unlocked a rally toward $30. Currently, price action near the $12.37 handle has completed another extended multi-month base while climbing back above the dynamic MA100 line. The active weekly candle is advancing directly toward the dominant white descending diagonal resistance line connecting major historical peaks. Persistent accumulation across this structural floor verifies that institutional capital has absorbed residual floating supply. Once a weekly candle decisively breaks this diagonal resistance, consolidation will yield to an expansive exponential markup wave. The optimal trading strategy is to accumulate medium-to-long-term Long positions within the $12.0–$12.4 zone, establishing a protective stop-loss parameter beneath the range floor at $8.00. The primary strategic take-profit objective targets the macro round-number expansion milestone at $100.00, securing exceptional risk-to-reward metrics. Disclaimer: This is not financial advice, DYOR. $LINK #Colecolen $SAGA $TAKE
{future}(TAKEUSDT)
{future}(SAGAUSDT)
{future}(LINKUSDT)
LINK: Replicates Historical Multi-Month Base Accumulation – Macro Breakout Long Targeting $100 Ceiling
Chainlink (LINK) is flashing extraordinary macro accumulation signals on the weekly timeframe (1W), indicating that a major new expansion cycle is preparing to unfold. Over multi-year horizons, price action has consistently adhered to an orderly cyclical blueprint: multi-month compression ranges followed by parabolic markup phases. Based on visual data from the weekly chart , previous bull waves originated from extended range consolidations: a 13-month base in 2019–2020 propelled prices toward $53, while a 17-month accumulation band in 2022–2023 unlocked a rally toward $30. Currently, price action near the $12.37 handle has completed another extended multi-month base while climbing back above the dynamic MA100 line. The active weekly candle is advancing directly toward the dominant white descending diagonal resistance line connecting major historical peaks. Persistent accumulation across this structural floor verifies that institutional capital has absorbed residual floating supply. Once a weekly candle decisively breaks this diagonal resistance, consolidation will yield to an expansive exponential markup wave. The optimal trading strategy is to accumulate medium-to-long-term Long positions within the $12.0–$12.4 zone, establishing a protective stop-loss parameter beneath the range floor at $8.00. The primary strategic take-profit objective targets the macro round-number expansion milestone at $100.00, securing exceptional risk-to-reward metrics. Disclaimer: This is not financial advice, DYOR. $LINK #Colecolen $SAGA $TAKE
Chainlink (LINK) is flashing extraordinary macro accumulation signals on the weekly timeframe (1W), indicating that a major new expansion cycle is preparing to unfold. Over multi-year horizons, price action has consistently adhered to an orderly cyclical blueprint: multi-month compression ranges followed by parabolic markup phases. Based on visual data from the weekly chart , previous bull waves originated from extended range consolidations: a 13-month base in 2019–2020 propelled prices toward $53, while a 17-month accumulation band in 2022–2023 unlocked a rally toward $30. Currently, price action near the $12.37 handle has completed another extended multi-month base while climbing back above the dynamic MA100 line. The active weekly candle is advancing directly toward the dominant white descending diagonal resistance line connecting major historical peaks. Persistent accumulation across this structural floor verifies that institutional capital has absorbed residual floating supply. Once a weekly candle decisively breaks this diagonal resistance, consolidation will yield to an expansive exponential markup wave. The optimal trading strategy is to accumulate medium-to-long-term Long positions within the $12.0–$12.4 zone, establishing a protective stop-loss parameter beneath the range floor at $8.00. The primary strategic take-profit objective targets the macro round-number expansion milestone at $100.00, securing exceptional risk-to-reward metrics. Disclaimer: This is not financial advice, DYOR. $LINK #Colecolen $SAGA $TAKE
322
·
--
Baissier
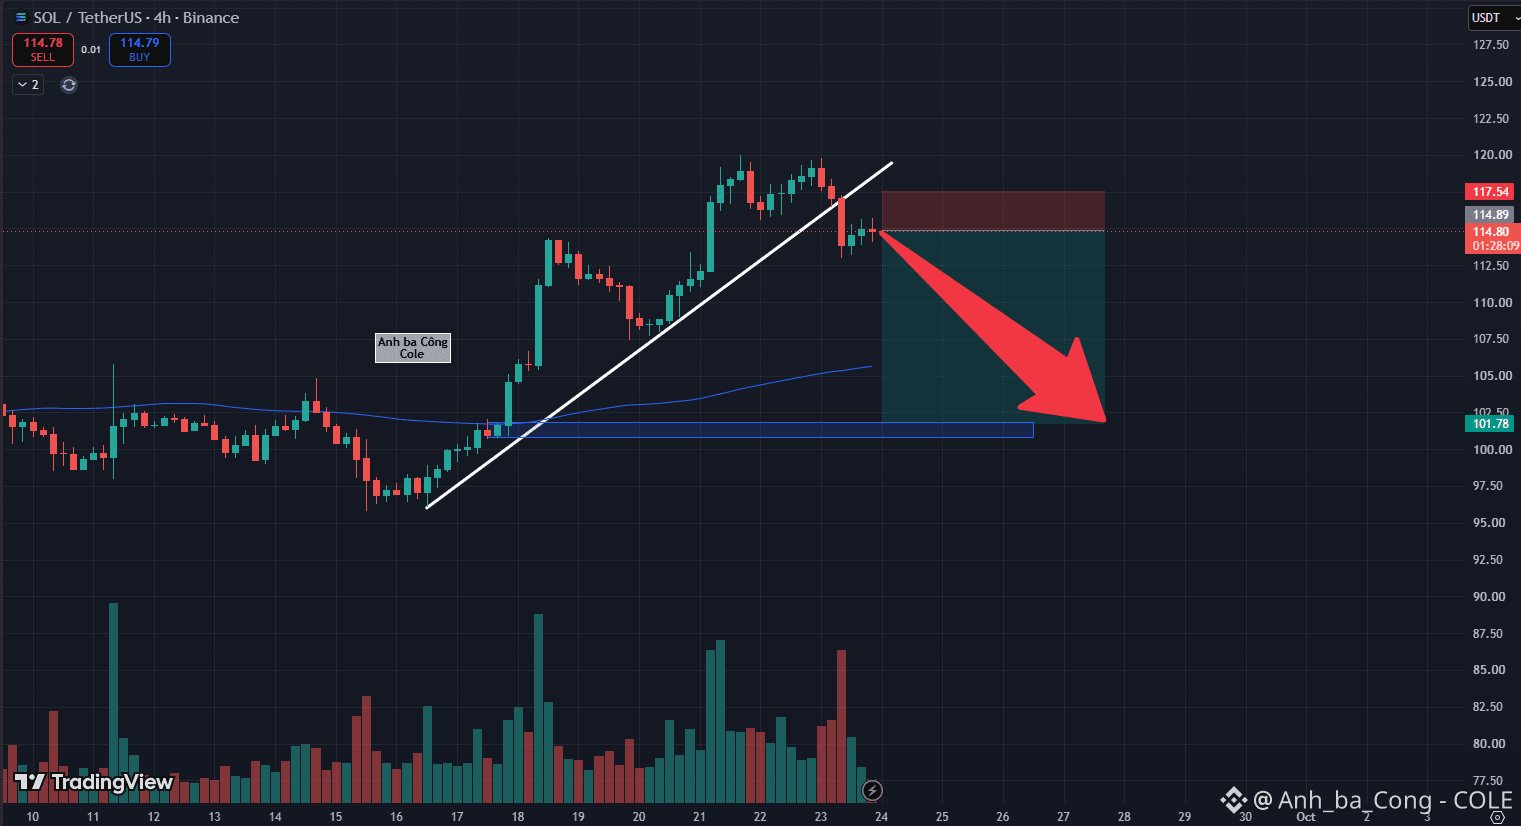
SOL: Breaks Steep Ascending Trendline with Weak Retest – Strategic Trend Reversal Short Targeting $101.8 Base
Solana (SOL) is officially confirming a bearish trend-reversal breakdown on the 4-hour timeframe following an impulsive candle close beneath the steep ascending trendline that supported its recent expansion. After peaking near the $120 handle, buyer exhaustion has become evident, converting the active consolidation into a high-probability mean-reversion short setup.
Based on visual data from the 4-hour chart image_2f2754.png, price action has definitively severed the ascending diagonal baseline. Active 4-hour candles near the $114.80 handle are attempting a corrective retest of the broken trendline, yet they are met with clear upper rejection wicks. Subdued volume during this recovery reflects fading buyer conviction and an absence of institutional participation to sustain higher levels. With the broken ascending support flipped into overhead resistance, dominant sell-side momentum is well-positioned to drive a technical retracement down toward the upward-sloping dynamic MA100 baseline.
This technical setup provides an asymmetric trend-continuation Short execution opportunity featuring tight risk parameters. The optimal trading strategy is to build Short positions within the $114.80–$114.89 zone, placing a protective stop-loss parameter directly above the recent swing high at $117.54. The primary strategic take-profit objective targets the macro accumulation demand floor near $101.78, securing an attractive risk-to-reward ratio.
Disclaimer: This is not financial advice, DYOR. $SOL $NIL $NOM #Colecolen
{future}(NOMUSDT)
{future}(NILUSDT)
{future}(SOLUSDT)
SOL: Breaks Steep Ascending Trendline with Weak Retest – Strategic Trend Reversal Short Targeting $101.8 Base
Solana (SOL) is officially confirming a bearish trend-reversal breakdown on the 4-hour timeframe following an impulsive candle close beneath the steep ascending trendline that supported its recent expansion. After peaking near the $120 handle, buyer exhaustion has become evident, converting the active consolidation into a high-probability mean-reversion short setup.
Based on visual data from the 4-hour chart image_2f2754.png, price action has definitively severed the ascending diagonal baseline. Active 4-hour candles near the $114.80 handle are attempting a corrective retest of the broken trendline, yet they are met with clear upper rejection wicks. Subdued volume during this recovery reflects fading buyer conviction and an absence of institutional participation to sustain higher levels. With the broken ascending support flipped into overhead resistance, dominant sell-side momentum is well-positioned to drive a technical retracement down toward the upward-sloping dynamic MA100 baseline.
This technical setup provides an asymmetric trend-continuation Short execution opportunity featuring tight risk parameters. The optimal trading strategy is to build Short positions within the $114.80–$114.89 zone, placing a protective stop-loss parameter directly above the recent swing high at $117.54. The primary strategic take-profit objective targets the macro accumulation demand floor near $101.78, securing an attractive risk-to-reward ratio.
Disclaimer: This is not financial advice, DYOR. $SOL $NIL $NOM #Colecolen
Solana (SOL) is officially confirming a bearish trend-reversal breakdown on the 4-hour timeframe following an impulsive candle close beneath the steep ascending trendline that supported its recent expansion. After peaking near the $120 handle, buyer exhaustion has become evident, converting the active consolidation into a high-probability mean-reversion short setup.
Based on visual data from the 4-hour chart image_2f2754.png, price action has definitively severed the ascending diagonal baseline. Active 4-hour candles near the $114.80 handle are attempting a corrective retest of the broken trendline, yet they are met with clear upper rejection wicks. Subdued volume during this recovery reflects fading buyer conviction and an absence of institutional participation to sustain higher levels. With the broken ascending support flipped into overhead resistance, dominant sell-side momentum is well-positioned to drive a technical retracement down toward the upward-sloping dynamic MA100 baseline.
This technical setup provides an asymmetric trend-continuation Short execution opportunity featuring tight risk parameters. The optimal trading strategy is to build Short positions within the $114.80–$114.89 zone, placing a protective stop-loss parameter directly above the recent swing high at $117.54. The primary strategic take-profit objective targets the macro accumulation demand floor near $101.78, securing an attractive risk-to-reward ratio.
Disclaimer: This is not financial advice, DYOR. $SOL $NIL $NOM #Colecolen
290
Vérifié
ZEC GETS A NEW GATEWAY TO EUROPEAN CAPITAL
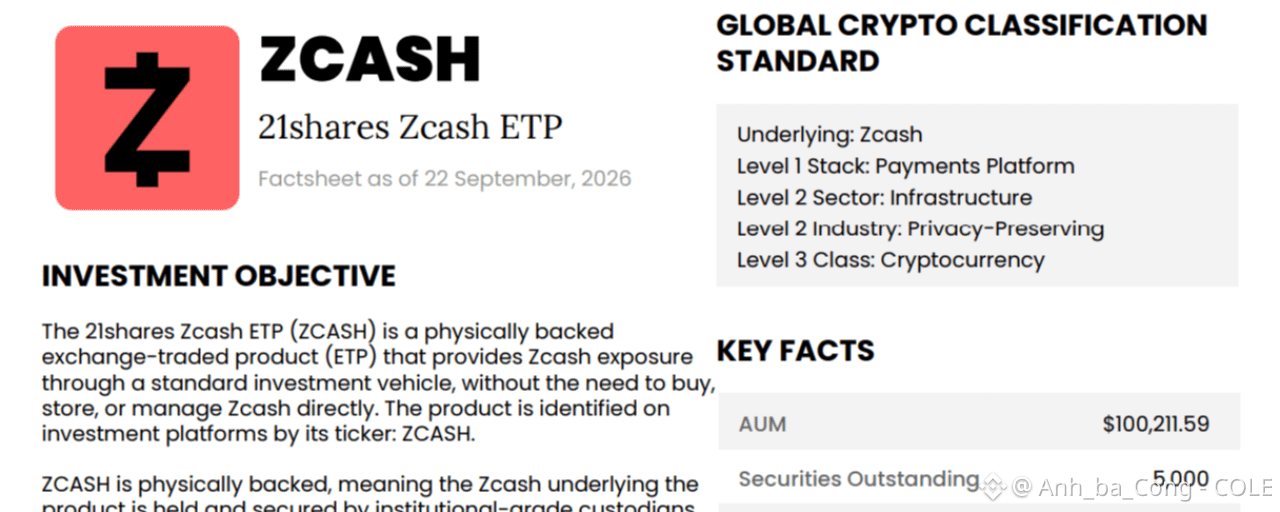
Zcash has gained another notable access channel: 21Shares launched a physically backed Zcash ETP on Euronext Paris and Amsterdam. The product gives investors ZEC exposure through a brokerage account without managing wallets or private keys.
My take: the biggest value is not another investment product, but a familiar route for traditional capital to access ZEC. The ETP is physically backed by Zcash and charges a 2.5% annual fee. After Zcash’s strong performance over the past year, brokerage-based access could broaden the investor base interested in privacy without requiring direct crypto custody.
Still, I would not treat the ETP launch as proof that large capital will flow into ZEC. A 2.5% fee is relatively high, while actual impact depends on liquidity, assets under management and European investor demand. I’ll watch product flows and ZEC’s market reaction rather than relying on its previous rally.
Do you think a European ETP can broaden ZEC’s privacy narrative, or will its impact remain mostly sentiment-driven? If this logic makes sense, drop a follow for more market breakdowns.
Please do your own research carefully before making any transactions (DYOR). $ZEC $MUBARAK $MARSCOIN #Colecolen
{future}(MARSCOINUSDT)
{future}(MUBARAKUSDT)
{future}(ZECUSDT)
ZEC GETS A NEW GATEWAY TO EUROPEAN CAPITAL
Zcash has gained another notable access channel: 21Shares launched a physically backed Zcash ETP on Euronext Paris and Amsterdam. The product gives investors ZEC exposure through a brokerage account without managing wallets or private keys.
My take: the biggest value is not another investment product, but a familiar route for traditional capital to access ZEC. The ETP is physically backed by Zcash and charges a 2.5% annual fee. After Zcash’s strong performance over the past year, brokerage-based access could broaden the investor base interested in privacy without requiring direct crypto custody.
Still, I would not treat the ETP launch as proof that large capital will flow into ZEC. A 2.5% fee is relatively high, while actual impact depends on liquidity, assets under management and European investor demand. I’ll watch product flows and ZEC’s market reaction rather than relying on its previous rally.
Do you think a European ETP can broaden ZEC’s privacy narrative, or will its impact remain mostly sentiment-driven? If this logic makes sense, drop a follow for more market breakdowns.
Please do your own research carefully before making any transactions (DYOR). $ZEC $MUBARAK $MARSCOIN #Colecolen
Zcash has gained another notable access channel: 21Shares launched a physically backed Zcash ETP on Euronext Paris and Amsterdam. The product gives investors ZEC exposure through a brokerage account without managing wallets or private keys.
My take: the biggest value is not another investment product, but a familiar route for traditional capital to access ZEC. The ETP is physically backed by Zcash and charges a 2.5% annual fee. After Zcash’s strong performance over the past year, brokerage-based access could broaden the investor base interested in privacy without requiring direct crypto custody.
Still, I would not treat the ETP launch as proof that large capital will flow into ZEC. A 2.5% fee is relatively high, while actual impact depends on liquidity, assets under management and European investor demand. I’ll watch product flows and ZEC’s market reaction rather than relying on its previous rally.
Do you think a European ETP can broaden ZEC’s privacy narrative, or will its impact remain mostly sentiment-driven? If this logic makes sense, drop a follow for more market breakdowns.
Please do your own research carefully before making any transactions (DYOR). $ZEC $MUBARAK $MARSCOIN #Colecolen
206 Atlas:
High fees and lack of custody control make this a poor vehicle for serious capital. Watch flows, not sentiment.
2
2
783
·
--
Haussier
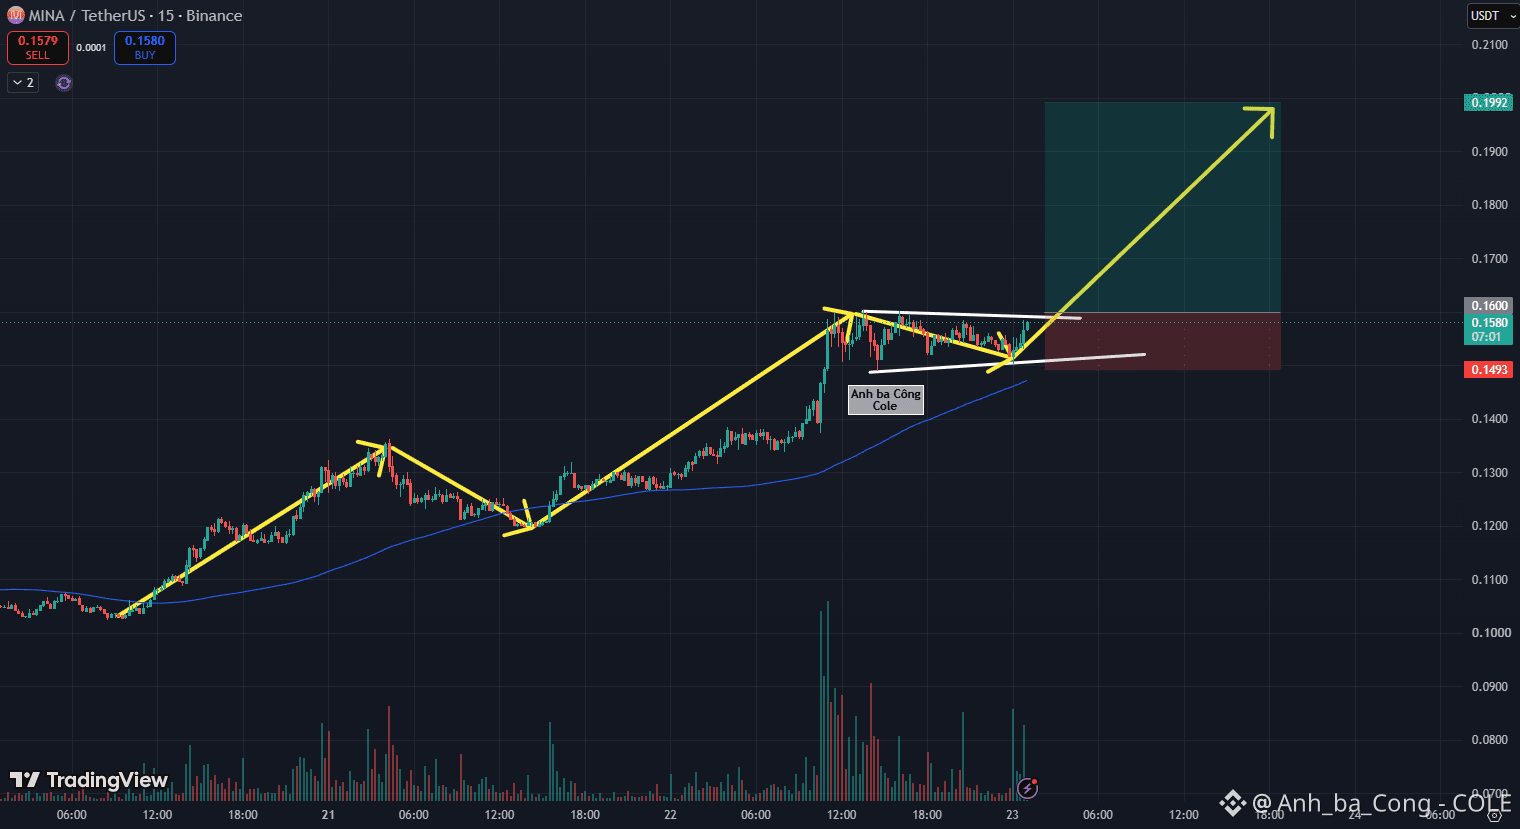
MINA: Bullish Pennant Breakout Following Textbook Staircase Markup – Trend-Following Long Targeting $0.20 MilestoneMina Protocol (MINA) is presenting an optimal trend-continuation entry setup on the 15-minute timeframe following a clean volatility compression within a bullish continuation pennant. A review of recent impulse waves shows that market structure has maintained exceptional orderliness: systematically printing higher highs, conducting shallow pullbacks to verify support, and launching expansive markup legs. Based on visual data from the 15-minute chart , price action has printed a decisive bounce off the pennant's lower boundary and is now challenging the $0.1600 overhead resistance hurdle. This entire consolidation phase has unfolded safely above the upward-sloping dynamic MA100 baseline, verifying that buyers retain dominant control over intermediate order flow. Contracting volume throughout the compression followed by expanding activity near the upper boundary confirms that localized profit-taking has thoroughly dried up. Once the $0.1600 resistance ceiling is breached, aggressive momentum capital is positioned to unleash the next extension leg. The optimal trading strategy is to build trend-following Long positions within the $0.1580–$0.1600 zone. A protective stop-loss parameter should be placed safely beneath the recent consolidation low at $0.1493. The primary strategic take-profit objective targets the psychological round-number expansion ceiling near $0.1992–$0.2000, securing an attractive risk-to-reward ratio. $MINA $MET $BCH #Colecolen
{future}(BCHUSDT)
{future}(METUSDT)
{future}(MINAUSDT)
MINA: Bullish Pennant Breakout Following Textbook Staircase Markup – Trend-Following Long Targeting $0.20 MilestoneMina Protocol (MINA) is presenting an optimal trend-continuation entry setup on the 15-minute timeframe following a clean volatility compression within a bullish continuation pennant. A review of recent impulse waves shows that market structure has maintained exceptional orderliness: systematically printing higher highs, conducting shallow pullbacks to verify support, and launching expansive markup legs. Based on visual data from the 15-minute chart , price action has printed a decisive bounce off the pennant's lower boundary and is now challenging the $0.1600 overhead resistance hurdle. This entire consolidation phase has unfolded safely above the upward-sloping dynamic MA100 baseline, verifying that buyers retain dominant control over intermediate order flow. Contracting volume throughout the compression followed by expanding activity near the upper boundary confirms that localized profit-taking has thoroughly dried up. Once the $0.1600 resistance ceiling is breached, aggressive momentum capital is positioned to unleash the next extension leg. The optimal trading strategy is to build trend-following Long positions within the $0.1580–$0.1600 zone. A protective stop-loss parameter should be placed safely beneath the recent consolidation low at $0.1493. The primary strategic take-profit objective targets the psychological round-number expansion ceiling near $0.1992–$0.2000, securing an attractive risk-to-reward ratio. $MINA $MET $BCH #Colecolen
1
343
·
--
Baissier
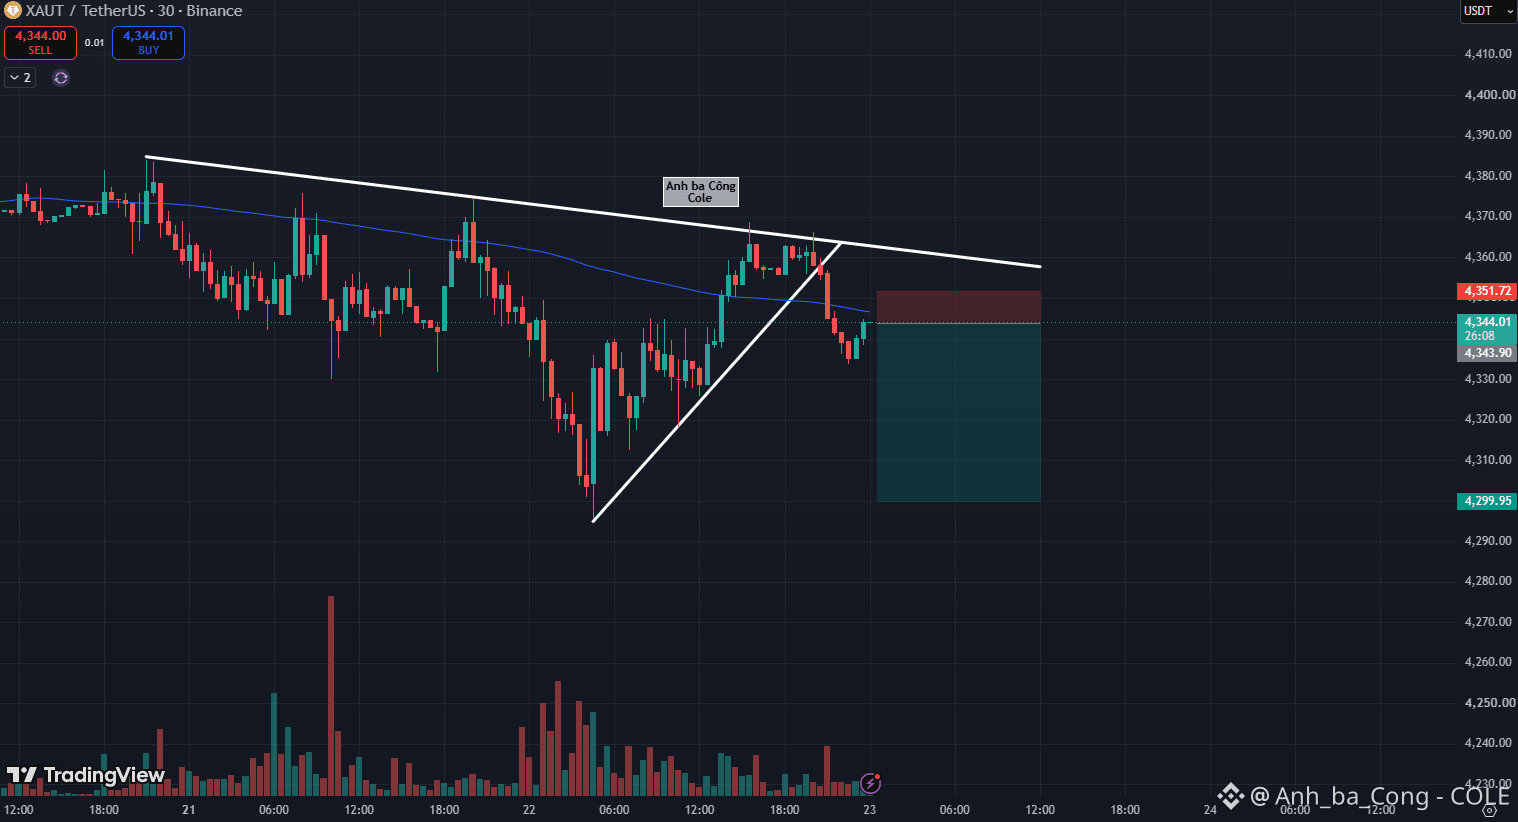
XAUT: Breaks Short-Term Ascending Trendline Beneath Macro Resistance – Strategic Trend Short Targeting $4,300 BaselineTether Gold (XAUT) is confirming a decisive bearish continuation breakdown on the 30-minute timeframe following a clean break below its steep short-term ascending trendline. While price action is attempting a minor technical relief test, the broader intermediate structure remains firmly constrained beneath a macro descending resistance trendline, verifying that sellers maintain dominant control. Based on visual data from the 30-minute chart , the preceding relief rally met fierce rejection directly along the major overhead descending trendline near the $4,360–$4,365 pocket. The resulting sharp decline sliced through the dynamic MA100 line and dismantled the short-term higher-low structure. Currently, price candles near the $4,343–$4,344 handle are consolidating hesitantly just beneath the dynamic MA100 barrier. However, the persistent succession of lower highs and lower lows demonstrates that responsive buying demand remains thoroughly exhausted, lacking the order flow necessary to mount a sustained recovery. As the dynamic MA100 cements itself as overhead resistance, dominant sell-side pressure is positioned to drive price action lower along its primary downtrend trajectory. This technical framework presents an asymmetric trend-following Short execution opportunity featuring tight risk parameters. The optimal trading strategy is to initiate Short positions within the $4,343–$4,344 zone, establishing a protective stop-loss parameter directly above the MA100 hurdle at $4,351.72. The primary strategic take-profit objective targets the macro round-number liquidity floor near $4,299.95, securing an attractive risk-to-reward ratio. Disclaimer: This is not financial advice, DYOR. $XAUT $XAU $PAXG #Colecolen
{future}(PAXGUSDT)
{future}(XAUUSDT)
{future}(XAUTUSDT)
XAUT: Breaks Short-Term Ascending Trendline Beneath Macro Resistance – Strategic Trend Short Targeting $4,300 BaselineTether Gold (XAUT) is confirming a decisive bearish continuation breakdown on the 30-minute timeframe following a clean break below its steep short-term ascending trendline. While price action is attempting a minor technical relief test, the broader intermediate structure remains firmly constrained beneath a macro descending resistance trendline, verifying that sellers maintain dominant control. Based on visual data from the 30-minute chart , the preceding relief rally met fierce rejection directly along the major overhead descending trendline near the $4,360–$4,365 pocket. The resulting sharp decline sliced through the dynamic MA100 line and dismantled the short-term higher-low structure. Currently, price candles near the $4,343–$4,344 handle are consolidating hesitantly just beneath the dynamic MA100 barrier. However, the persistent succession of lower highs and lower lows demonstrates that responsive buying demand remains thoroughly exhausted, lacking the order flow necessary to mount a sustained recovery. As the dynamic MA100 cements itself as overhead resistance, dominant sell-side pressure is positioned to drive price action lower along its primary downtrend trajectory. This technical framework presents an asymmetric trend-following Short execution opportunity featuring tight risk parameters. The optimal trading strategy is to initiate Short positions within the $4,343–$4,344 zone, establishing a protective stop-loss parameter directly above the MA100 hurdle at $4,351.72. The primary strategic take-profit objective targets the macro round-number liquidity floor near $4,299.95, securing an attractive risk-to-reward ratio. Disclaimer: This is not financial advice, DYOR. $XAUT $XAU $PAXG #Colecolen
234
·
--
Baissier
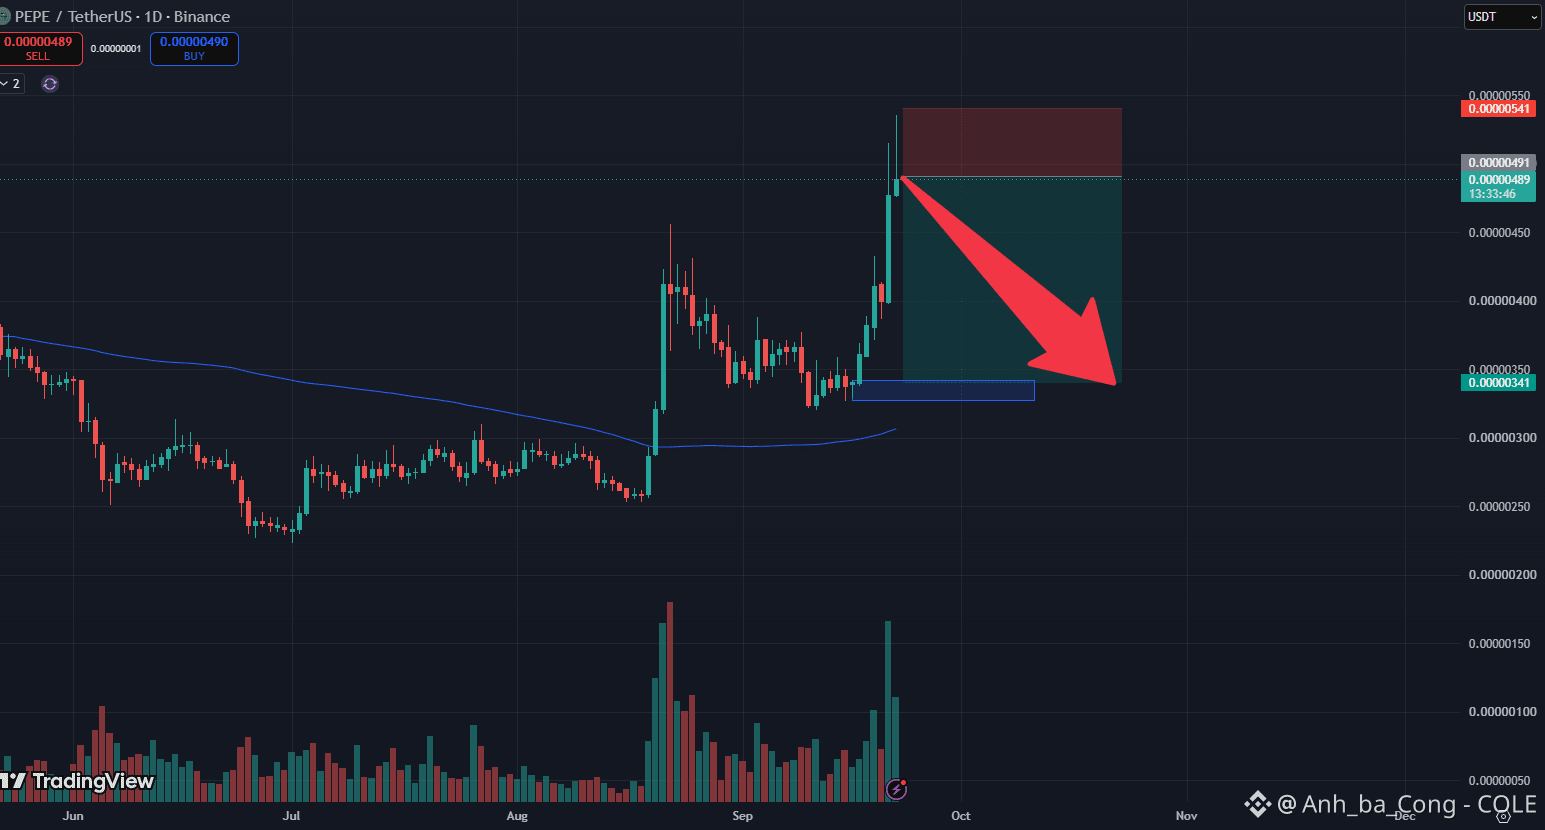
The PEPE daily chart on confirms price action overextending above the dynamic MA100 before printing an extended upper rejection wick at the $0.00000500 psychological ceiling. Declining buy volume signals buyer exhaustion and active profit-taking, paving the way for sellers to command a deep technical pullback. The optimal approach is to enter a Short near $0.00000489 with a tight stop-loss parameter above $0.00000541, targeting the recent impulse base at $0.00000341 for superior risk-to-reward metrics. $PEPE $NIL $WIF #Colecolen
{future}(WIFUSDT)
{future}(NILUSDT)
{spot}(PEPEUSDT)
The PEPE daily chart on confirms price action overextending above the dynamic MA100 before printing an extended upper rejection wick at the $0.00000500 psychological ceiling. Declining buy volume signals buyer exhaustion and active profit-taking, paving the way for sellers to command a deep technical pullback. The optimal approach is to enter a Short near $0.00000489 with a tight stop-loss parameter above $0.00000541, targeting the recent impulse base at $0.00000341 for superior risk-to-reward metrics. $PEPE $NIL $WIF #Colecolen
291
·
--
Haussier
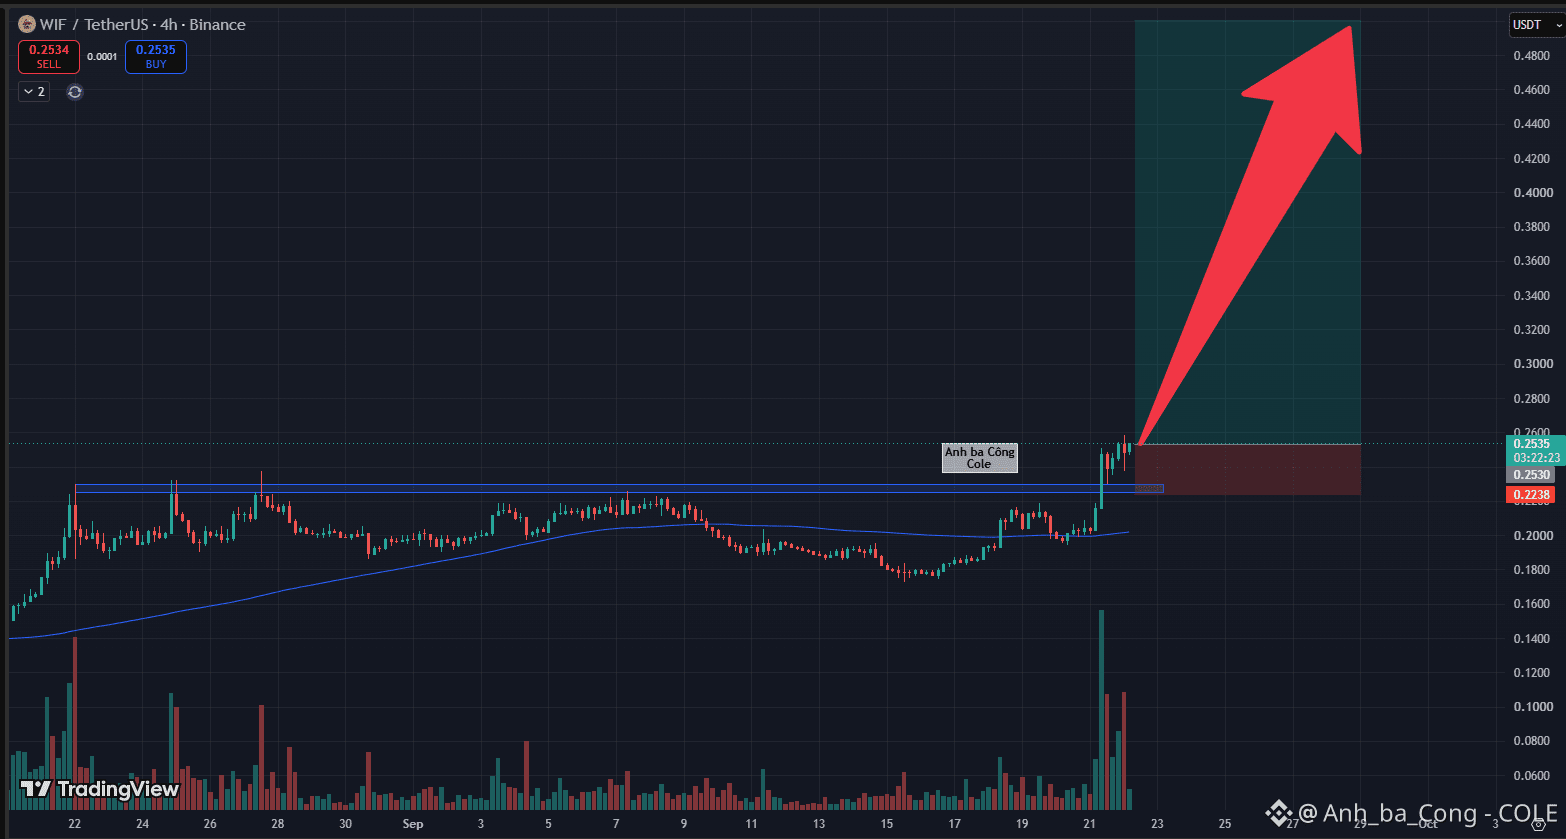
The WIF 4H chart on confirms a definitive breakout from an extended consolidation range, evidenced by multiple candle closes sustained above the $0.230–$0.235 resistance band. A sharp volume surge well above the rising dynamic MA100 confirms that buyers have absorbed floating supply, flipping resistance into durable support. The optimal approach is to enter a trend Long near $0.2535 with a protective stop-loss parameter beneath $0.2238, targeting the $0.5000 psychological ceiling for an asymmetric risk-to-reward setup. $WIF $AKE $AGT #Colecolen
{future}(AGTUSDT)
{future}(AKEUSDT)
{future}(WIFUSDT)
The WIF 4H chart on confirms a definitive breakout from an extended consolidation range, evidenced by multiple candle closes sustained above the $0.230–$0.235 resistance band. A sharp volume surge well above the rising dynamic MA100 confirms that buyers have absorbed floating supply, flipping resistance into durable support. The optimal approach is to enter a trend Long near $0.2535 with a protective stop-loss parameter beneath $0.2238, targeting the $0.5000 psychological ceiling for an asymmetric risk-to-reward setup. $WIF $AKE $AGT #Colecolen
214
BTC RECLAIMS THE 50-WEEK MA: WHAT DOES IT MEAN?
Bitcoin closed the week above its 50-week moving average near USD 78,700 for the first time in 45 weeks. Doctor Profit says this could signal the end of the bear market. BTC is now around USD 81,000 and remains below the USD 82,500–83,000 resistance zone.
My take: the 50-week MA matters because it reflects roughly a year of price trend, but one reclaim is not enough to declare a full cycle reversal. Historical data cited by Doctor Profit shows seven prior reclaims, with five followed by bull markets and two becoming false breakouts. What matters more to me is what happens after the reclaim: if BTC holds USD 78,700 in the coming weeks, selling pressure could ease and capital may have more reason to return to risk assets. If the level is lost again, the signal weakens materially.
So I would not chase price simply because of one technical signal. I’m watching weekly closes, USD 78,700 and especially USD 82,500–83,000. A breakout with strong volume would matter more than simply moving above the MA.
Do you see this MA50 reclaim as confirmation of a bottom, or do we still need another breakout? If this logic makes sense, drop a follow for more market breakdowns.
Please do your own research carefully before making any transactions (DYOR). $BTC $SAGA $NIL #Colecolen
{future}(NILUSDT)
{future}(SAGAUSDT)
{future}(BTCUSDT)
BTC RECLAIMS THE 50-WEEK MA: WHAT DOES IT MEAN?
Bitcoin closed the week above its 50-week moving average near USD 78,700 for the first time in 45 weeks. Doctor Profit says this could signal the end of the bear market. BTC is now around USD 81,000 and remains below the USD 82,500–83,000 resistance zone.
My take: the 50-week MA matters because it reflects roughly a year of price trend, but one reclaim is not enough to declare a full cycle reversal. Historical data cited by Doctor Profit shows seven prior reclaims, with five followed by bull markets and two becoming false breakouts. What matters more to me is what happens after the reclaim: if BTC holds USD 78,700 in the coming weeks, selling pressure could ease and capital may have more reason to return to risk assets. If the level is lost again, the signal weakens materially.
So I would not chase price simply because of one technical signal. I’m watching weekly closes, USD 78,700 and especially USD 82,500–83,000. A breakout with strong volume would matter more than simply moving above the MA.
Do you see this MA50 reclaim as confirmation of a bottom, or do we still need another breakout? If this logic makes sense, drop a follow for more market breakdowns.
Please do your own research carefully before making any transactions (DYOR). $BTC $SAGA $NIL #Colecolen
Bitcoin closed the week above its 50-week moving average near USD 78,700 for the first time in 45 weeks. Doctor Profit says this could signal the end of the bear market. BTC is now around USD 81,000 and remains below the USD 82,500–83,000 resistance zone.
My take: the 50-week MA matters because it reflects roughly a year of price trend, but one reclaim is not enough to declare a full cycle reversal. Historical data cited by Doctor Profit shows seven prior reclaims, with five followed by bull markets and two becoming false breakouts. What matters more to me is what happens after the reclaim: if BTC holds USD 78,700 in the coming weeks, selling pressure could ease and capital may have more reason to return to risk assets. If the level is lost again, the signal weakens materially.
So I would not chase price simply because of one technical signal. I’m watching weekly closes, USD 78,700 and especially USD 82,500–83,000. A breakout with strong volume would matter more than simply moving above the MA.
Do you see this MA50 reclaim as confirmation of a bottom, or do we still need another breakout? If this logic makes sense, drop a follow for more market breakdowns.
Please do your own research carefully before making any transactions (DYOR). $BTC $SAGA $NIL #Colecolen

112
NEAR JUMPS OVER 85% AFTER HYPERLIQUID INTEGRATION
NEAR has attracted strong flows, rising over 85% in seven days to around USD 4.33, while 24-hour volume topped USD 2.2 billion. The new catalyst is Confidential by Default, enabling perpetual trading on Hyperliquid with privacy for wallet, funding source and position ownership.
My take: the market is valuing NEAR not only as a blockchain, but as infrastructure connecting liquidity with privacy. Hyperliquid provides liquidity and execution, while NEAR handles cross-chain assets and obscures the link between a position and its funding source. This is practical because NEAR can tap existing derivatives liquidity instead of building its own market. Hyperliquid processed about USD 240 billion in perpetual volume over the 30 days through mid-September, so real adoption could increase demand for NEAR infrastructure.
Still, I would not treat the 85% rally as proof of continuation. Leverage, regional restrictions and actual privacy adoption remain risks. I’ll watch volume, Confidential Intents TVL and real usage before adding exposure.
Do you think NEAR’s bigger catalyst is privacy or access to Hyperliquid liquidity? If this logic makes sense, drop a follow for more market breakdowns.
Please do your own research carefully before making any transactions (DYOR). $NEAR $HYPE $AKE #Colecolen
{future}(AKEUSDT)
{future}(HYPEUSDT)
{future}(NEARUSDT)
NEAR JUMPS OVER 85% AFTER HYPERLIQUID INTEGRATION
NEAR has attracted strong flows, rising over 85% in seven days to around USD 4.33, while 24-hour volume topped USD 2.2 billion. The new catalyst is Confidential by Default, enabling perpetual trading on Hyperliquid with privacy for wallet, funding source and position ownership.
My take: the market is valuing NEAR not only as a blockchain, but as infrastructure connecting liquidity with privacy. Hyperliquid provides liquidity and execution, while NEAR handles cross-chain assets and obscures the link between a position and its funding source. This is practical because NEAR can tap existing derivatives liquidity instead of building its own market. Hyperliquid processed about USD 240 billion in perpetual volume over the 30 days through mid-September, so real adoption could increase demand for NEAR infrastructure.
Still, I would not treat the 85% rally as proof of continuation. Leverage, regional restrictions and actual privacy adoption remain risks. I’ll watch volume, Confidential Intents TVL and real usage before adding exposure.
Do you think NEAR’s bigger catalyst is privacy or access to Hyperliquid liquidity? If this logic makes sense, drop a follow for more market breakdowns.
Please do your own research carefully before making any transactions (DYOR). $NEAR $HYPE $AKE #Colecolen
NEAR has attracted strong flows, rising over 85% in seven days to around USD 4.33, while 24-hour volume topped USD 2.2 billion. The new catalyst is Confidential by Default, enabling perpetual trading on Hyperliquid with privacy for wallet, funding source and position ownership.
My take: the market is valuing NEAR not only as a blockchain, but as infrastructure connecting liquidity with privacy. Hyperliquid provides liquidity and execution, while NEAR handles cross-chain assets and obscures the link between a position and its funding source. This is practical because NEAR can tap existing derivatives liquidity instead of building its own market. Hyperliquid processed about USD 240 billion in perpetual volume over the 30 days through mid-September, so real adoption could increase demand for NEAR infrastructure.
Still, I would not treat the 85% rally as proof of continuation. Leverage, regional restrictions and actual privacy adoption remain risks. I’ll watch volume, Confidential Intents TVL and real usage before adding exposure.
Do you think NEAR’s bigger catalyst is privacy or access to Hyperliquid liquidity? If this logic makes sense, drop a follow for more market breakdowns.
Please do your own research carefully before making any transactions (DYOR). $NEAR $HYPE $AKE #Colecolen

354
·
--
Haussier
ZETA: Explosive Markup Surges Past MA100 to Challenge Key $0.070 Ceiling – Breakout Long Targeting $0.100 Resistance Shelf
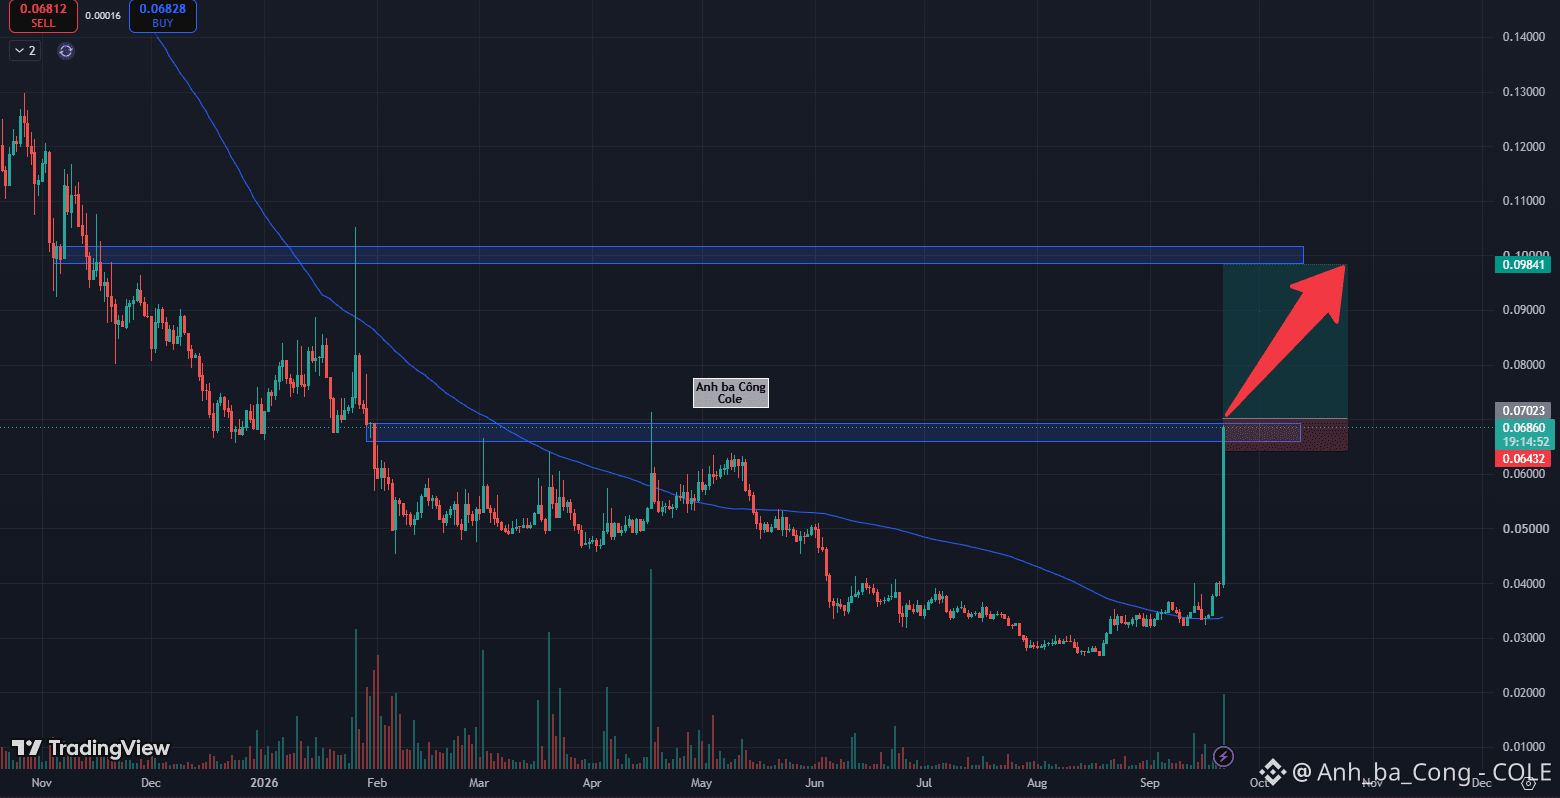
ZetaChain (ZETA) is displaying an aggressive return of institutional capital on the daily timeframe, marked by an expansive vertical green candle propelling price action upward. Crucially, this decisive impulse represents the first time in multiple months that price action has successfully broken out and traded far above the dynamic MA100 trendline.
Based on visual data from the daily chart , the active daily candle near the $0.068–$0.070 zone is directly testing a critical horizontal resistance shelf established back in January 2026. An unprecedented volume spike paired with strong candle expansion confirms that aggressive buy-side demand has thoroughly overwhelmed active sellers. This decisive participation indicates that major market participants have neutralized historical overhead distribution while systematically absorbing all remaining floating supply. Once a daily candle close confirms acceptance above the $0.070 barrier, this structural resistance will flip into an unyielding demand base, unlocking momentum for an extended continuation leg.
The most disciplined trading approach is to await a confirmed daily candle close decisively above $0.0702 before executing a trend Long. A tight protective stop-loss parameter should be positioned just beneath the converted breakout shelf at $0.0643. The primary strategic take-profit objective targets the next macro resistance band and psychological round-number level across the $0.0984–$0.1000 zone. Disclaimer: This is not financial advice, DYOR. $ZETA $NIL $SAGA #Colecolen
{future}(SAGAUSDT)
{future}(NILUSDT)
{future}(ZETAUSDT)
ZETA: Explosive Markup Surges Past MA100 to Challenge Key $0.070 Ceiling – Breakout Long Targeting $0.100 Resistance Shelf
ZetaChain (ZETA) is displaying an aggressive return of institutional capital on the daily timeframe, marked by an expansive vertical green candle propelling price action upward. Crucially, this decisive impulse represents the first time in multiple months that price action has successfully broken out and traded far above the dynamic MA100 trendline.
Based on visual data from the daily chart , the active daily candle near the $0.068–$0.070 zone is directly testing a critical horizontal resistance shelf established back in January 2026. An unprecedented volume spike paired with strong candle expansion confirms that aggressive buy-side demand has thoroughly overwhelmed active sellers. This decisive participation indicates that major market participants have neutralized historical overhead distribution while systematically absorbing all remaining floating supply. Once a daily candle close confirms acceptance above the $0.070 barrier, this structural resistance will flip into an unyielding demand base, unlocking momentum for an extended continuation leg.
The most disciplined trading approach is to await a confirmed daily candle close decisively above $0.0702 before executing a trend Long. A tight protective stop-loss parameter should be positioned just beneath the converted breakout shelf at $0.0643. The primary strategic take-profit objective targets the next macro resistance band and psychological round-number level across the $0.0984–$0.1000 zone. Disclaimer: This is not financial advice, DYOR. $ZETA $NIL $SAGA #Colecolen
ZetaChain (ZETA) is displaying an aggressive return of institutional capital on the daily timeframe, marked by an expansive vertical green candle propelling price action upward. Crucially, this decisive impulse represents the first time in multiple months that price action has successfully broken out and traded far above the dynamic MA100 trendline.
Based on visual data from the daily chart , the active daily candle near the $0.068–$0.070 zone is directly testing a critical horizontal resistance shelf established back in January 2026. An unprecedented volume spike paired with strong candle expansion confirms that aggressive buy-side demand has thoroughly overwhelmed active sellers. This decisive participation indicates that major market participants have neutralized historical overhead distribution while systematically absorbing all remaining floating supply. Once a daily candle close confirms acceptance above the $0.070 barrier, this structural resistance will flip into an unyielding demand base, unlocking momentum for an extended continuation leg.
The most disciplined trading approach is to await a confirmed daily candle close decisively above $0.0702 before executing a trend Long. A tight protective stop-loss parameter should be positioned just beneath the converted breakout shelf at $0.0643. The primary strategic take-profit objective targets the next macro resistance band and psychological round-number level across the $0.0984–$0.1000 zone. Disclaimer: This is not financial advice, DYOR. $ZETA $NIL $SAGA #Colecolen
1
2
1.4k
·
--
Baissier
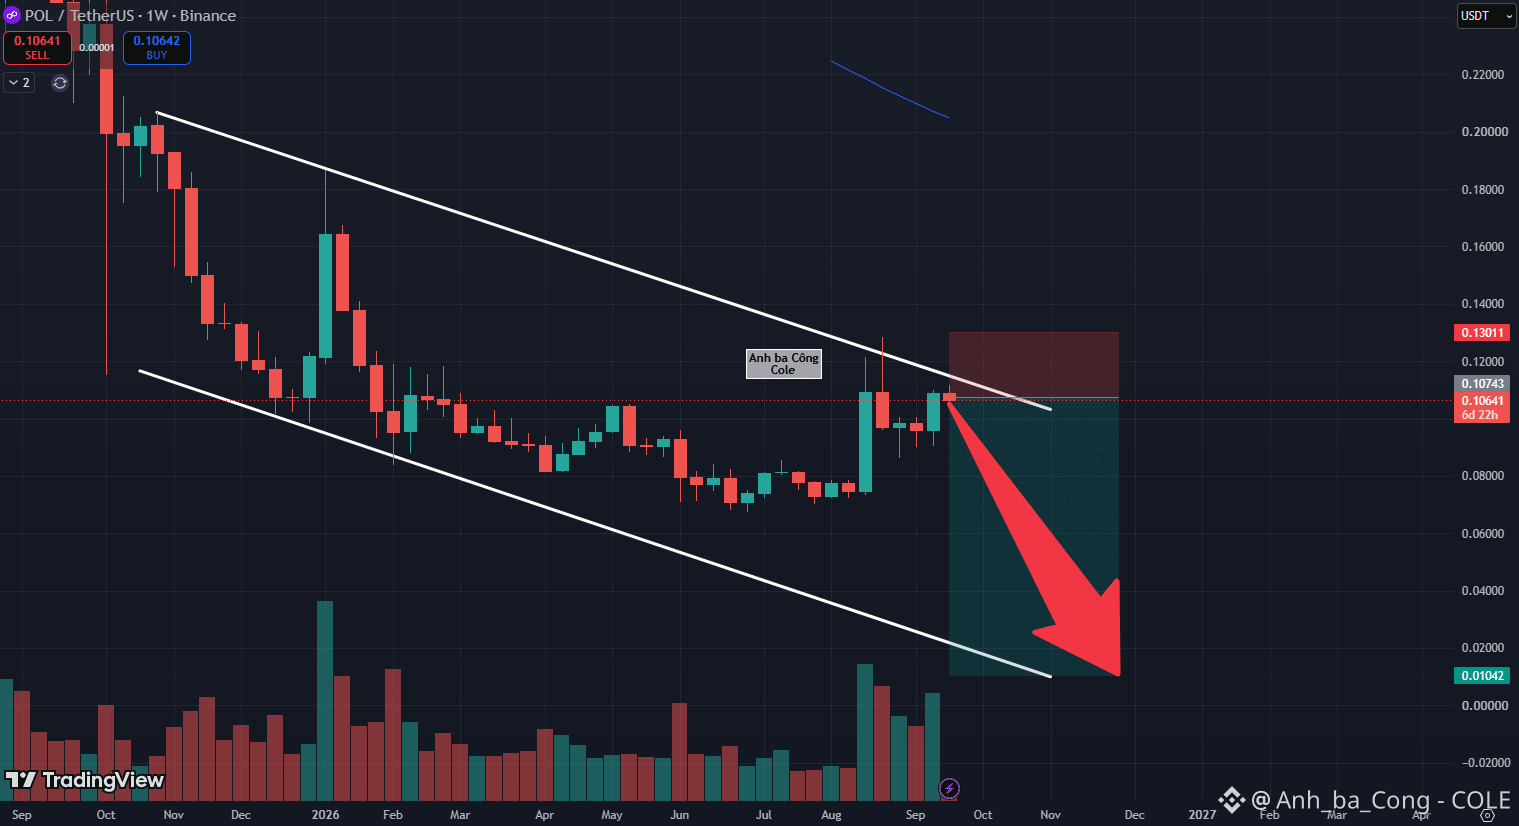
POL: Hits Upper Resistance Boundary of Macro Descending Channel – Strategic Trend-Following Short Targeting $0.010 Floor
POL (Polygon Ecosystem Token) is presenting a high-conviction trend-continuation entry setup on the weekly timeframe (1W) as its corrective recovery touches the upper boundary of an extended descending parallel channel. Over recent months, market structure has consistently printed lower highs and lower lows, confirming that sellers maintain full control of the secular macro downtrend. Based on visual data from the weekly chart , the recent relief rally has pushed price action directly into the diagonal descending resistance trendline near the $0.106–$0.107 handle. The active weekly candle is already carving out an upper rejection wick, signaling that buyer momentum has swiftly dried up upon meeting dense overhead supply. Buyers remain entirely incapable of engineering a breakout above the descending ceiling. As distribution pressure resumes, the unyielding channel ceiling is positioned to trigger a renewed liquidation wave, driving price action downward along its primary trend trajectory. This technical setup provides an asymmetric trend-following Short execution opportunity featuring superior risk-to-reward metrics. The optimal trading strategy is to build Short positions within the $0.106–$0.107 zone, establishing a protective stop-loss parameter safely above the channel boundary at $0.1301. The primary strategic take-profit objective targets the macro round-number floor near $0.0104. Disclaimer: This is not financial advice, DYOR. $POL $PTB $SAGA #Colecolen
{future}(SAGAUSDT)
{future}(PTBUSDT)
{future}(POLUSDT)
POL: Hits Upper Resistance Boundary of Macro Descending Channel – Strategic Trend-Following Short Targeting $0.010 Floor
POL (Polygon Ecosystem Token) is presenting a high-conviction trend-continuation entry setup on the weekly timeframe (1W) as its corrective recovery touches the upper boundary of an extended descending parallel channel. Over recent months, market structure has consistently printed lower highs and lower lows, confirming that sellers maintain full control of the secular macro downtrend. Based on visual data from the weekly chart , the recent relief rally has pushed price action directly into the diagonal descending resistance trendline near the $0.106–$0.107 handle. The active weekly candle is already carving out an upper rejection wick, signaling that buyer momentum has swiftly dried up upon meeting dense overhead supply. Buyers remain entirely incapable of engineering a breakout above the descending ceiling. As distribution pressure resumes, the unyielding channel ceiling is positioned to trigger a renewed liquidation wave, driving price action downward along its primary trend trajectory. This technical setup provides an asymmetric trend-following Short execution opportunity featuring superior risk-to-reward metrics. The optimal trading strategy is to build Short positions within the $0.106–$0.107 zone, establishing a protective stop-loss parameter safely above the channel boundary at $0.1301. The primary strategic take-profit objective targets the macro round-number floor near $0.0104. Disclaimer: This is not financial advice, DYOR. $POL $PTB $SAGA #Colecolen
POL (Polygon Ecosystem Token) is presenting a high-conviction trend-continuation entry setup on the weekly timeframe (1W) as its corrective recovery touches the upper boundary of an extended descending parallel channel. Over recent months, market structure has consistently printed lower highs and lower lows, confirming that sellers maintain full control of the secular macro downtrend. Based on visual data from the weekly chart , the recent relief rally has pushed price action directly into the diagonal descending resistance trendline near the $0.106–$0.107 handle. The active weekly candle is already carving out an upper rejection wick, signaling that buyer momentum has swiftly dried up upon meeting dense overhead supply. Buyers remain entirely incapable of engineering a breakout above the descending ceiling. As distribution pressure resumes, the unyielding channel ceiling is positioned to trigger a renewed liquidation wave, driving price action downward along its primary trend trajectory. This technical setup provides an asymmetric trend-following Short execution opportunity featuring superior risk-to-reward metrics. The optimal trading strategy is to build Short positions within the $0.106–$0.107 zone, establishing a protective stop-loss parameter safely above the channel boundary at $0.1301. The primary strategic take-profit objective targets the macro round-number floor near $0.0104. Disclaimer: This is not financial advice, DYOR. $POL $PTB $SAGA #Colecolen
1
488
Connectez-vous pour découvrir plus de contenu
Rejoignez la communauté mondiale des adeptes de cryptomonnaies sur Binance Square
⚡️ Suviez les dernières informations importantes sur les cryptomonnaies.
💬 Jugé digne de confiance par la plus grande plateforme d’échange de cryptomonnaies au monde.
👍 Découvrez les connaissances que partagent les créateurs vérifiés.
Adresse e-mail/Nº de téléphone
Sujets d’actualité
1
#BTCFallsBelow$83000
4,718 vues
73 mentions
2
#BitgetDetailsSecurityIncidentTimeline
543 vues
56 mentions
3
#BitcoinSpotETFs$2.39BWeeklyNetInflow
491 vues
12 mentions
4
#FedProposesPaymentStablecoinRules
19,102 vues
417 mentions
5
#ChinaMayLetAlibabaByteDanceBuyNvidiaChips
22,199 vues
461 mentions
6
#USChinaRelease$30BTariffCutProductLists
2,898 vues
48 mentions
7
#SKoreaFSCConsidersVirtualAssetMarketMaker
14,088 vues
343 mentions
8
#ChinaIndustrialProfitGrowthSlowsFourthMonth
13,586 vues
334 mentions
9
#BitwiseFilesFinalNEARSpotETFProspectus
133,356 vues
1,931 mentions
10
#BitgetHackerMoves$83MStolenXRP
42,380 vues
187 mentions