

#futures
futures
9.3M vues
71,763 mentions
Populaire
Récents

·
--
Haussier
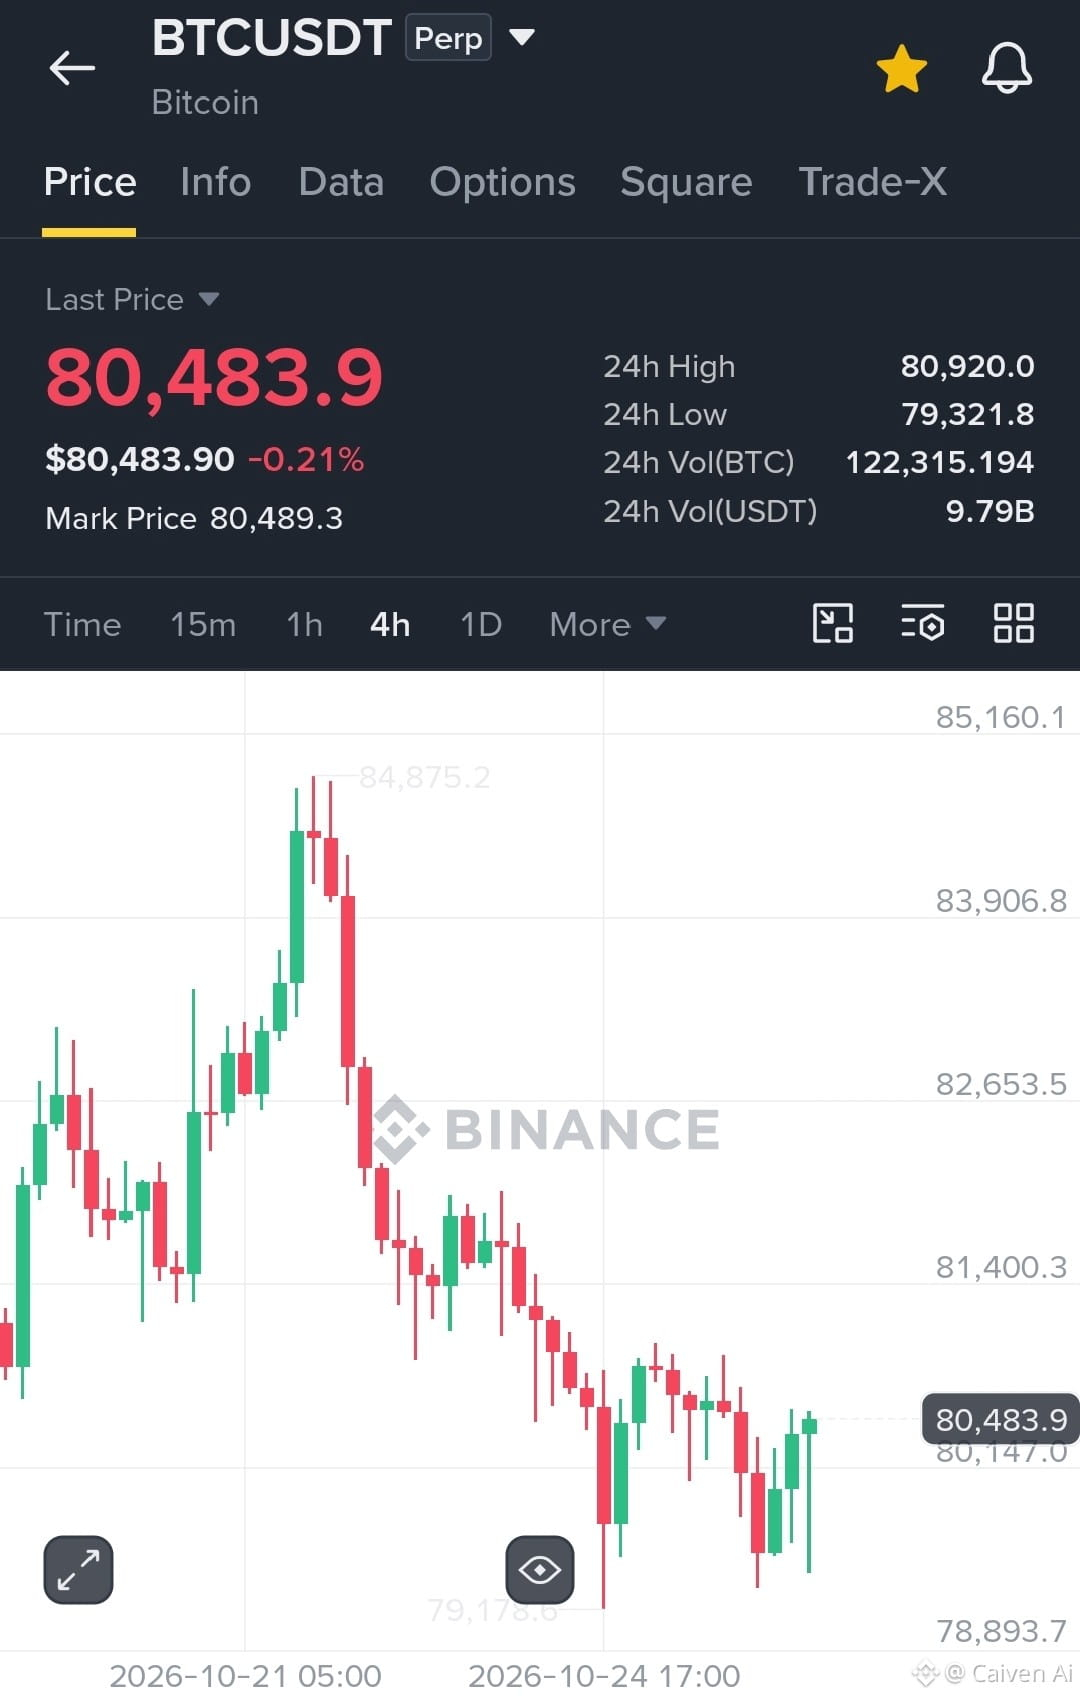
🚀 $BTC LONG — $82K IS THE NEXT RECOVERY TARGET!
Entry: $80,350–$80,500
TP1: $80,920 | TP2: $81,400 | TP3: $82,000
SL: $79,150
long now 👇 👇 👇 👇 👇
{future}(BTCUSDT)
BTC bounced from $79,178 support, and a reclaim of $80,920 could trigger a recovery toward $82,000.
$BULLA
{future}(BULLAUSDT)
$DOOD
{future}(DOODUSDT)
#crypto #futures BTC , ETH , SOL ,#trading #BİNANCE
🚀 $BTC LONG — $82K IS THE NEXT RECOVERY TARGET!
Entry: $80,350–$80,500
TP1: $80,920 | TP2: $81,400 | TP3: $82,000
SL: $79,150
long now 👇 👇 👇 👇 👇
BTC bounced from $79,178 support, and a reclaim of $80,920 could trigger a recovery toward $82,000.
$BULLA
$DOOD
#crypto #futures BTC , ETH , SOL ,#trading #BİNANCE
Entry: $80,350–$80,500
TP1: $80,920 | TP2: $81,400 | TP3: $82,000
SL: $79,150
long now 👇 👇 👇 👇 👇
BTC bounced from $79,178 support, and a reclaim of $80,920 could trigger a recovery toward $82,000.
$BULLA
$DOOD
#crypto #futures BTC , ETH , SOL ,#trading #BİNANCE
5
2
306

$Q just ripped +245% in a day, and I still can't find a reason.
Quick snapshot of the Binance perp (08:24 WIB): last price 0.1950, after a 24h range of 0.0520 to 0.2263. Roughly $632M traded in 24 hours. Open interest is around $40M, up from about $10.9M a day ago, but in coin terms it only grew about 7%. Most of that "growth" is just price.
What caught my eye is the positioning. About 66% of accounts are short, and the last funding settled at -0.0537% per 4h. Negative funding means shorts are paying longs to stay in. That's a crowded side, and crowded shorts are exactly what squeezes feed on.
The order book isn't comforting either. Within 1% of the mid, there was about $77K on the ask side versus $22K on the bid side when I checked. A book that thin near the price can move hard in either direction.
I went through Quack AI's official X and the usual news sources. No listing, partnership, or announcement explains this move, at least nothing confirmed yet.
When a chart moves like this with zero news, do you stay on the sidelines or treat it as a lesson?
Not financial advice. DYOR.
#Q #QuackAI #Futures $Q
{alpha}(560xc07e1300dc138601fa6b0b59f8d0fa477e690589)
$Q just ripped +245% in a day, and I still can't find a reason.
Quick snapshot of the Binance perp (08:24 WIB): last price 0.1950, after a 24h range of 0.0520 to 0.2263. Roughly $632M traded in 24 hours. Open interest is around $40M, up from about $10.9M a day ago, but in coin terms it only grew about 7%. Most of that "growth" is just price.
What caught my eye is the positioning. About 66% of accounts are short, and the last funding settled at -0.0537% per 4h. Negative funding means shorts are paying longs to stay in. That's a crowded side, and crowded shorts are exactly what squeezes feed on.
The order book isn't comforting either. Within 1% of the mid, there was about $77K on the ask side versus $22K on the bid side when I checked. A book that thin near the price can move hard in either direction.
I went through Quack AI's official X and the usual news sources. No listing, partnership, or announcement explains this move, at least nothing confirmed yet.
When a chart moves like this with zero news, do you stay on the sidelines or treat it as a lesson?
Not financial advice. DYOR.
#Q #QuackAI #Futures $Q
764

·
--
🚀 Binance Futures: Movers to Watch!
The market is showing extreme volatility today 👀
🟢 Top 3 Gainers
🥇 $Q : +271.93%
🥈 $AIN : +89.28%
🥉 $BULLA: +69.35%
🔴 Top 3 Losers
📉 $BTW : -27.27%
📉 $APR: -14.40%
📉 $CAP: -14.27%
📊 What to watch next:
• Is volume supporting the move?
• Are breakouts holding or getting rejected?
• Is open interest rising with price or falling?
• Avoid chasing green candles or blindly shorting red ones.
⚠️ These are 24-hour snapshots, not trade signals. High volatility can reverse quickly. Manage risk first.
#APR #CAP #BULLA #CryptoMarket #Futures
682


·
--
📡 Binance TradFi Perps Keep Expanding
Binance has now listed 227 futures pairs in 2026, and about 70% of them track traditional assets rather than crypto, according to a new tally published today.
The shift started with gold and silver perps earlier this year. October alone added stock and ETF perps including BAC and MDT on October 21, then EIDO, EQT, STM and ABBV on October 26.
All of them trade around the clock in USDT, even while the underlying shares only trade during US market hours. That structure could keep drawing TradFi flow onto crypto venues, though funding caps and leverage still need watching when an underlying gaps on earnings.
📌 Personal opinion, not financial advice. DYOR.
#Binance #TradFi #Futures #CryptoMarket
$XAUUSDT $BACUSDT $ABBVUSDT
152

·
--
leverage lets you control more with less. you put down one thousand. exchange lends you nine thousand. now you trade ten thousand total. that's ten x leverage. if the move goes your way by five percent, your position gains five hundred. on your one thousand, that's a fifty percent return. but if it drops five percent, you lose five hundred. half your margin gone. at ten percent against you, you're wiped out. the exchange closes the position to protect their loan. that's liquidation. higher leverage means thinner rope. two x gives room. fifty x snaps fast. most beginners blow up because they size for the win, not the loss. pros use low leverage, wide stops. they survive the noise. leverage is a tool, not a strategy. respect the math or it respects you. #Leverage #RiskManagement #Trading #Futures
leverage lets you control more with less. you put down one thousand. exchange lends you nine thousand. now you trade ten thousand total. that's ten x leverage. if the move goes your way by five percent, your position gains five hundred. on your one thousand, that's a fifty percent return. but if it drops five percent, you lose five hundred. half your margin gone. at ten percent against you, you're wiped out. the exchange closes the position to protect their loan. that's liquidation. higher leverage means thinner rope. two x gives room. fifty x snaps fast. most beginners blow up because they size for the win, not the loss. pros use low leverage, wide stops. they survive the noise. leverage is a tool, not a strategy. respect the math or it respects you. #Leverage #RiskManagement #Trading #Futures
73

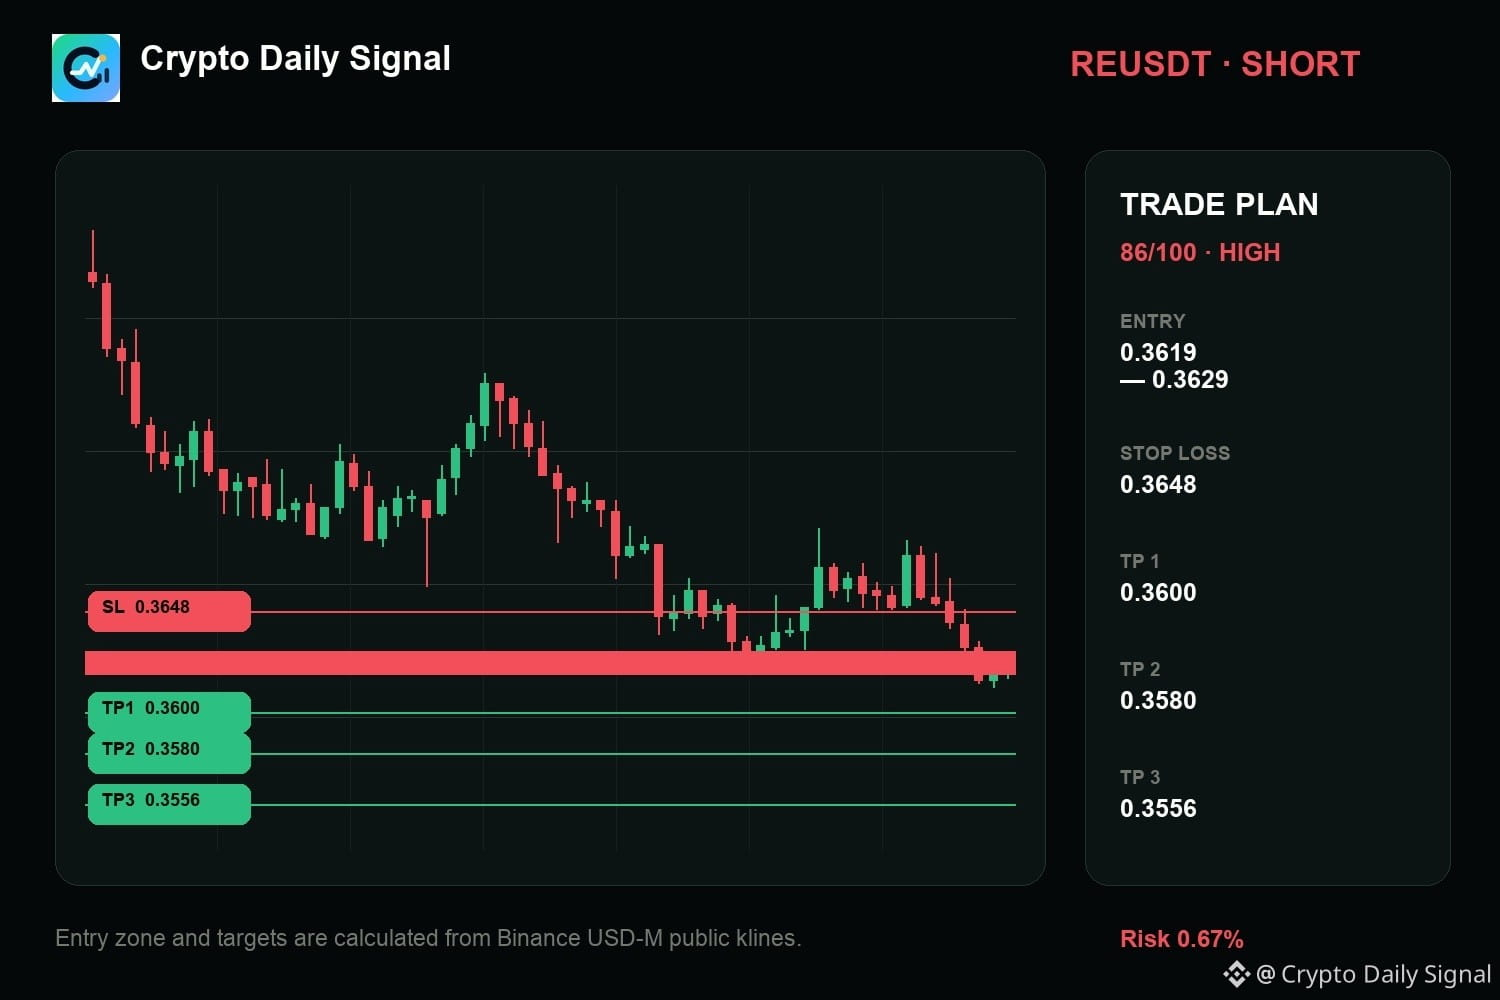
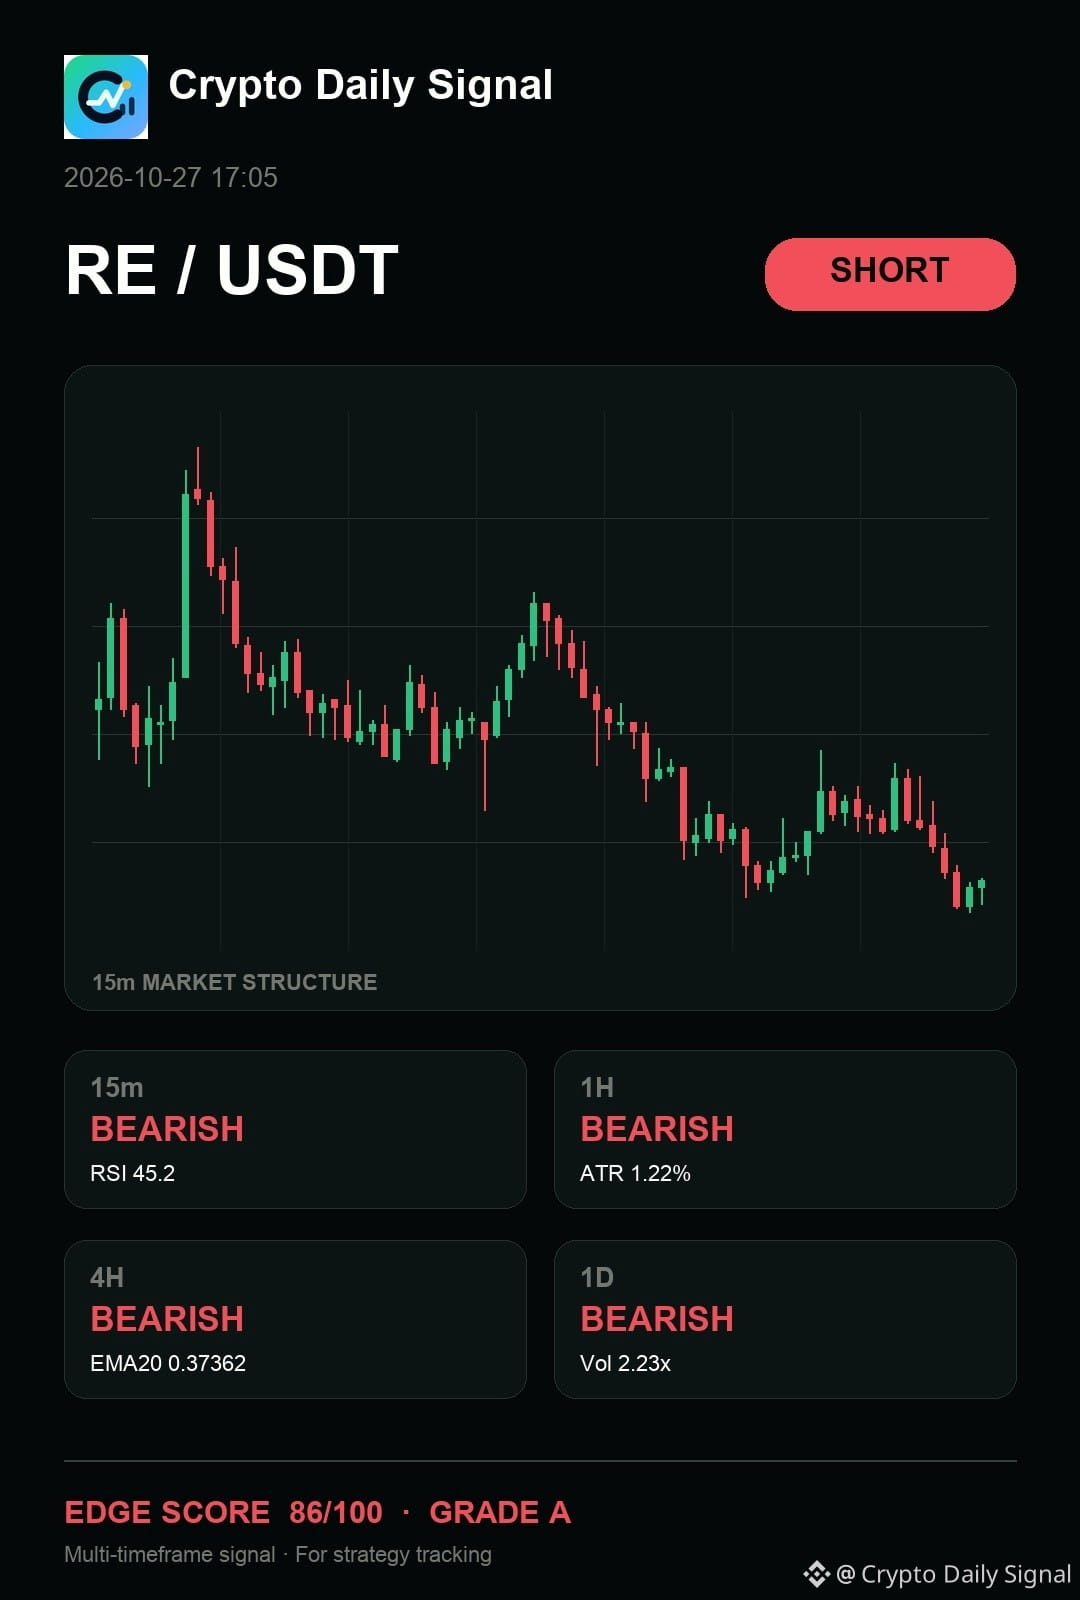
$RE — my two cents, I am reading it like it has not invalidated the short case because the price is hugging the lower side of its current range while the longer timeframes confirm a downtrend. For this to work, the price needs to cleanly break under the range floor on a down candle. If it manages to close above the recent high, the bearish angle collapses.
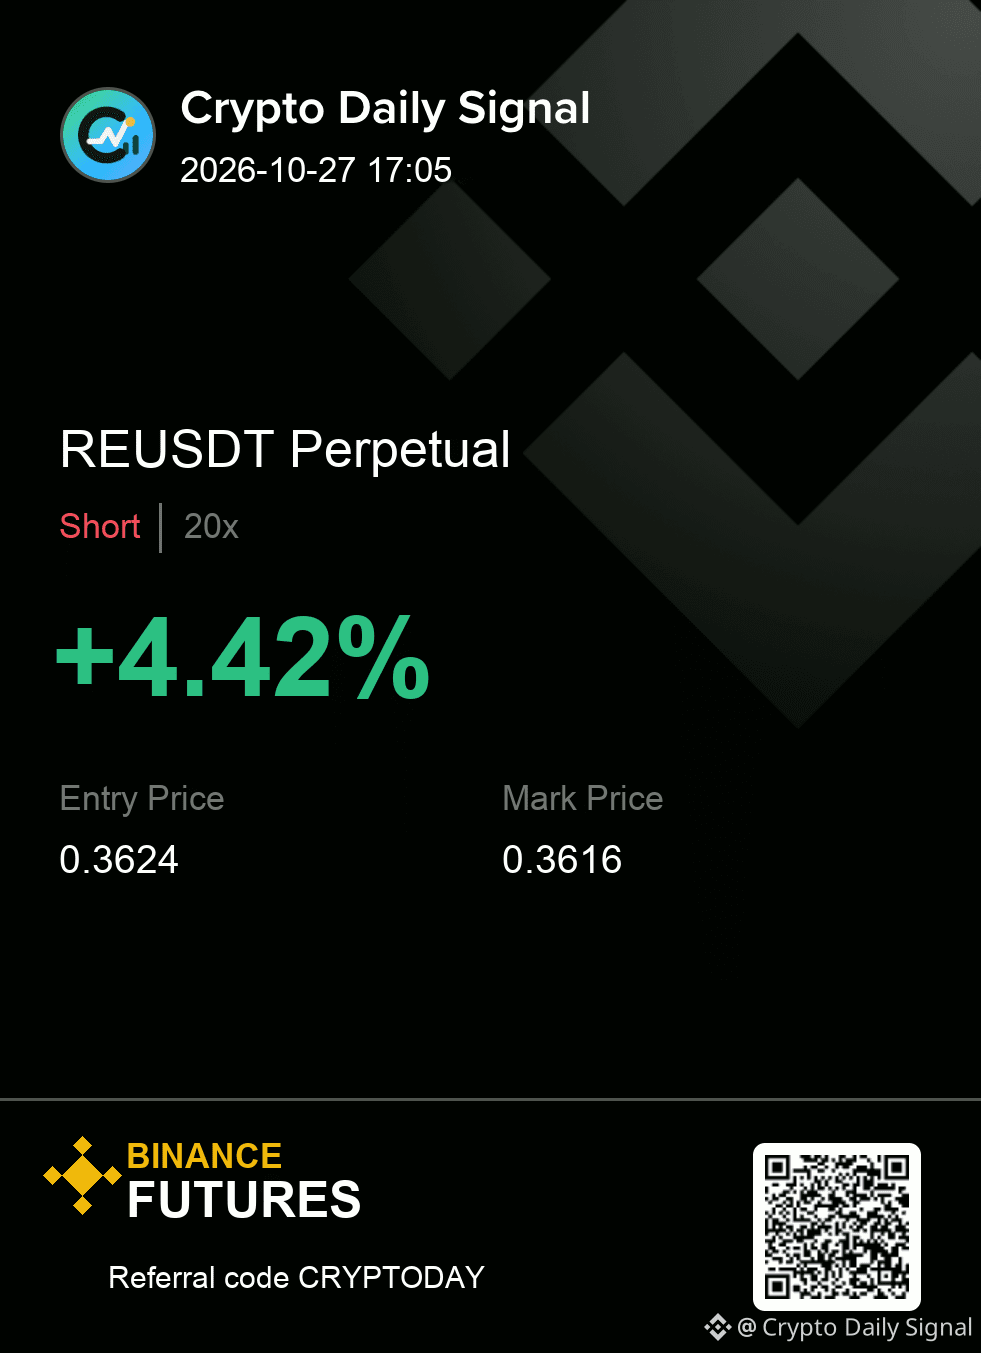
REUSDT SHORT map
Entry → 0.3619 - 0.3629
SL → 0.3648
TP → 0.3600 · 0.3580 · 0.3556
#Futures
{future}(REUSDT)
$RE — my two cents, I am reading it like it has not invalidated the short case because the price is hugging the lower side of its current range while the longer timeframes confirm a downtrend. For this to work, the price needs to cleanly break under the range floor on a down candle. If it manages to close above the recent high, the bearish angle collapses.
REUSDT SHORT map
Entry → 0.3619 - 0.3629
SL → 0.3648
TP → 0.3600 · 0.3580 · 0.3556
#Futures
REUSDT SHORT map
Entry → 0.3619 - 0.3629
SL → 0.3648
TP → 0.3600 · 0.3580 · 0.3556
#Futures
9

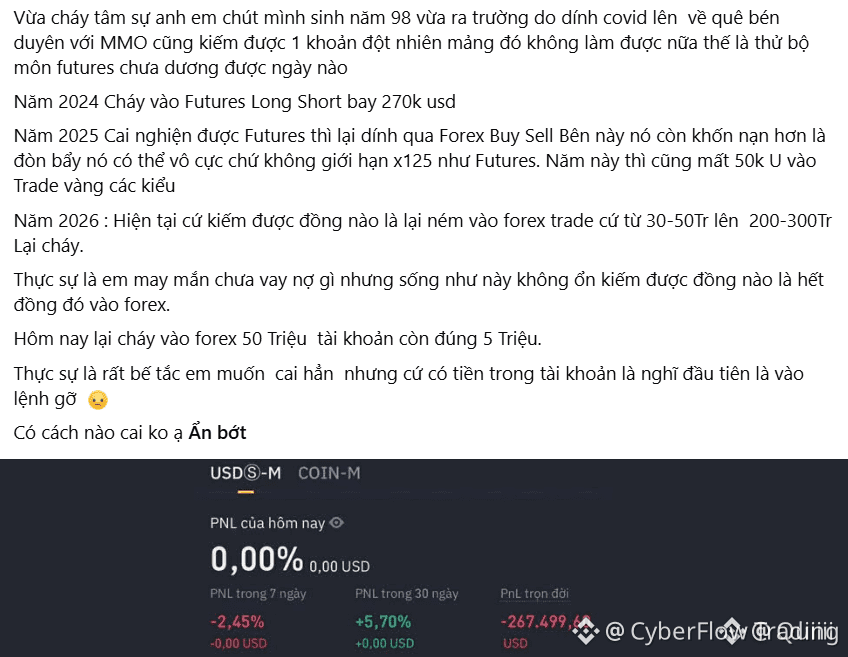
🚀 $BTC FUTURES SINKING INTO DOPAMINE TRAP? 📉
The dopamine‑driven chase on futures is a classic liquidity sweep, where every pull‑back feeds the next wave of bids. 📊 On the 4‑hour chart the order flow is screaming a massive sell‑side imbalance, and smart money is quietly loading the dip.
If you’re still tossing 300 million VND into the abyss, remember the market rewards patience over panic. ⚡ A tight stop and a clear exit can turn a nightmare into a controlled swing. 💬 Are you ready to flip the script before the next liquidation wave? 👇
⚠️ Not financial advice. Always manage your risk. 🛡️
🏷️ #BTC #Futures #RiskManagement #Crypto
🔥 💎
20
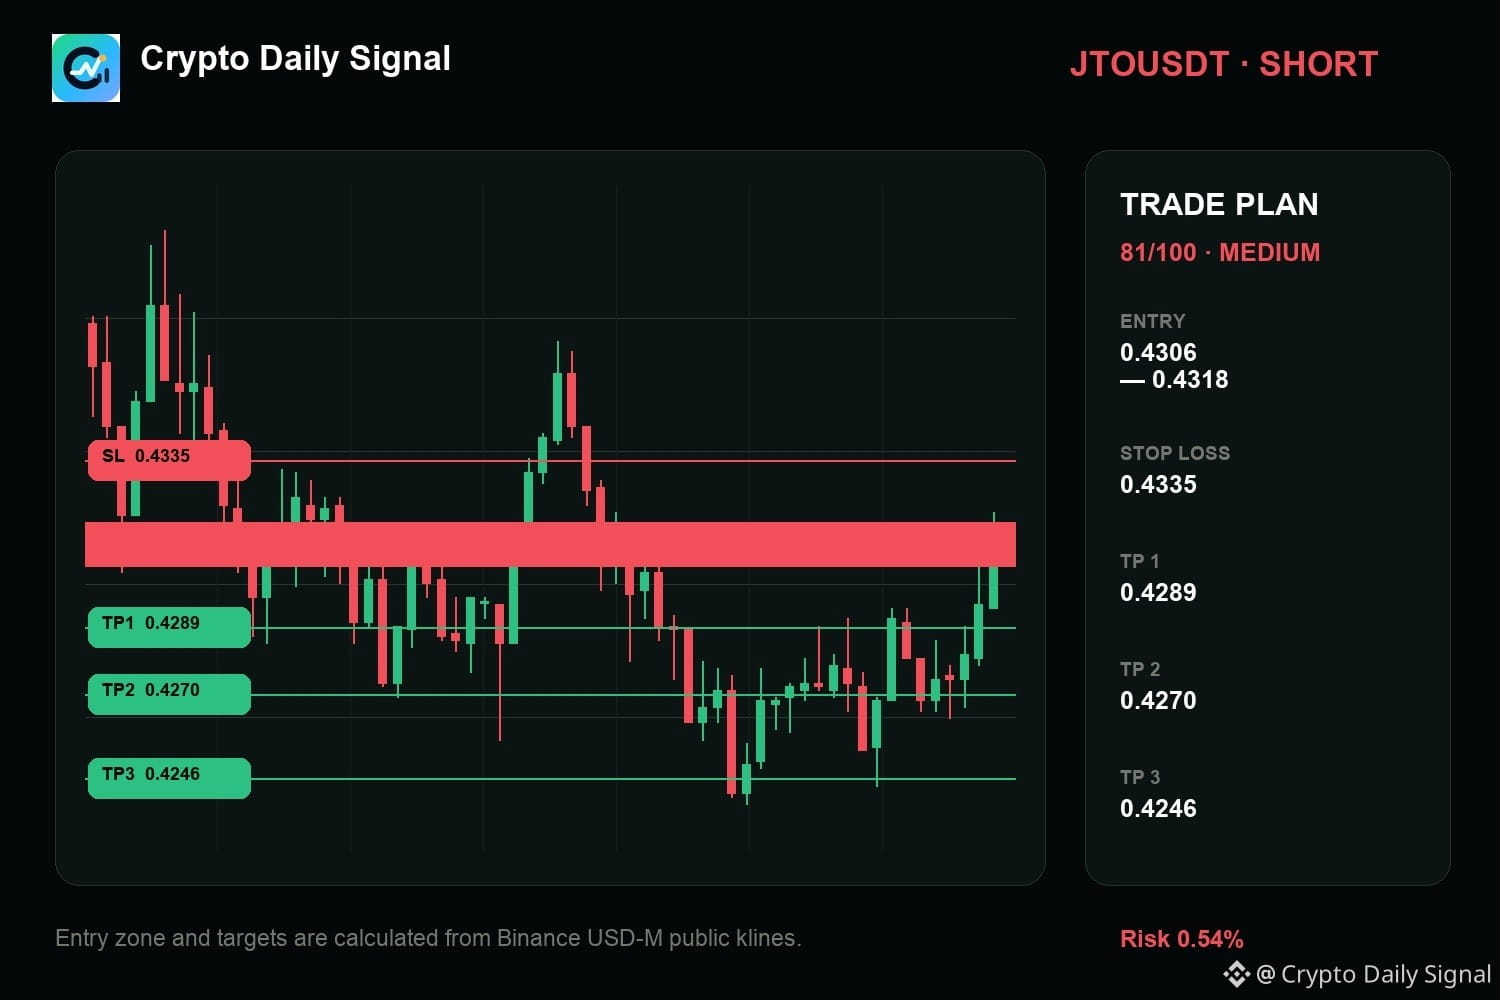
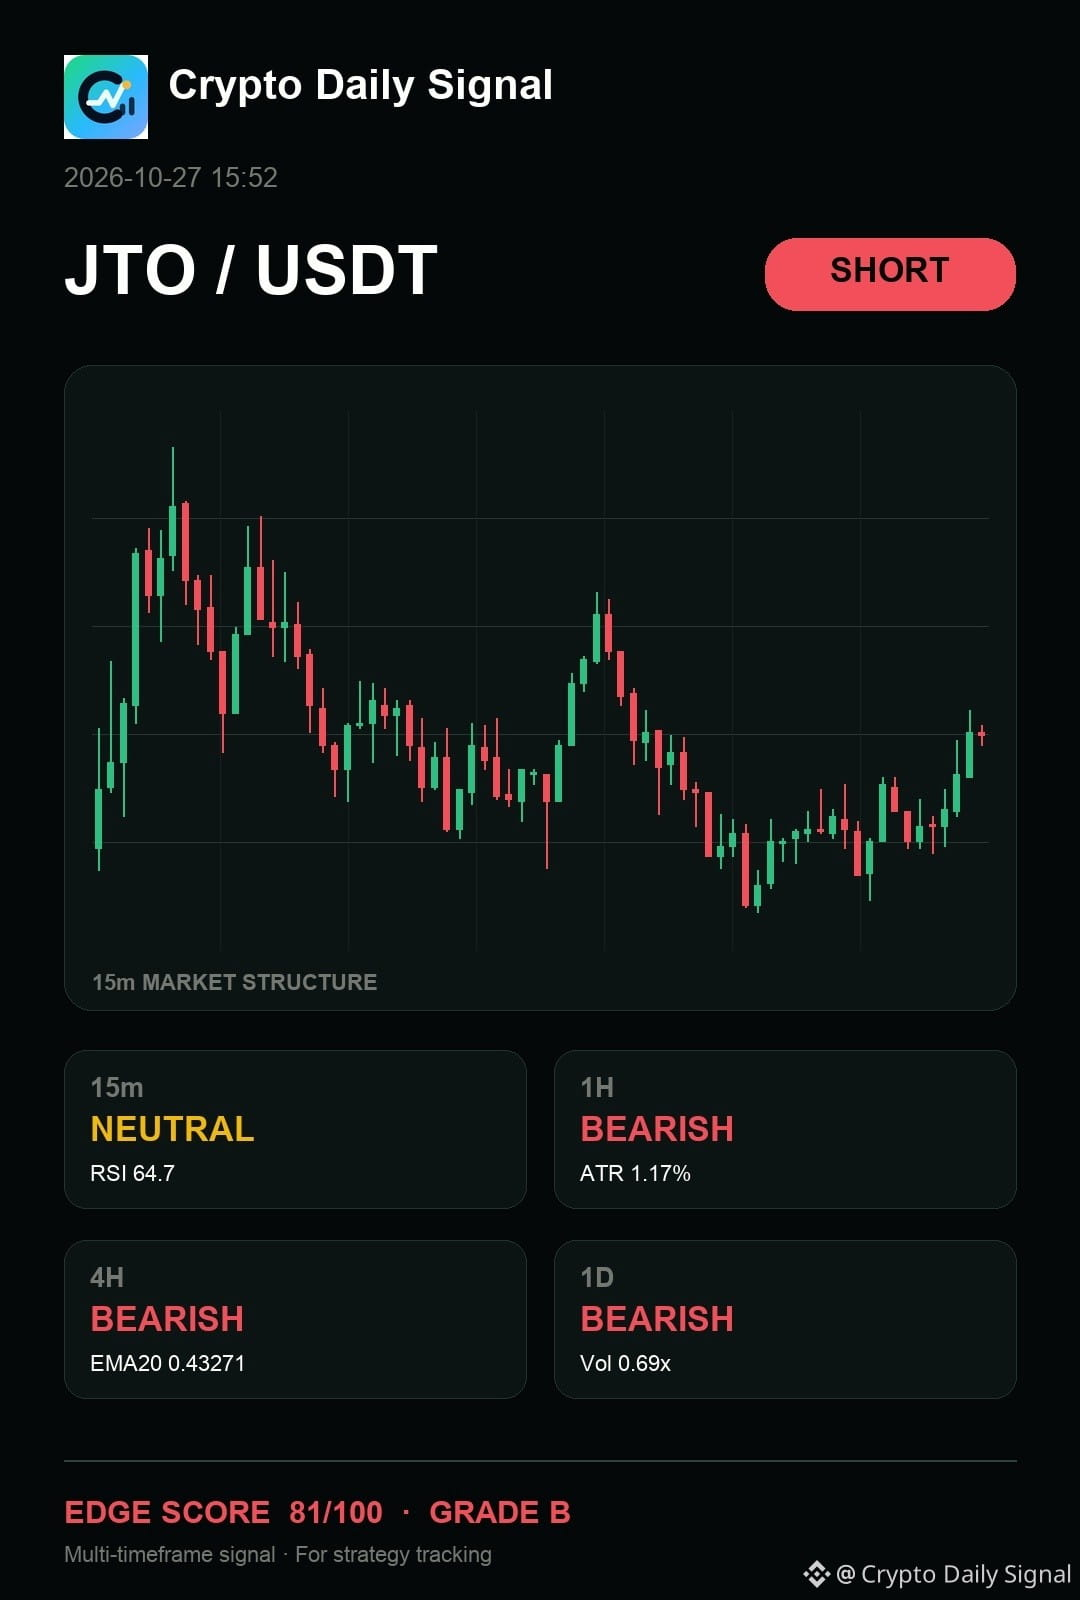
$JTO — honestly, the chart still says it is a patience trade on the short side. The hourly and four-hour charts show a definite bearish slant, and the price hasn't managed a clean break above that immediate resistance. The recent candle sequence fits the lower-high pattern, which supports the sellers. If the price manages to close below the immediate support level, that would solidify the direction.
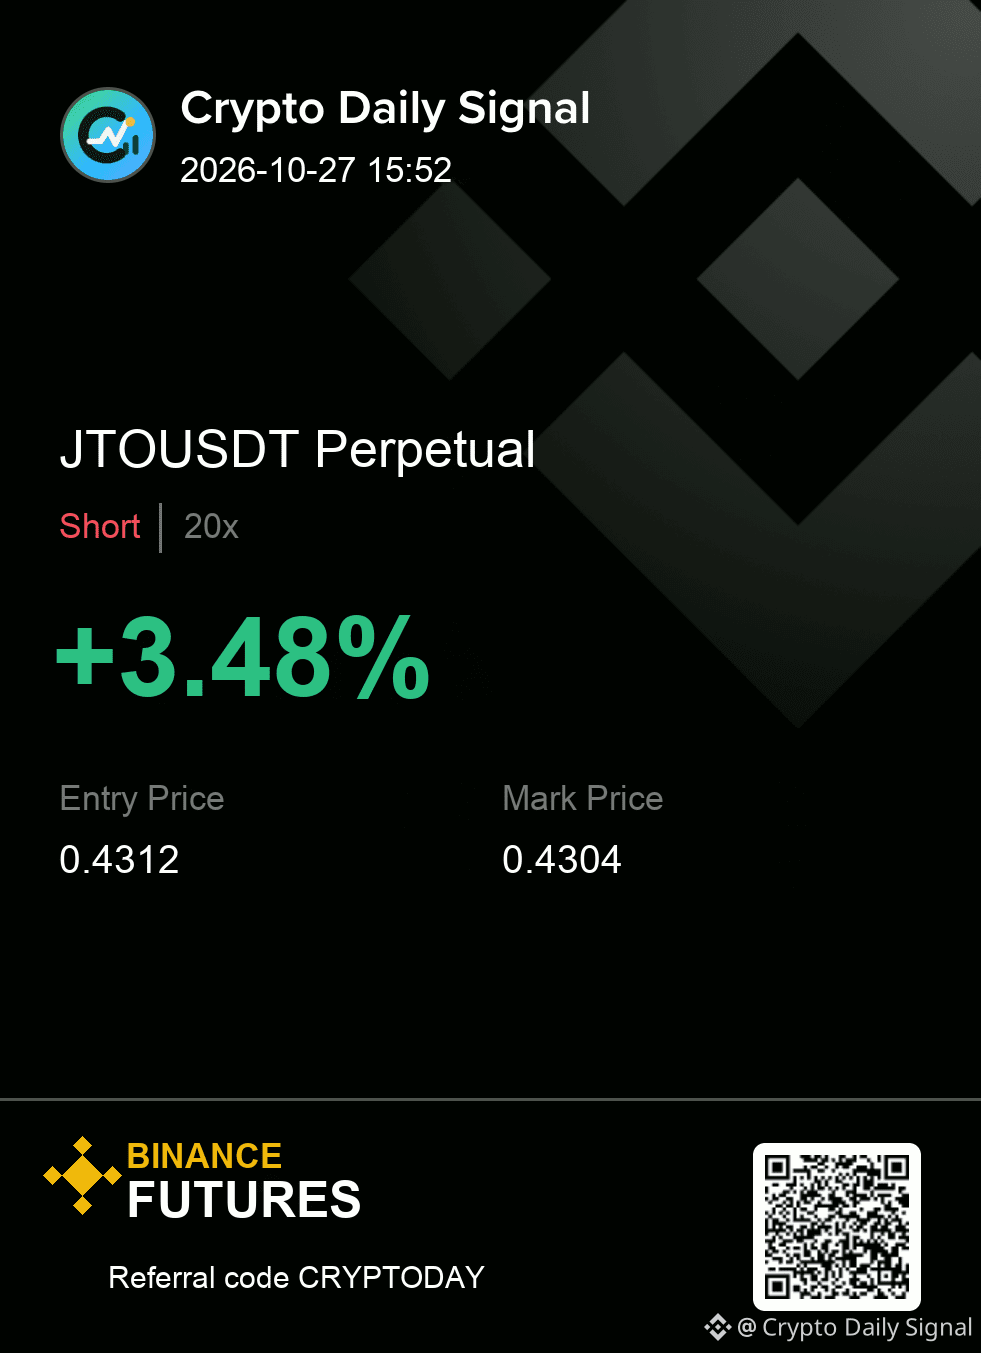
Trade Plan — JTOUSDT SHORT
Entry: 0.4306 - 0.4318
Stop Loss: 0.4335
TP1: 0.4289 | TP2: 0.4270 | TP3: 0.4246
#Futures
{future}(JTOUSDT)
$JTO — honestly, the chart still says it is a patience trade on the short side. The hourly and four-hour charts show a definite bearish slant, and the price hasn't managed a clean break above that immediate resistance. The recent candle sequence fits the lower-high pattern, which supports the sellers. If the price manages to close below the immediate support level, that would solidify the direction.
Trade Plan — JTOUSDT SHORT
Entry: 0.4306 - 0.4318
Stop Loss: 0.4335
TP1: 0.4289 | TP2: 0.4270 | TP3: 0.4246
#Futures
Trade Plan — JTOUSDT SHORT
Entry: 0.4306 - 0.4318
Stop Loss: 0.4335
TP1: 0.4289 | TP2: 0.4270 | TP3: 0.4246
#Futures
9
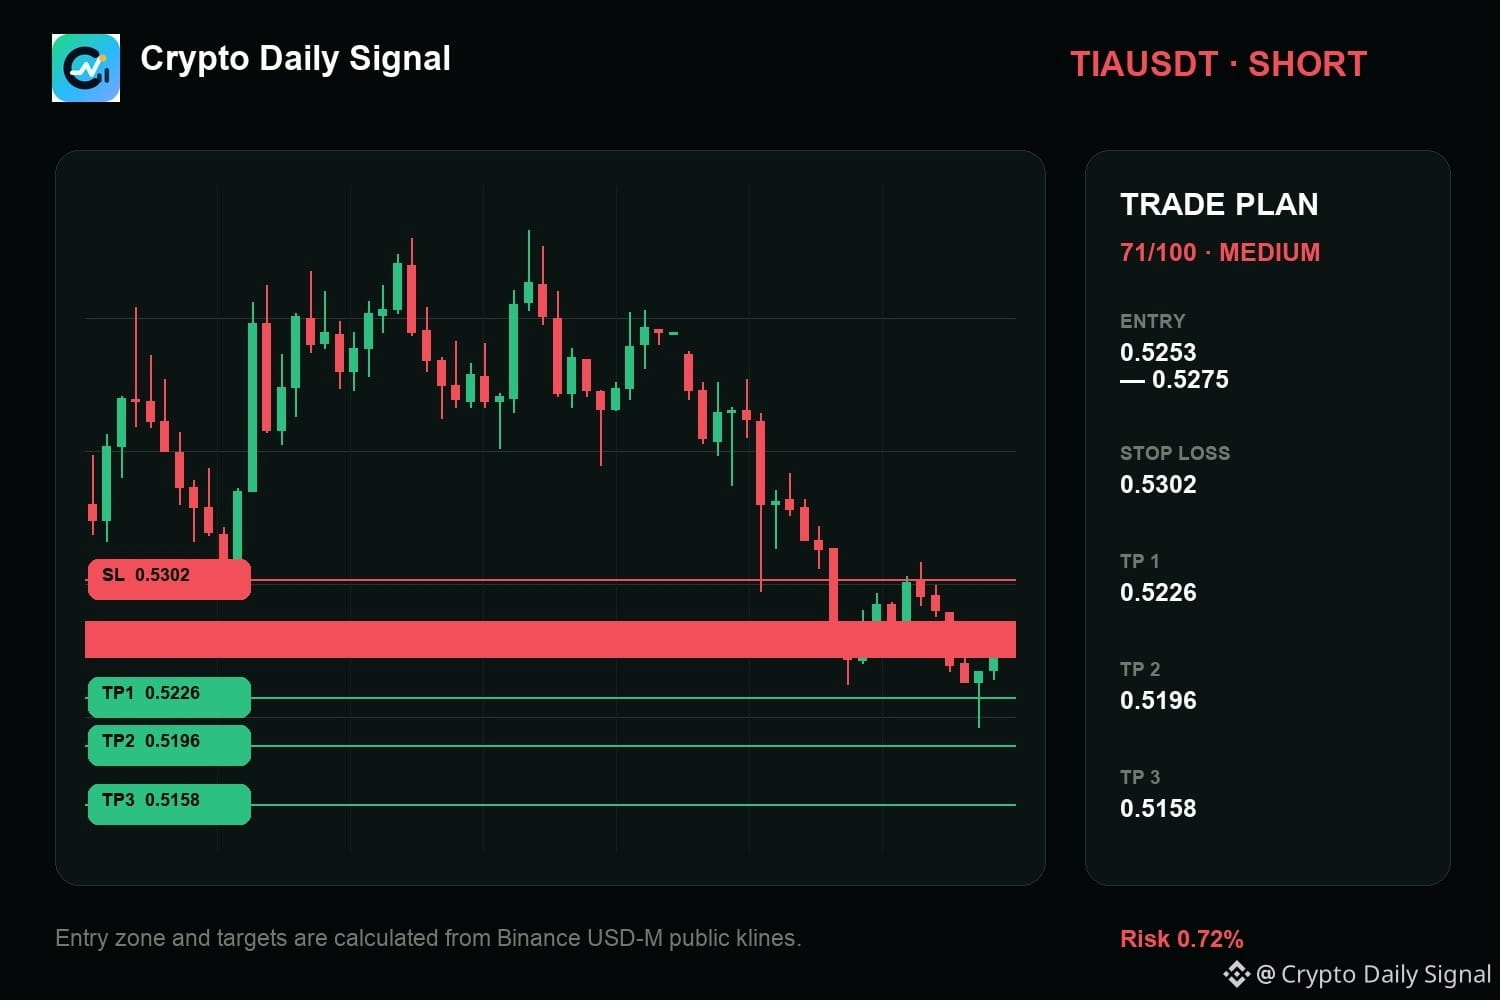
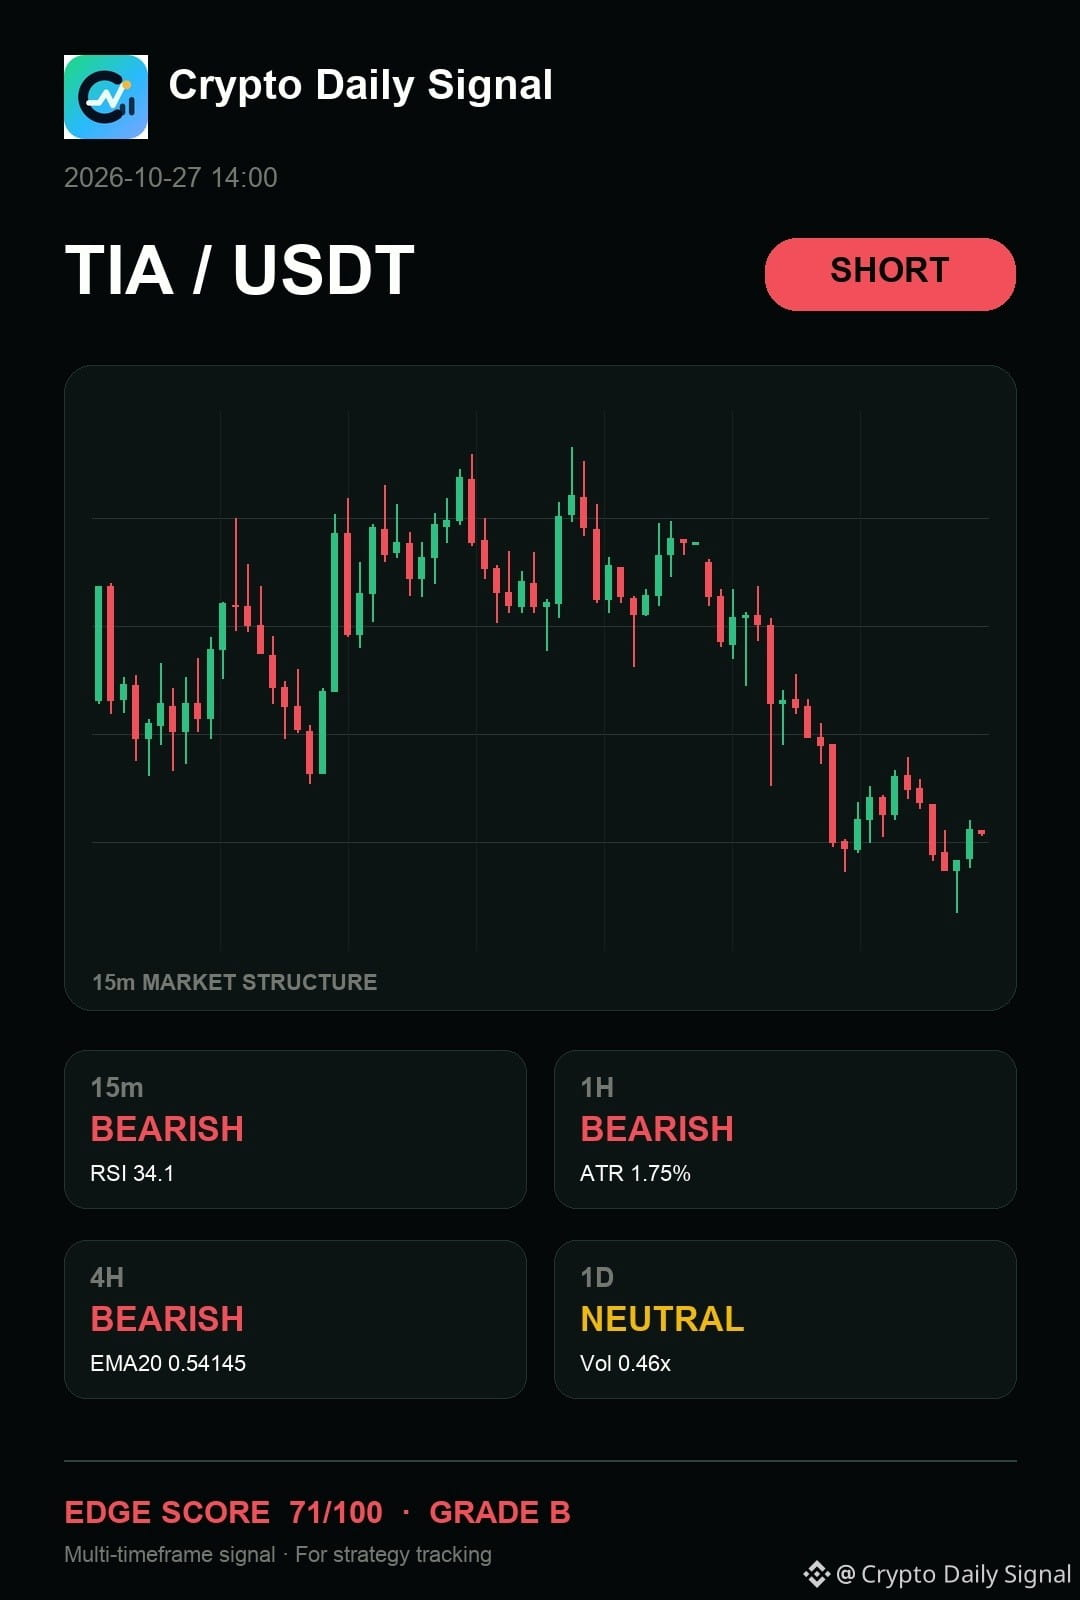
$TIA still offers the cleaner bearish argument because the recent move up got chopped short against the upper boundary of the trading area. We are seeing a pattern of lower highs playing out across the shorter timeframes, and the momentum on the fifteen-minute chart is not cooperating for buyers. A clear drop below the low of this consolidation pattern would confirm the short direction for me.
What would you need to see before putting risk behind this idea?
Trade Plan — TIAUSDT SHORT
Entry: 0.5253 - 0.5275
Stop Loss: 0.5302
TP1: 0.5226 | TP2: 0.5196 | TP3: 0.5158
#Futures
{future}(TIAUSDT)
$TIA still offers the cleaner bearish argument because the recent move up got chopped short against the upper boundary of the trading area. We are seeing a pattern of lower highs playing out across the shorter timeframes, and the momentum on the fifteen-minute chart is not cooperating for buyers. A clear drop below the low of this consolidation pattern would confirm the short direction for me.
What would you need to see before putting risk behind this idea?
Trade Plan — TIAUSDT SHORT
Entry: 0.5253 - 0.5275
Stop Loss: 0.5302
TP1: 0.5226 | TP2: 0.5196 | TP3: 0.5158
#Futures
What would you need to see before putting risk behind this idea?
Trade Plan — TIAUSDT SHORT
Entry: 0.5253 - 0.5275
Stop Loss: 0.5302
TP1: 0.5226 | TP2: 0.5196 | TP3: 0.5158
#Futures
14
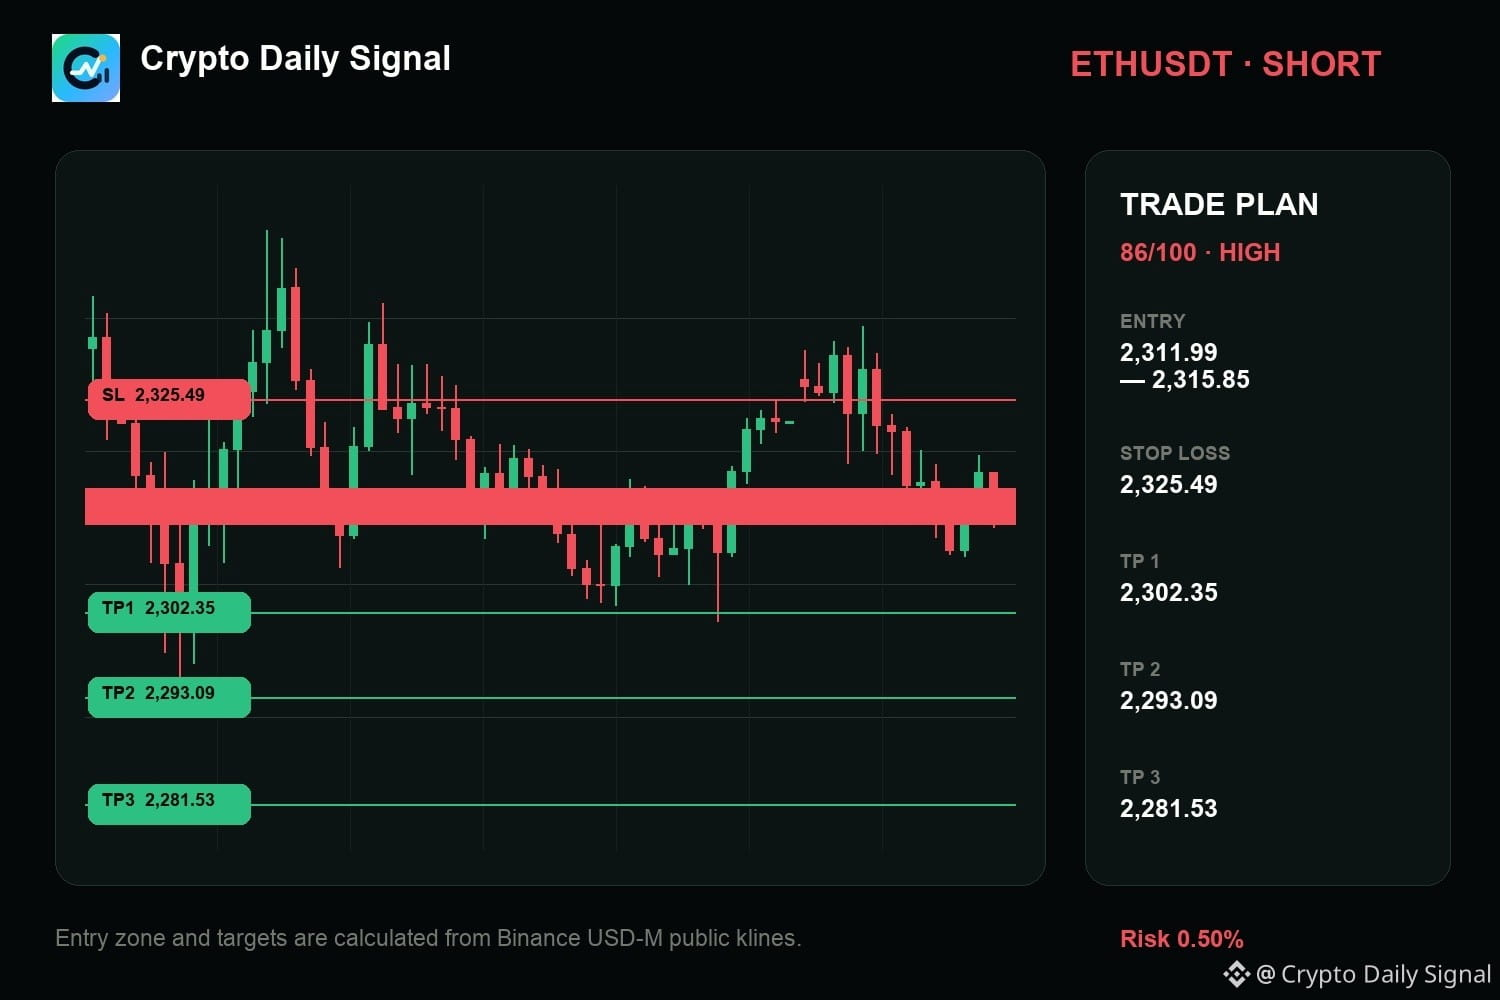
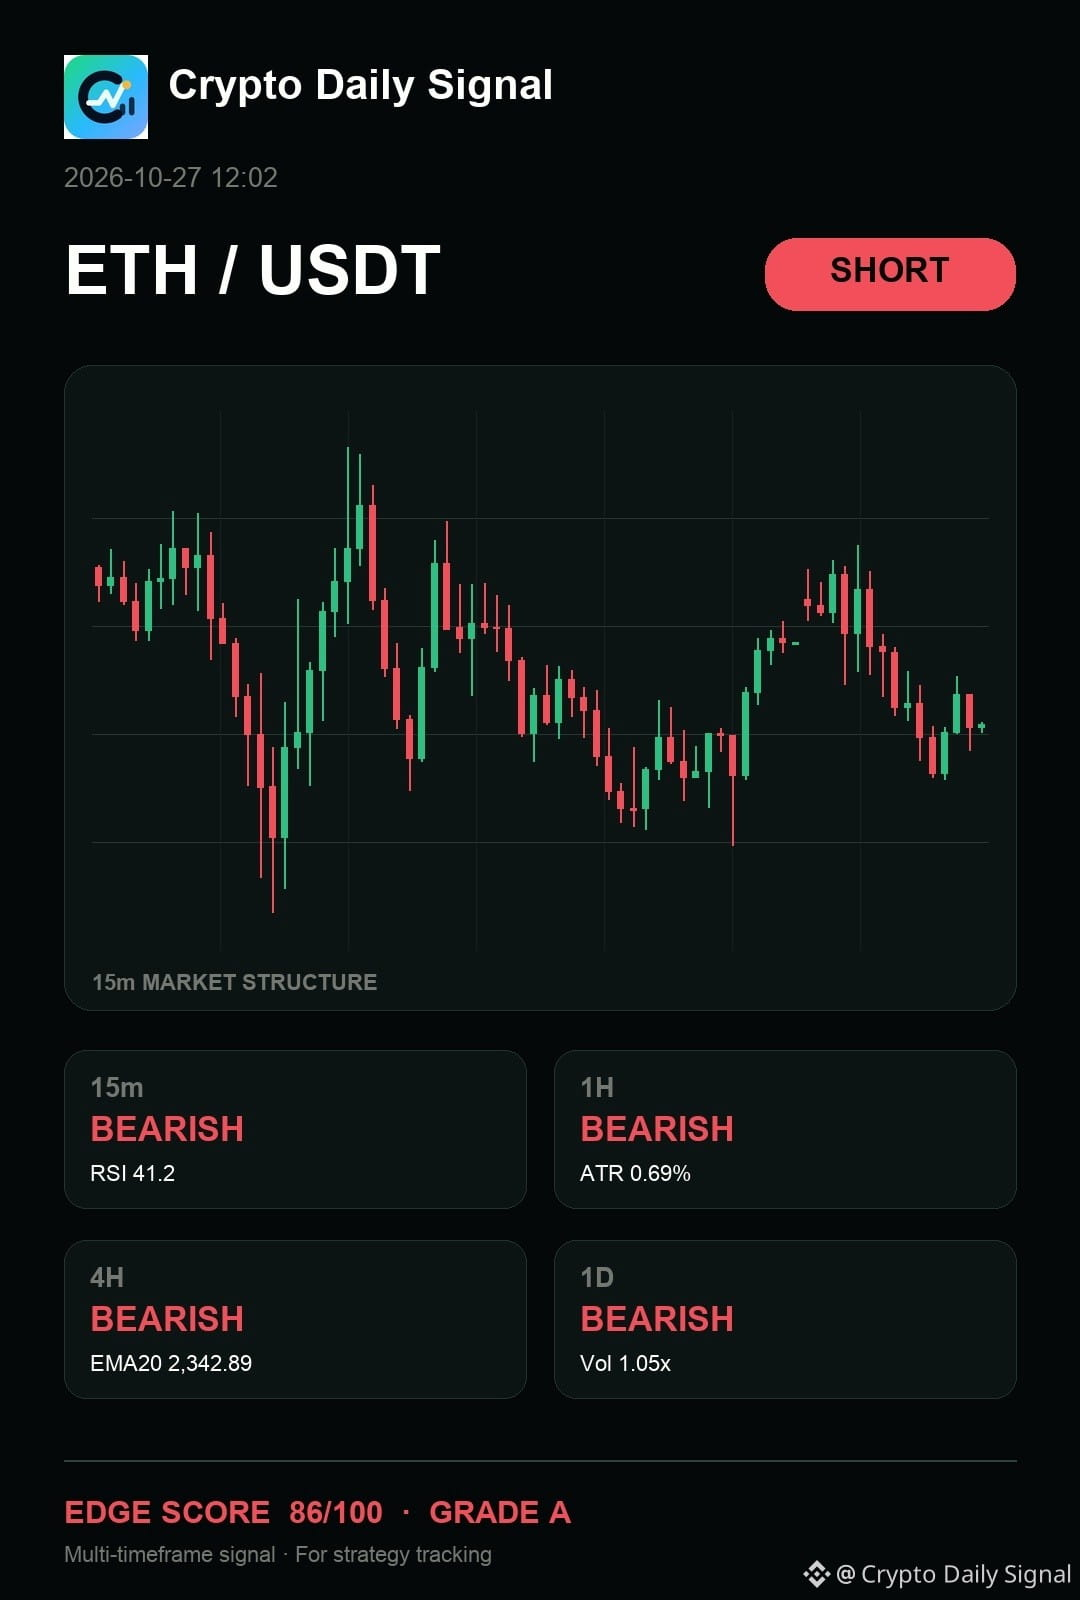
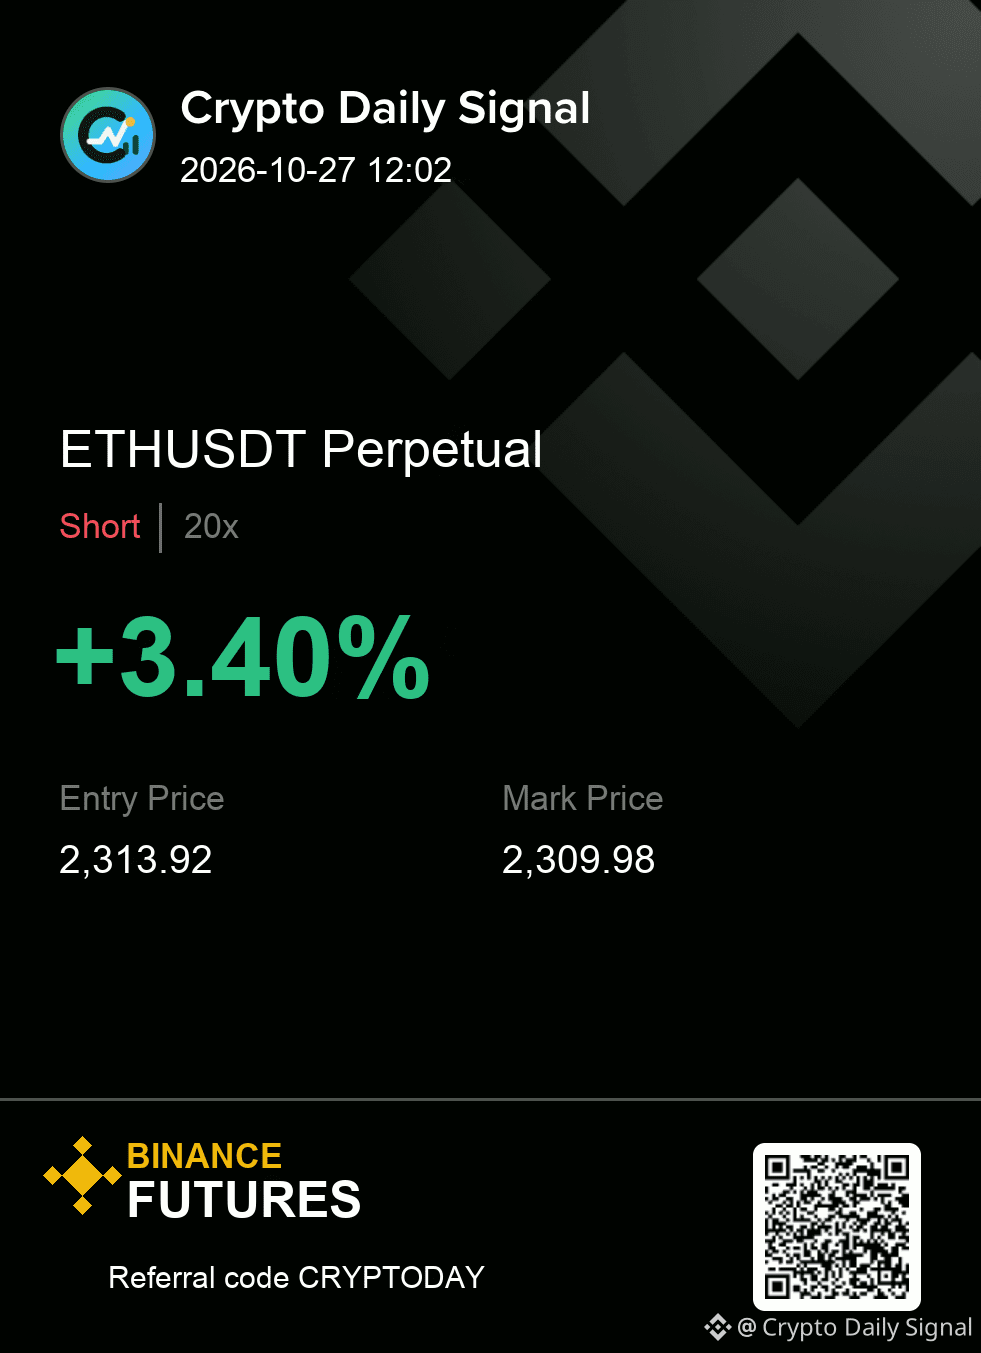
$ETH — tbh, I keep coming back to how it has my attention on the sell side. Lower highs are forming on the shorter timeframes, suggesting downward pressure persists across the daily and four-hour trends. A move below the current trading range bottom would strengthen the bearish picture considerably.
Execution plan (ETHUSDT — SHORT)
Entry: 2,311.99 - 2,315.85 | SL: 2,325.49
Take profit: 2,302.35 → 2,293.09 → 2,281.53
#Futures
{future}(ETHUSDT)
$ETH — tbh, I keep coming back to how it has my attention on the sell side. Lower highs are forming on the shorter timeframes, suggesting downward pressure persists across the daily and four-hour trends. A move below the current trading range bottom would strengthen the bearish picture considerably.
Execution plan (ETHUSDT — SHORT)
Entry: 2,311.99 - 2,315.85 | SL: 2,325.49
Take profit: 2,302.35 → 2,293.09 → 2,281.53
#Futures
Execution plan (ETHUSDT — SHORT)
Entry: 2,311.99 - 2,315.85 | SL: 2,325.49
Take profit: 2,302.35 → 2,293.09 → 2,281.53
#Futures
18
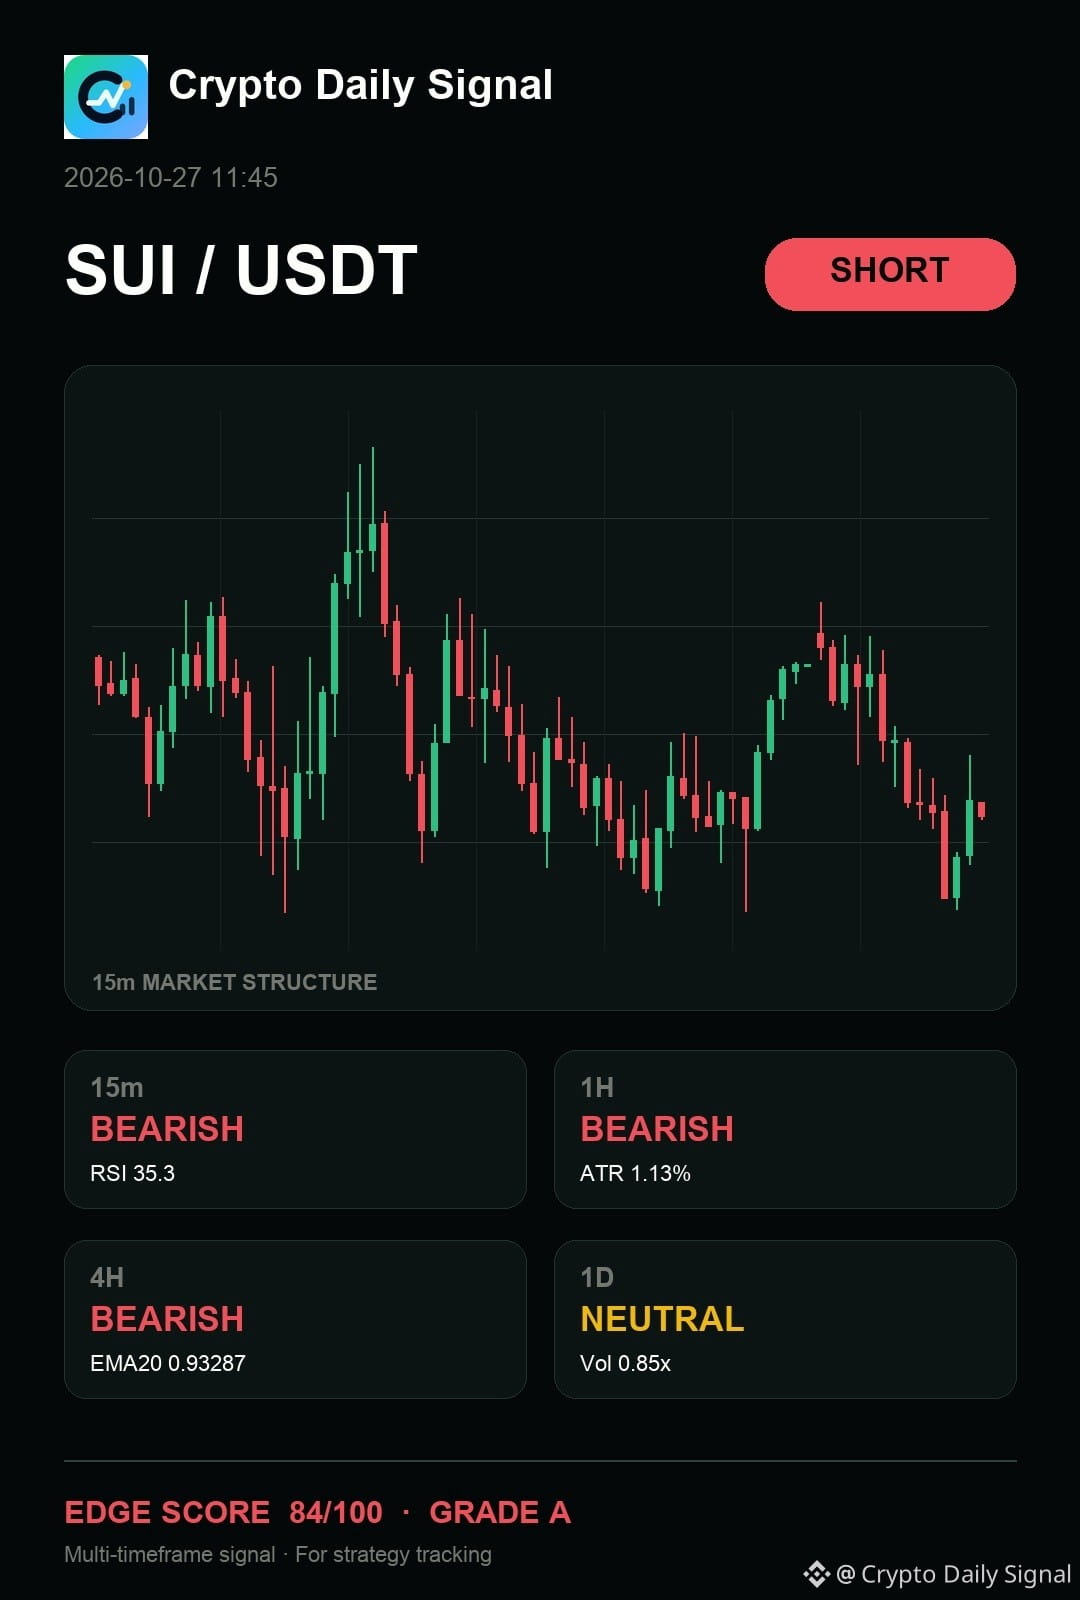
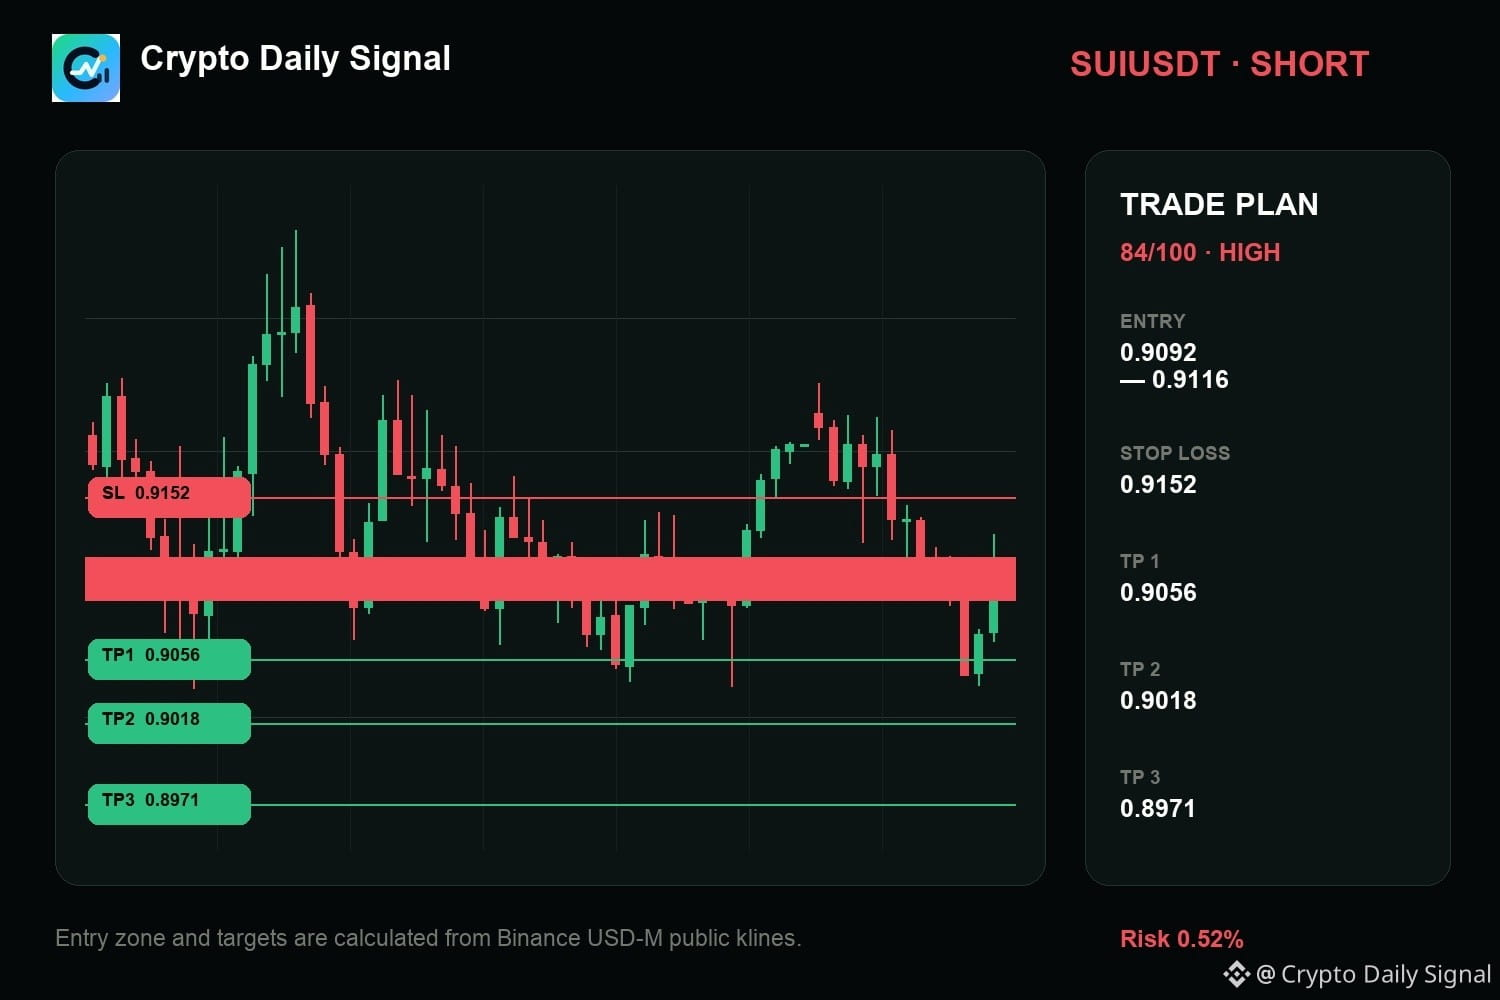
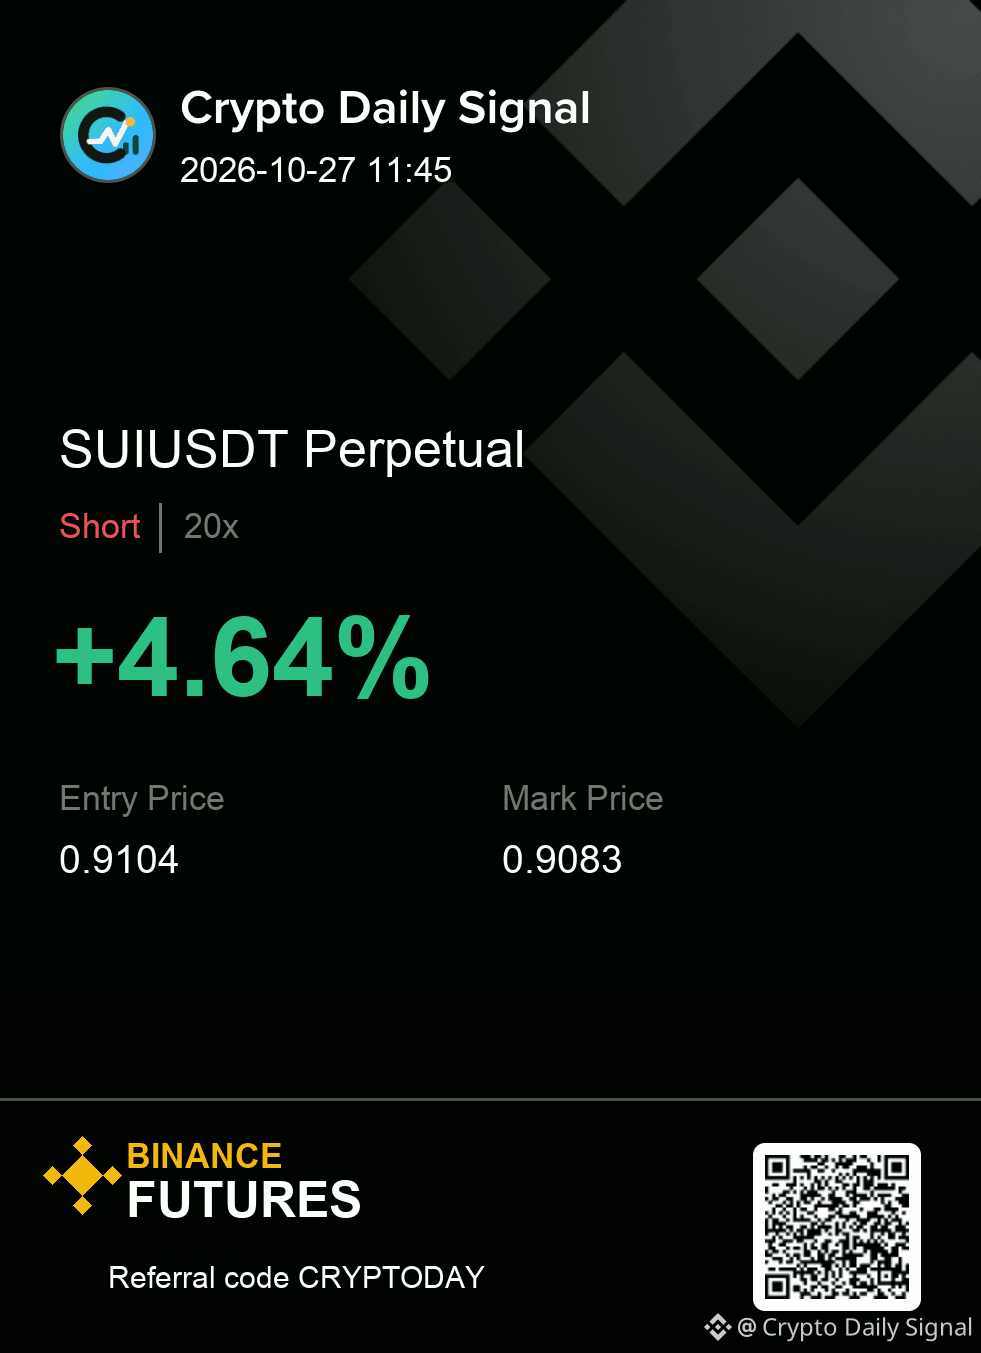
$SUI sits on my short-side watchlist because recent price action shows lower highs while it stays inside a descending channel. This short view gets stronger if it breaks that channel floor, but a solid move above the last high kills the argument.
The levels matter more than the prediction. Size it accordingly.
My levels for SUIUSDT — SHORT
Entry zone 0.9092 - 0.9116
Risk line 0.9152
Targets 0.9056 / 0.9018 / 0.8971
#Futures
{future}(SUIUSDT)
$SUI sits on my short-side watchlist because recent price action shows lower highs while it stays inside a descending channel. This short view gets stronger if it breaks that channel floor, but a solid move above the last high kills the argument.
The levels matter more than the prediction. Size it accordingly.
My levels for SUIUSDT — SHORT
Entry zone 0.9092 - 0.9116
Risk line 0.9152
Targets 0.9056 / 0.9018 / 0.8971
#Futures
The levels matter more than the prediction. Size it accordingly.
My levels for SUIUSDT — SHORT
Entry zone 0.9092 - 0.9116
Risk line 0.9152
Targets 0.9056 / 0.9018 / 0.8971
#Futures
2
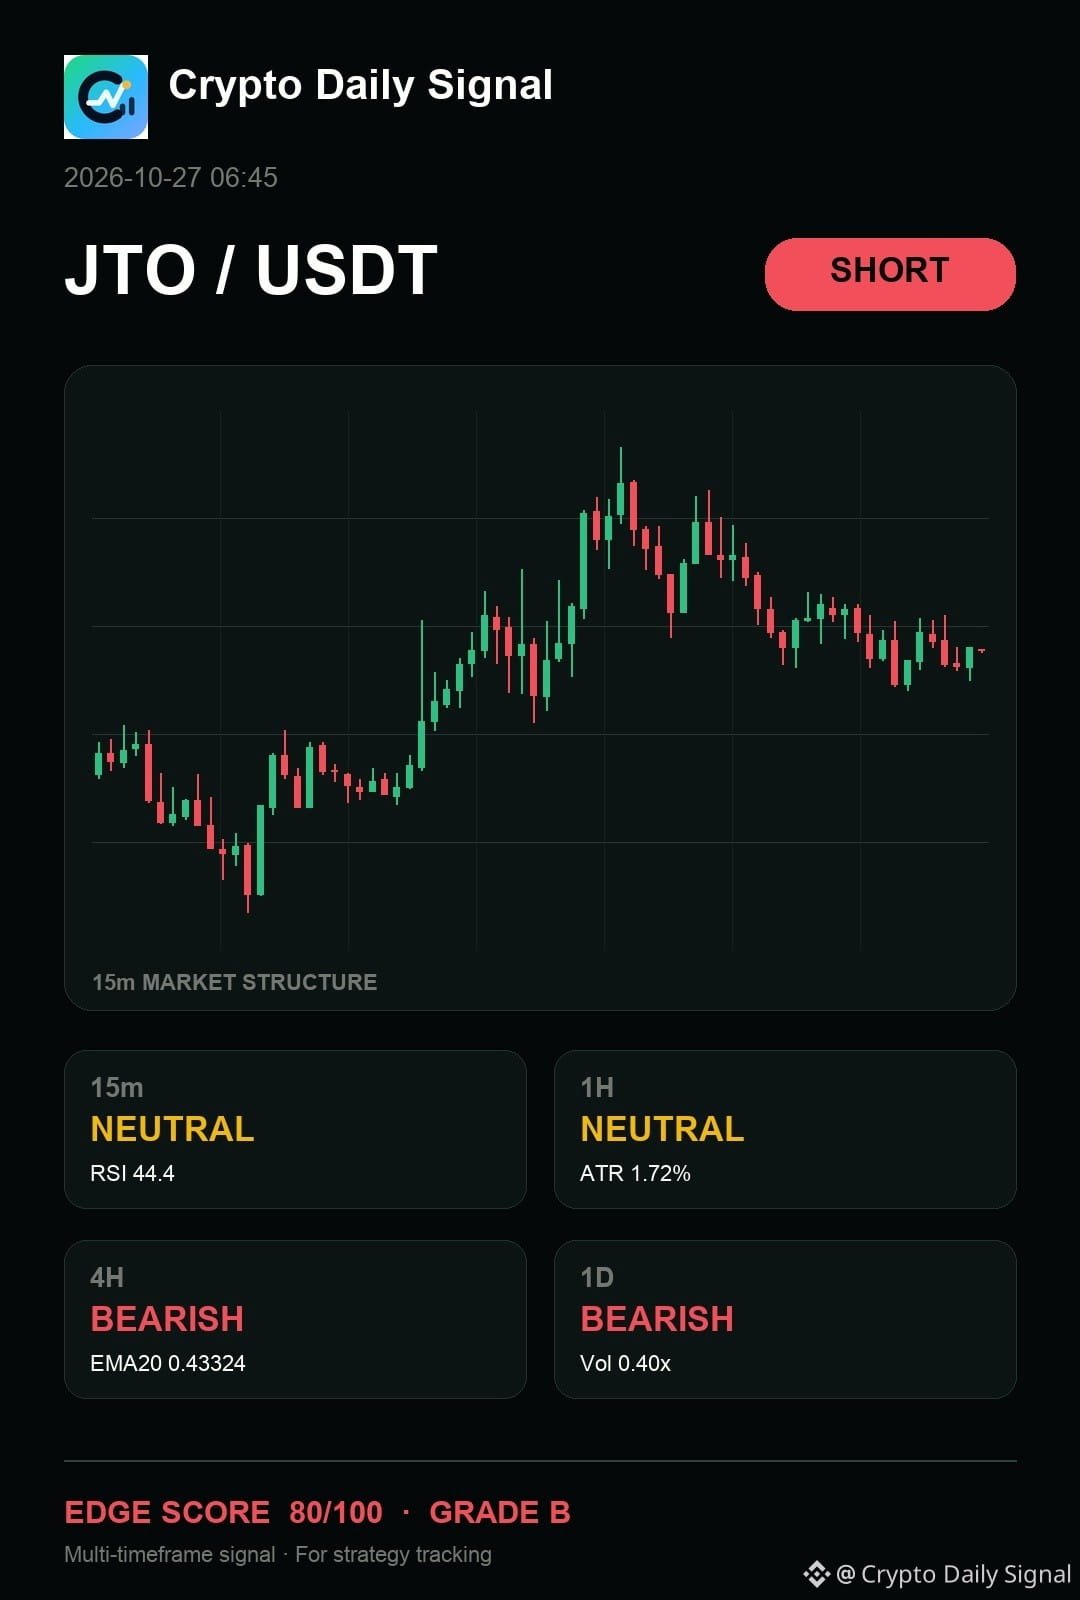
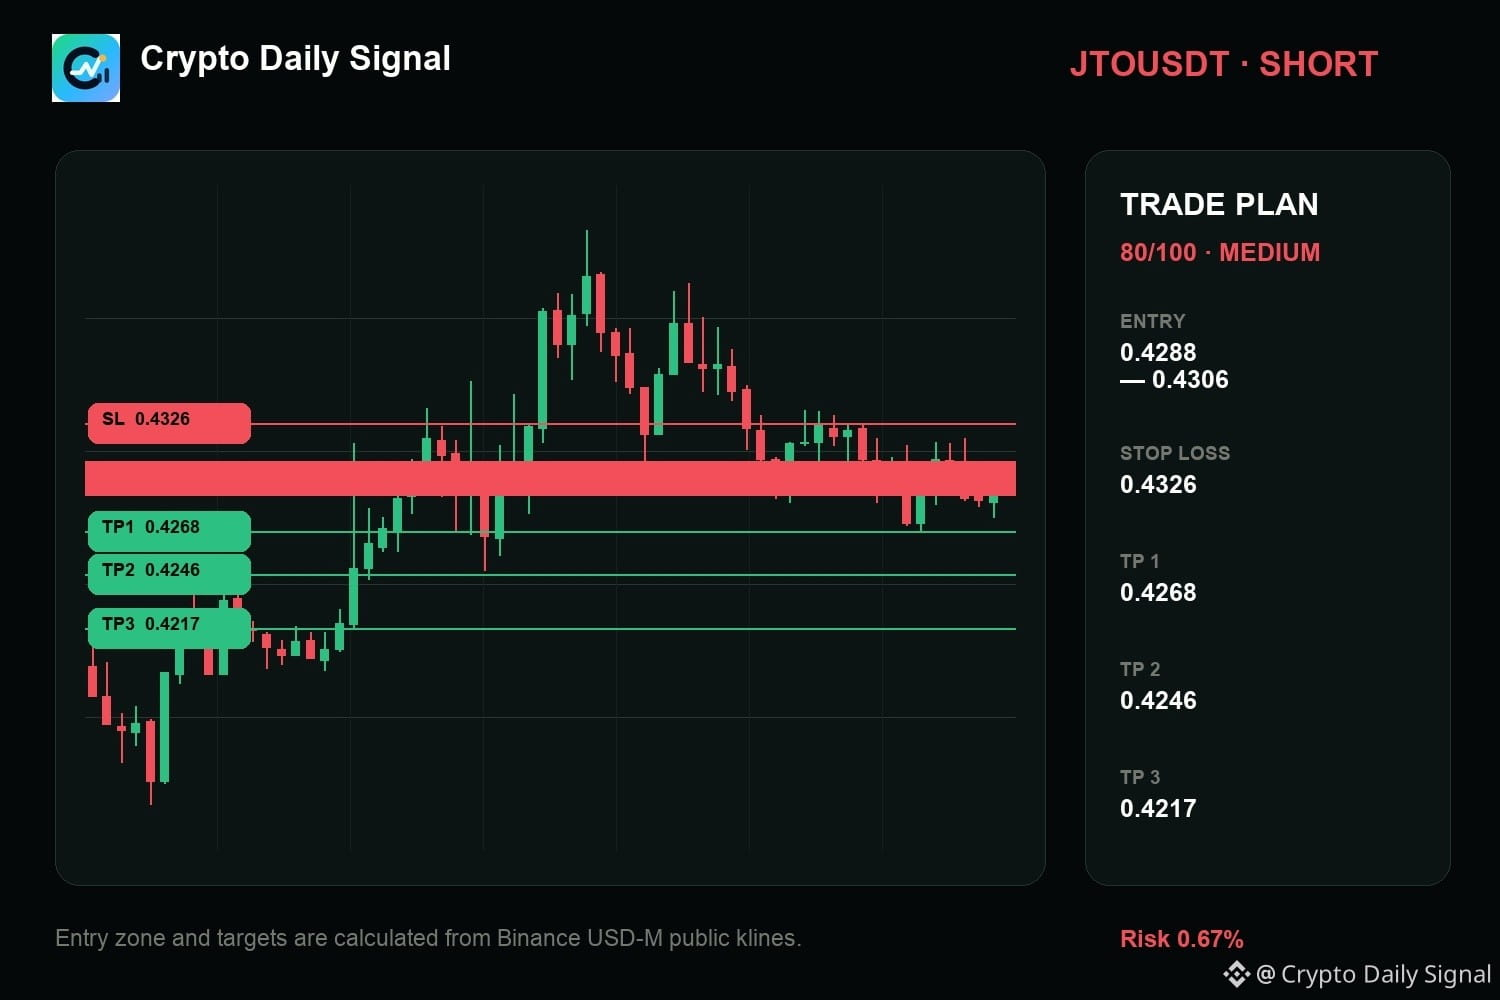
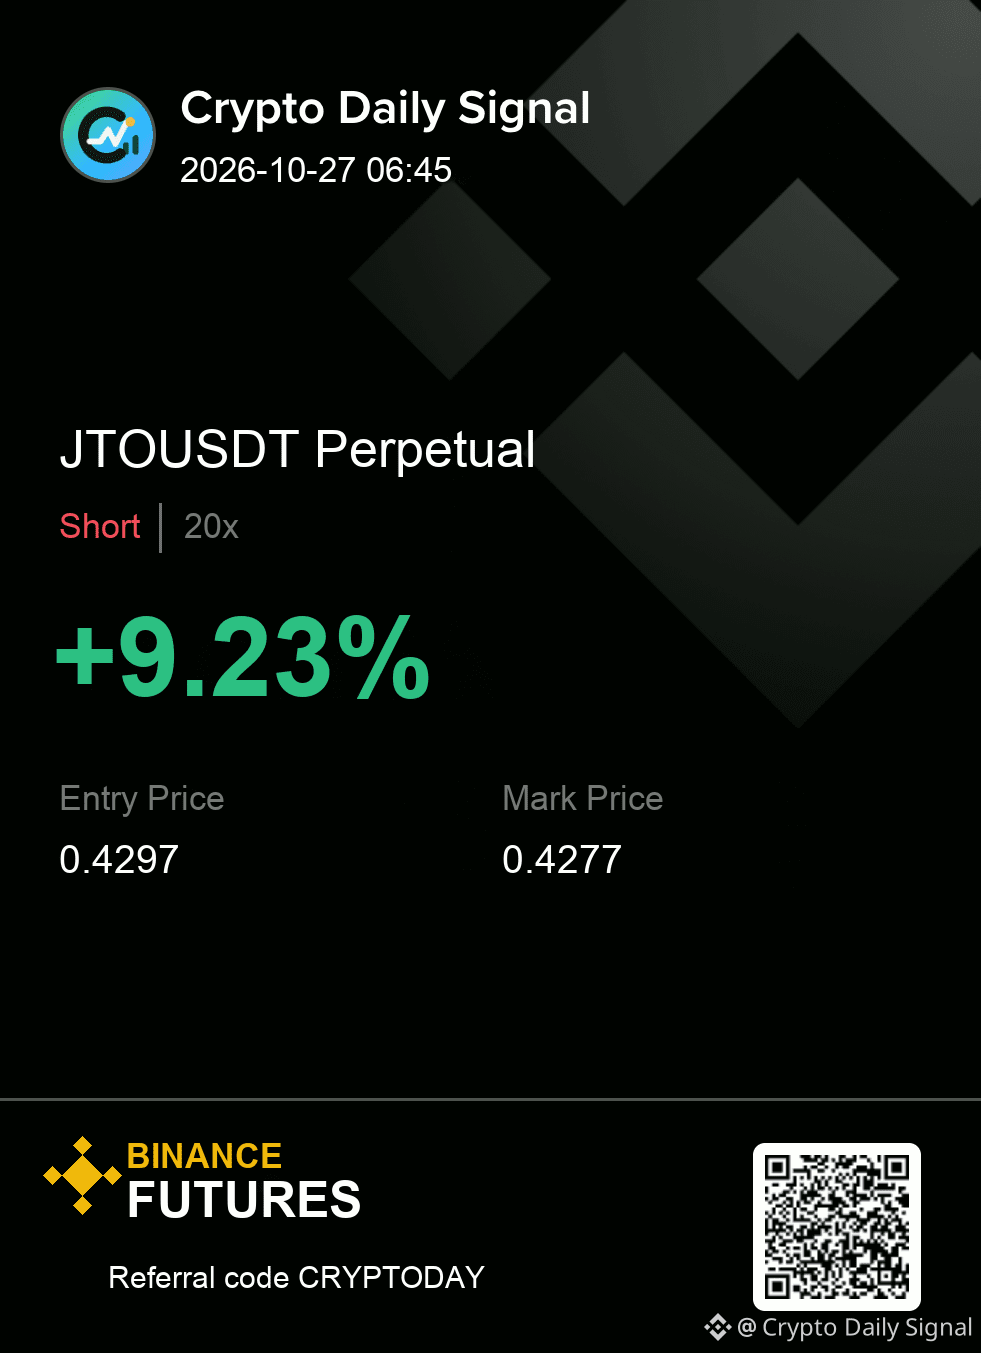
$JTO needs confirmation before I press the short. Price is hovering near the top of the recent range, and the trend across the daily and four-hour views remains down. We are seeing a sequence of lower highs form, which is a clear setup for continuation against the current ceiling. A solid close below the range floor on a bearish candle would signal the move.
SHORT plan for JTOUSDT
0.4288 - 0.4306 entry | 0.4326 stop
0.4268 → 0.4246 → 0.4217
I am tracking the reaction inside the entry zone. What would make you pass on it?
#Futures
{future}(JTOUSDT)
$JTO needs confirmation before I press the short. Price is hovering near the top of the recent range, and the trend across the daily and four-hour views remains down. We are seeing a sequence of lower highs form, which is a clear setup for continuation against the current ceiling. A solid close below the range floor on a bearish candle would signal the move.
SHORT plan for JTOUSDT
0.4288 - 0.4306 entry | 0.4326 stop
0.4268 → 0.4246 → 0.4217
I am tracking the reaction inside the entry zone. What would make you pass on it?
#Futures
SHORT plan for JTOUSDT
0.4288 - 0.4306 entry | 0.4326 stop
0.4268 → 0.4246 → 0.4217
I am tracking the reaction inside the entry zone. What would make you pass on it?
#Futures
10
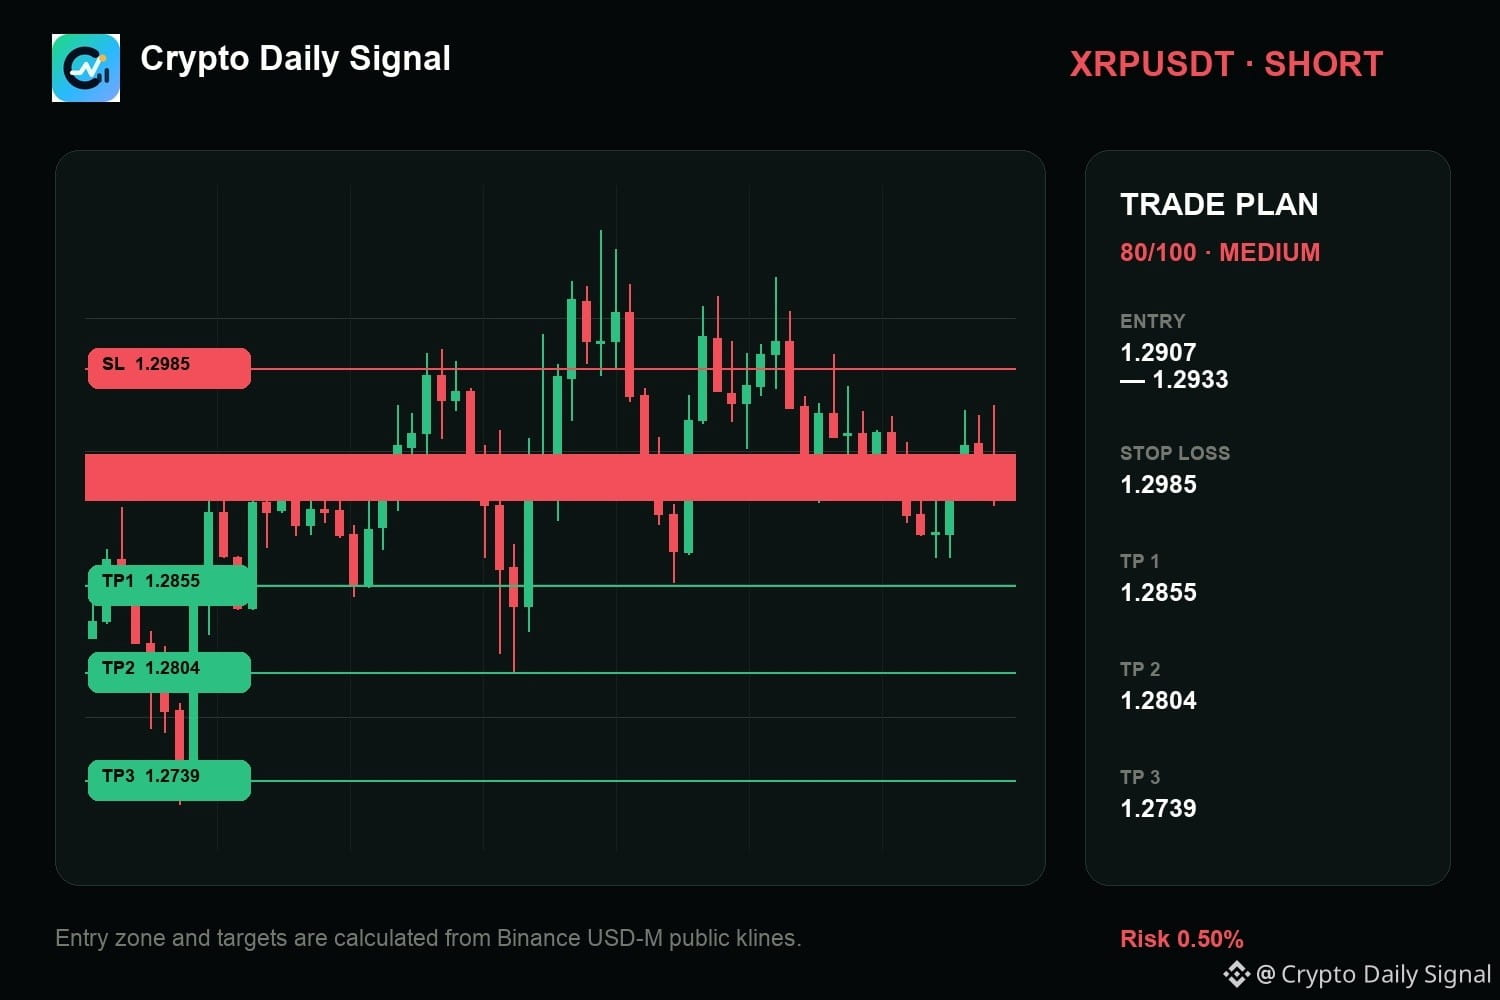
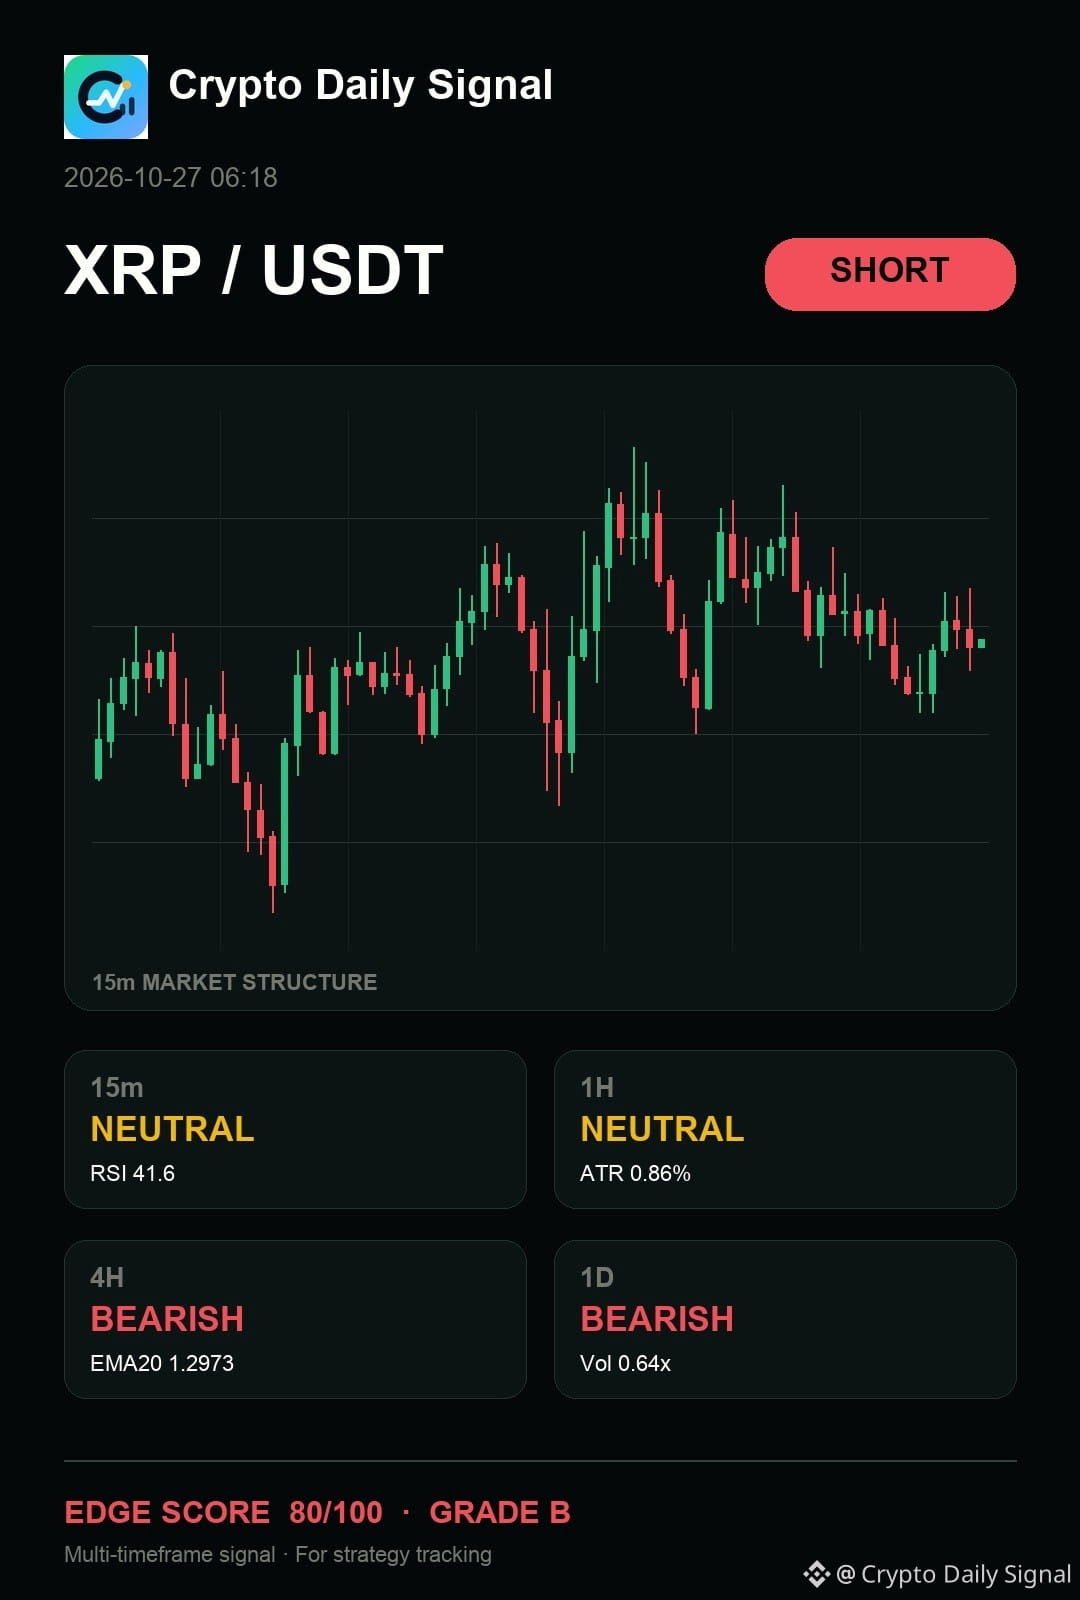
$XRP — real talk, I am treating it like it has my attention on the sell side as it tests the top of its current range. The pattern of lower highs across the short-term view suggests sellers maintain control. This short setup strengthens if a close breaches that recent swing low, though a push past the recent local high would change things.
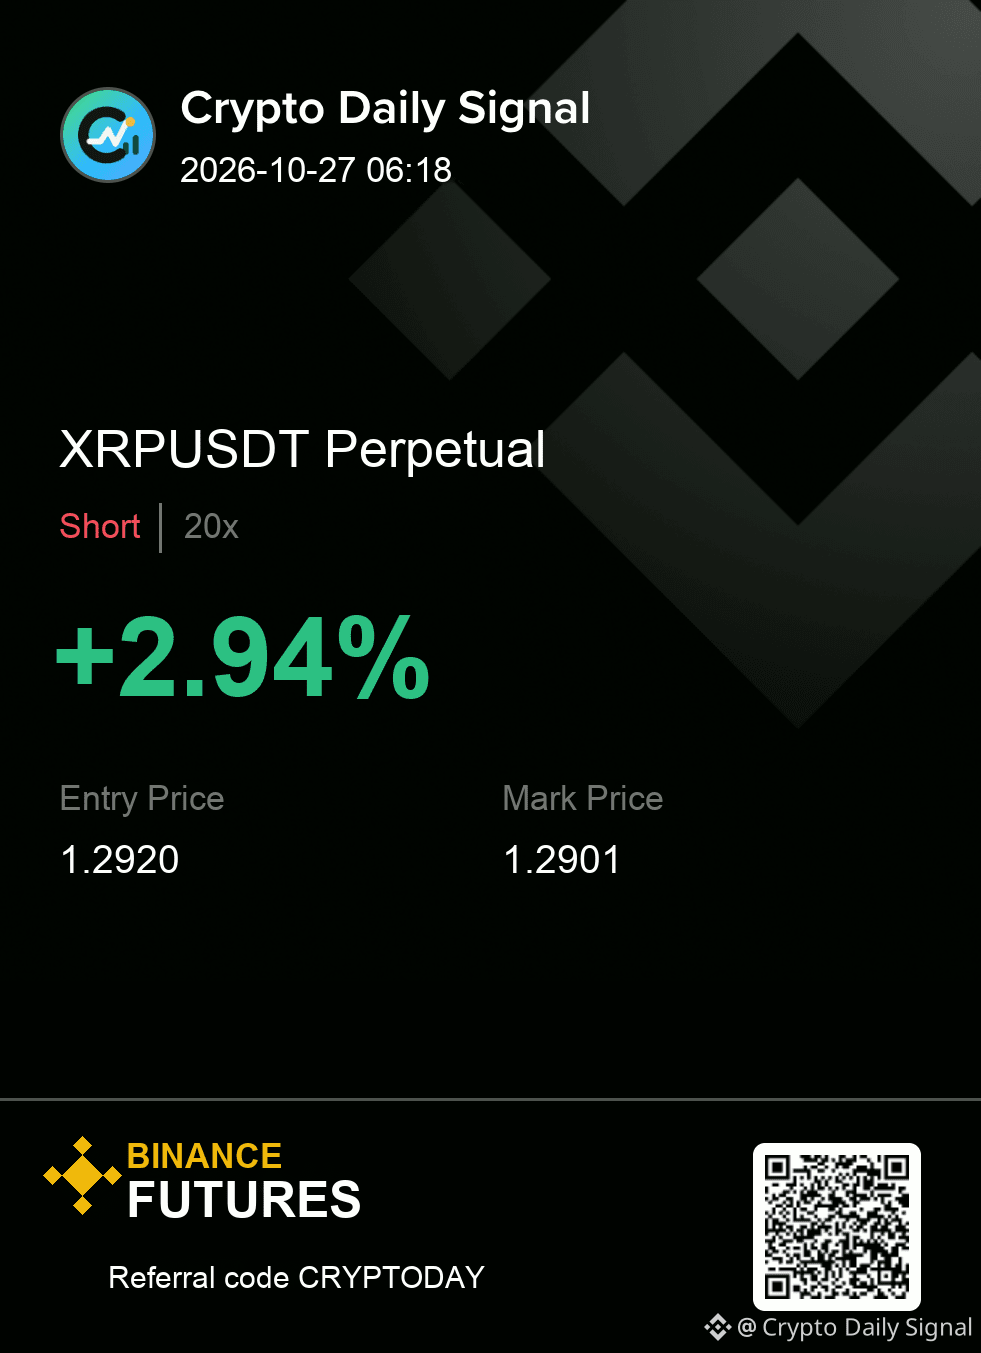
Trade Plan — XRPUSDT SHORT
Entry: 1.2907 - 1.2933
Stop Loss: 1.2985
TP1: 1.2855 | TP2: 1.2804 | TP3: 1.2739
I only want the planned reaction; anything else is a pass.
#Futures
{future}(XRPUSDT)
$XRP — real talk, I am treating it like it has my attention on the sell side as it tests the top of its current range. The pattern of lower highs across the short-term view suggests sellers maintain control. This short setup strengthens if a close breaches that recent swing low, though a push past the recent local high would change things.
Trade Plan — XRPUSDT SHORT
Entry: 1.2907 - 1.2933
Stop Loss: 1.2985
TP1: 1.2855 | TP2: 1.2804 | TP3: 1.2739
I only want the planned reaction; anything else is a pass.
#Futures
Trade Plan — XRPUSDT SHORT
Entry: 1.2907 - 1.2933
Stop Loss: 1.2985
TP1: 1.2855 | TP2: 1.2804 | TP3: 1.2739
I only want the planned reaction; anything else is a pass.
#Futures
24
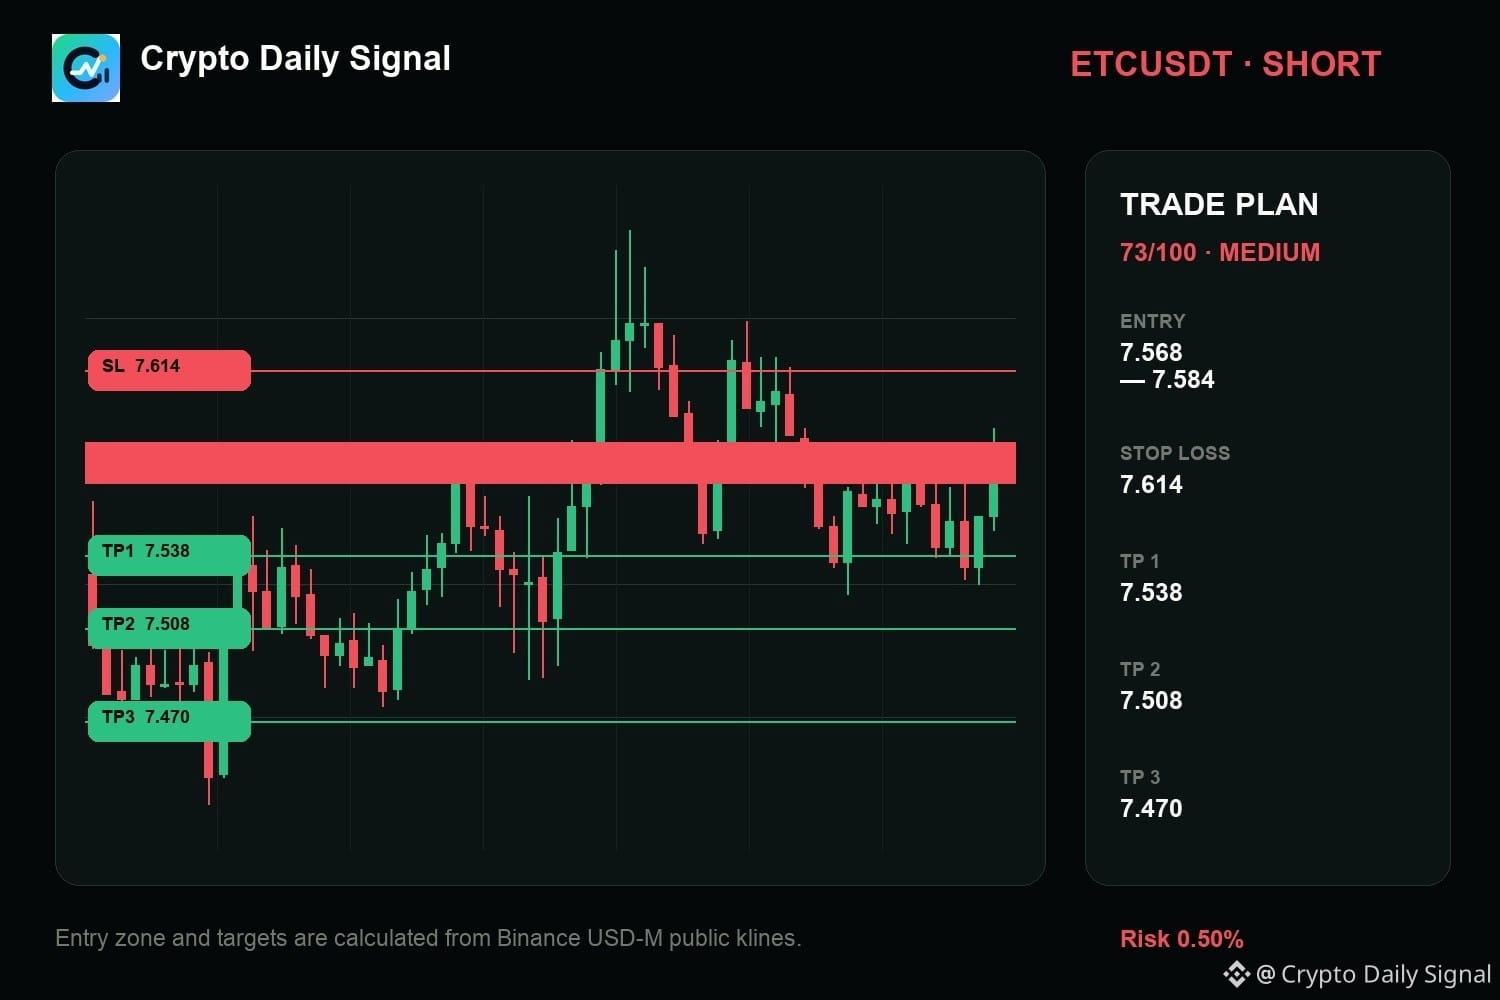
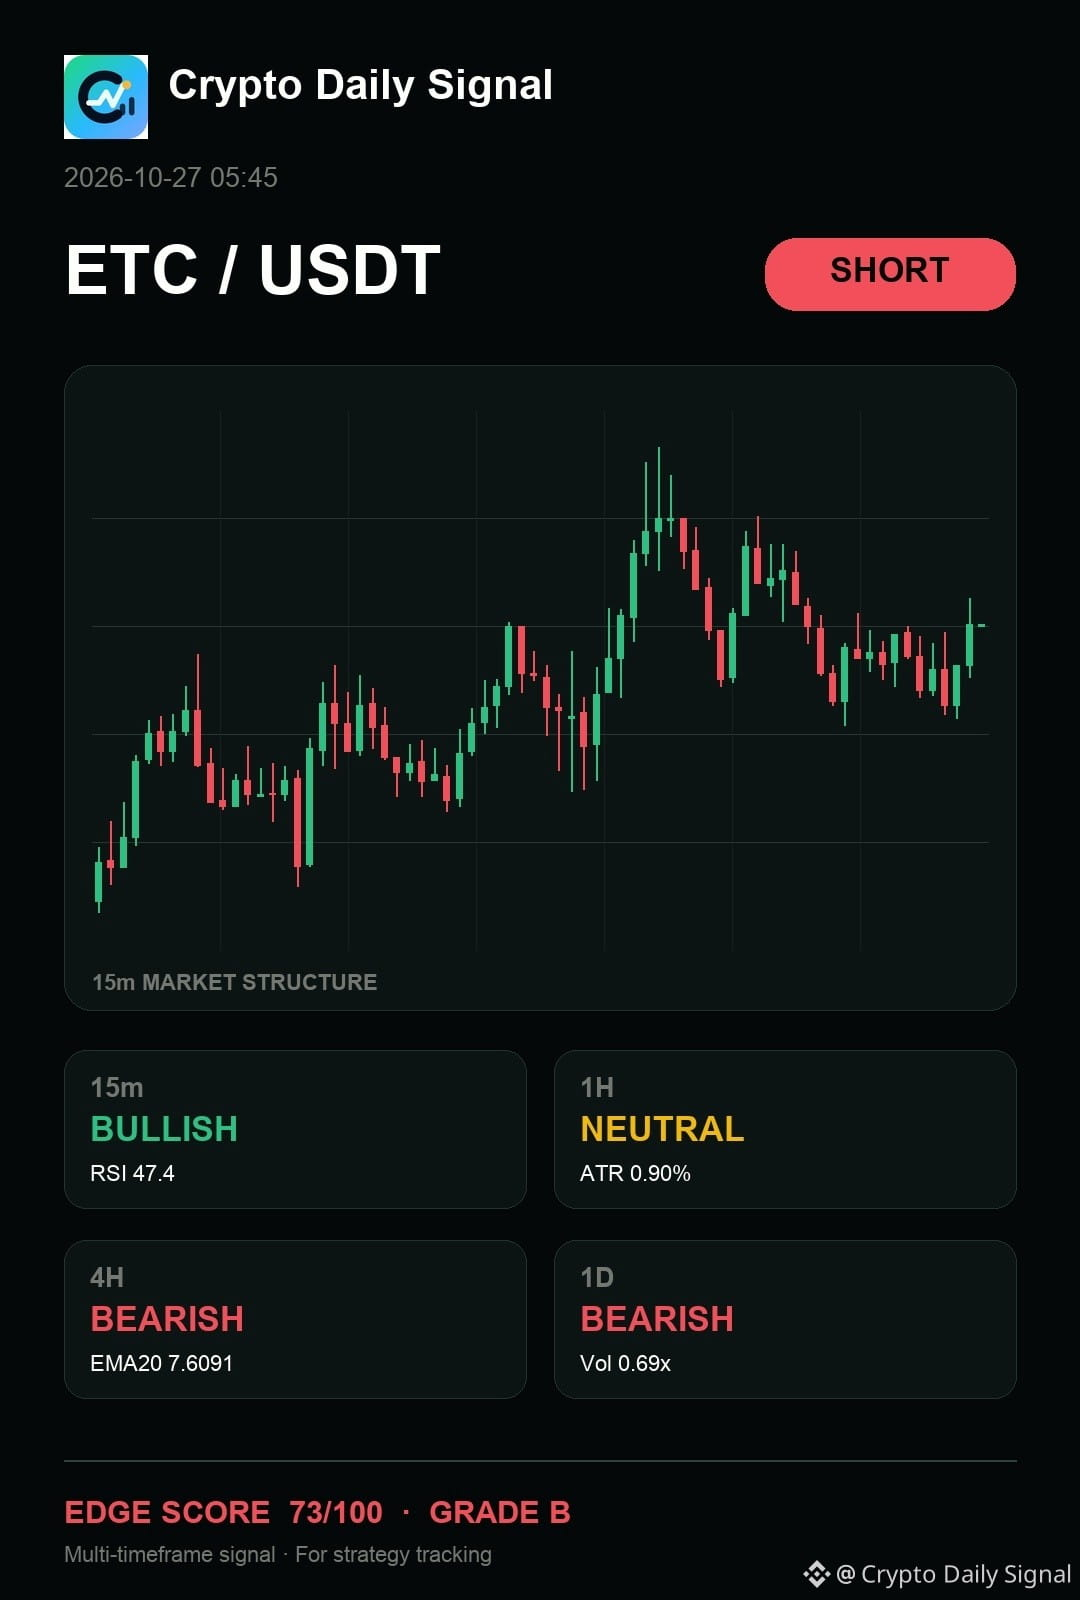
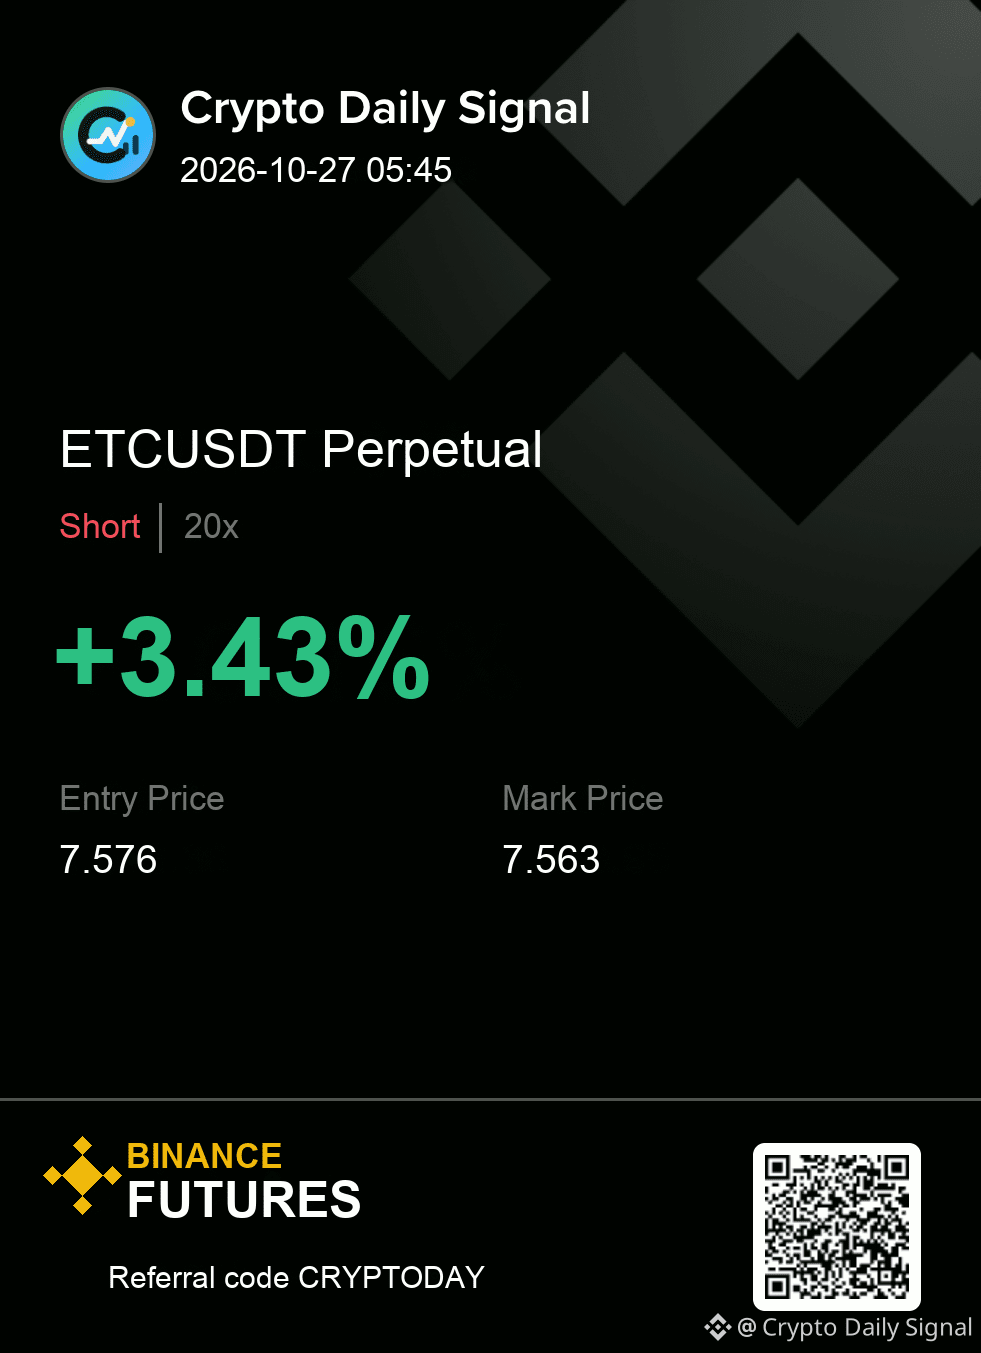
$ETC requires patience before the short is actionable as the price action has been forming lower highs inside the current range. The heavy upper wick on the latest candle suggests selling pressure is hitting those higher levels. A decisive close under the recent range floor would confirm the short thesis we see in the daily and four-hour perspective.
My levels for ETCUSDT — SHORT
Entry zone 7.568 - 7.584
Risk line 7.614
Targets 7.538 / 7.508 / 7.470
#Futures
{future}(ETCUSDT)
$ETC requires patience before the short is actionable as the price action has been forming lower highs inside the current range. The heavy upper wick on the latest candle suggests selling pressure is hitting those higher levels. A decisive close under the recent range floor would confirm the short thesis we see in the daily and four-hour perspective.
My levels for ETCUSDT — SHORT
Entry zone 7.568 - 7.584
Risk line 7.614
Targets 7.538 / 7.508 / 7.470
#Futures
My levels for ETCUSDT — SHORT
Entry zone 7.568 - 7.584
Risk line 7.614
Targets 7.538 / 7.508 / 7.470
#Futures
10
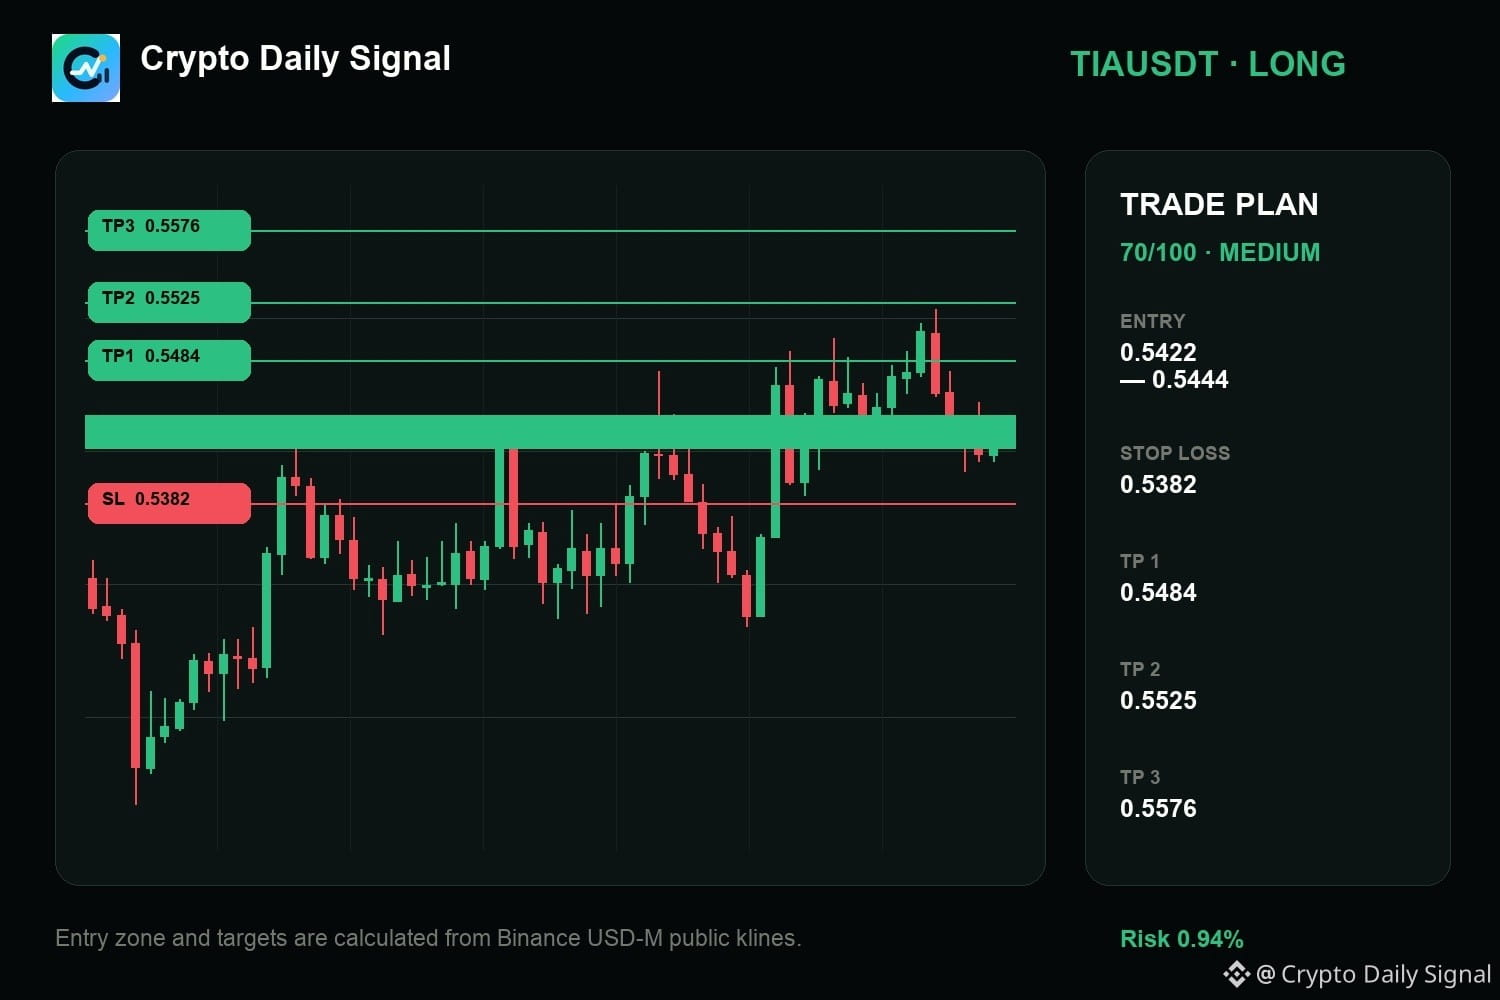
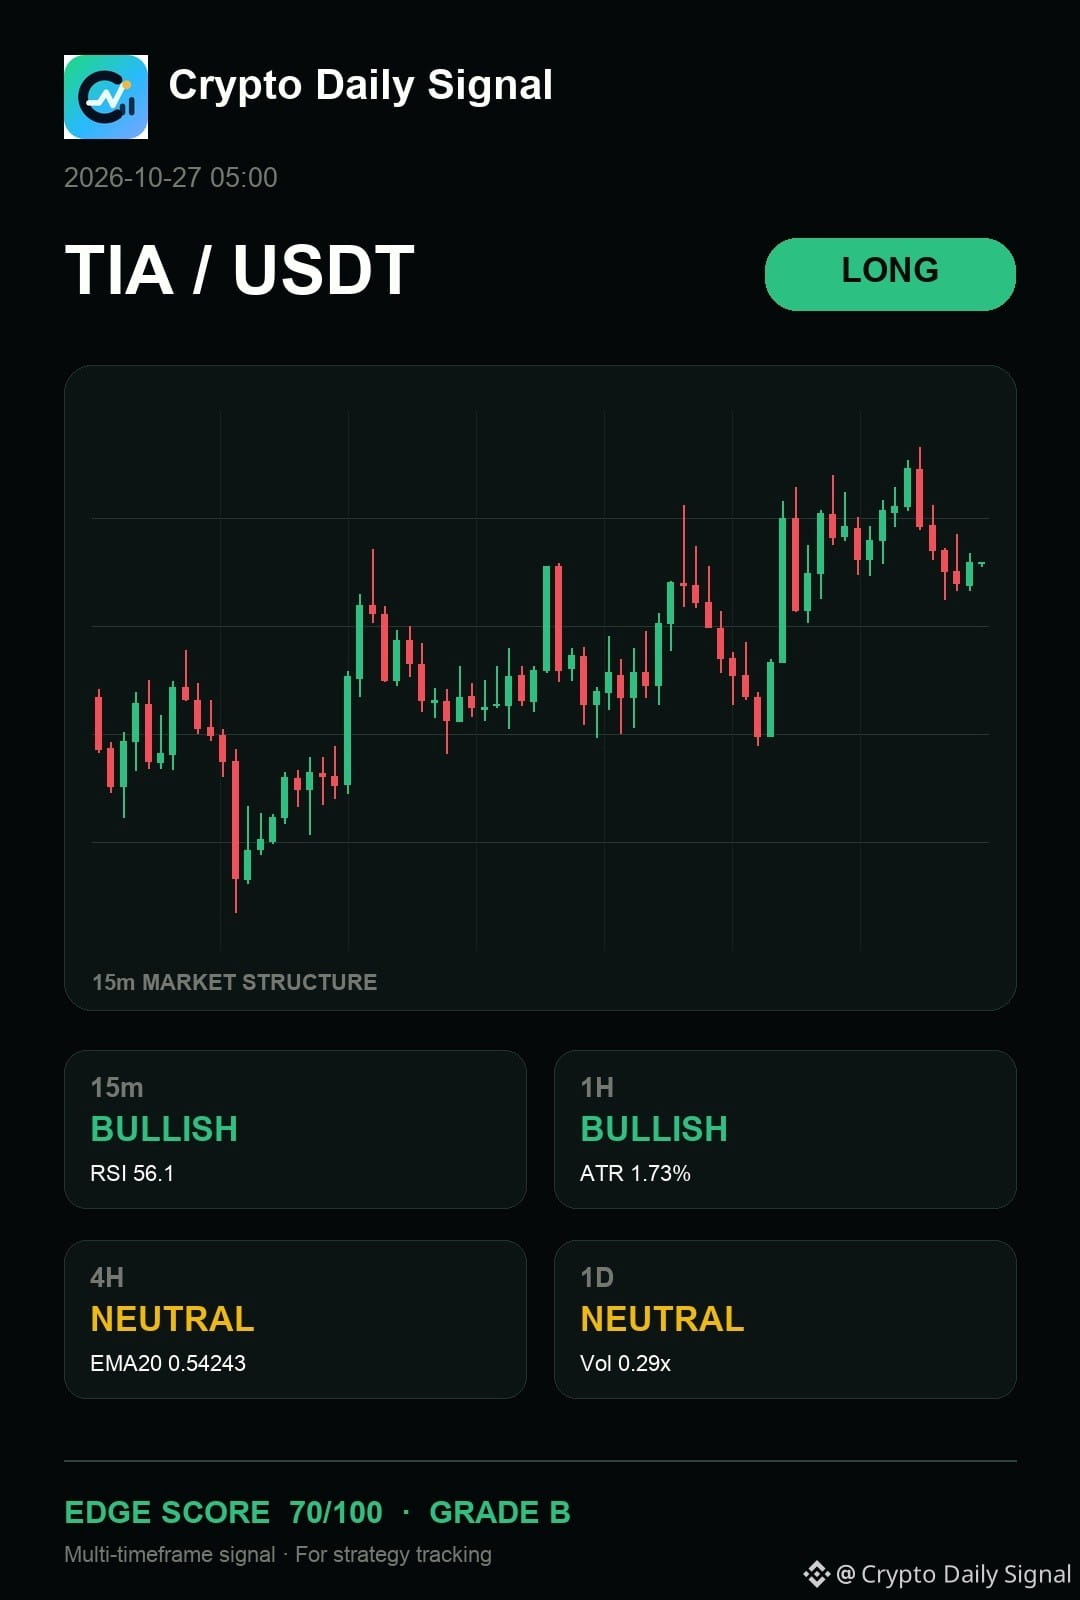
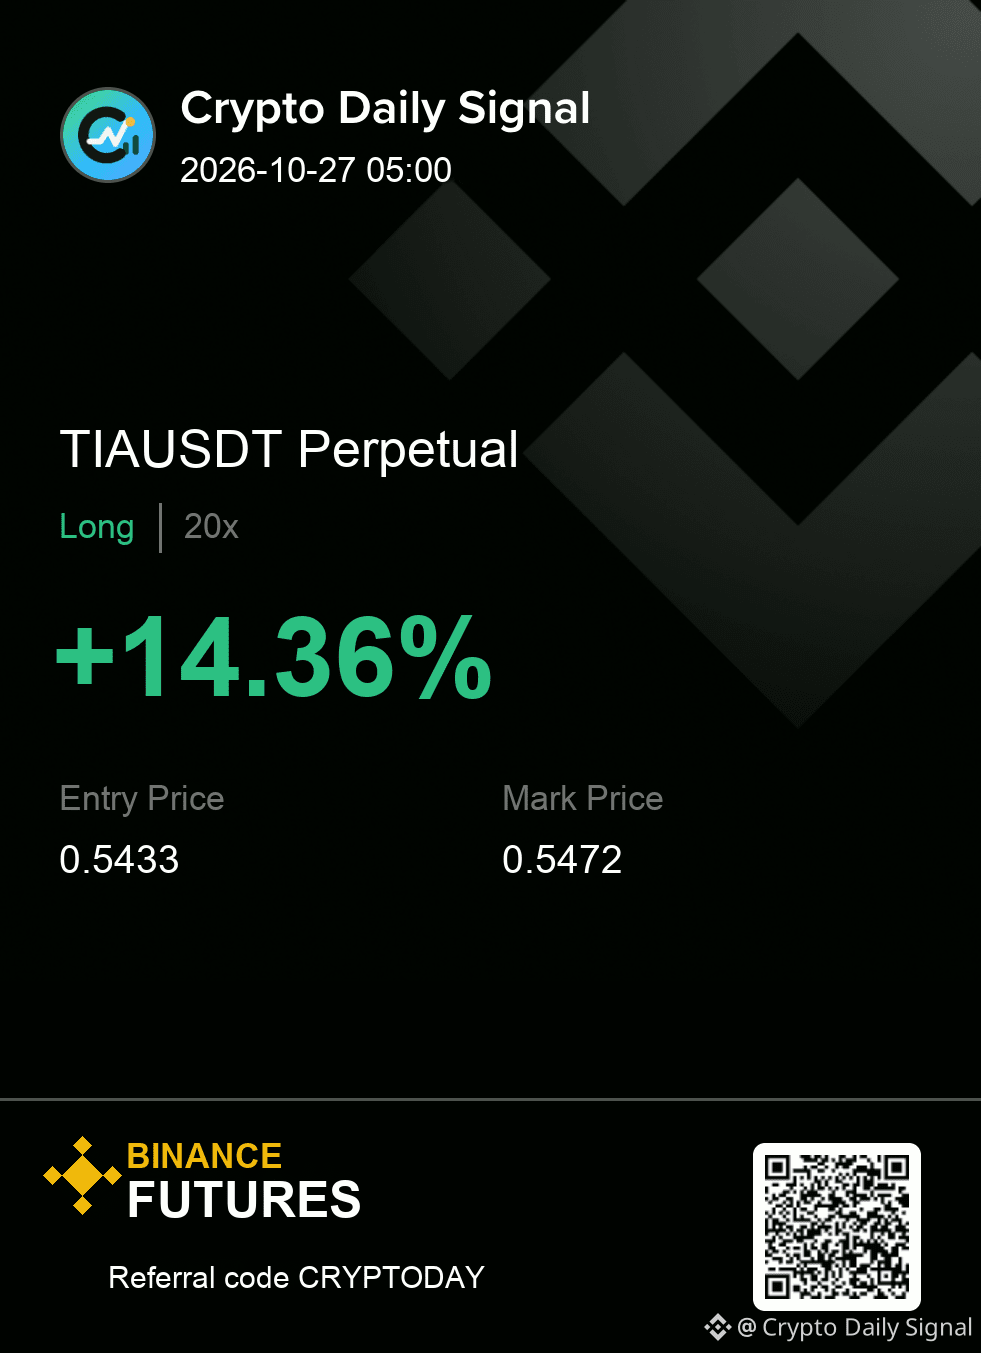
$TIA — quick take, I still think it keeps the bullish thesis active because the price held its range floor convincingly, and higher lows are starting to form on the shorter timeframes. The idea weakens if it falls back below that established low. Strength would come from a clear break above the recent high point.
TIAUSDT LONG
IN 0.5422 - 0.5444
OUT 0.5382
TP 0.5484 · 0.5525 · 0.5576
Does the structure look clean enough, or would you leave this one alone?
#Futures
{future}(TIAUSDT)
$TIA — quick take, I still think it keeps the bullish thesis active because the price held its range floor convincingly, and higher lows are starting to form on the shorter timeframes. The idea weakens if it falls back below that established low. Strength would come from a clear break above the recent high point.
TIAUSDT LONG
IN 0.5422 - 0.5444
OUT 0.5382
TP 0.5484 · 0.5525 · 0.5576
Does the structure look clean enough, or would you leave this one alone?
#Futures
TIAUSDT LONG
IN 0.5422 - 0.5444
OUT 0.5382
TP 0.5484 · 0.5525 · 0.5576
Does the structure look clean enough, or would you leave this one alone?
#Futures
17
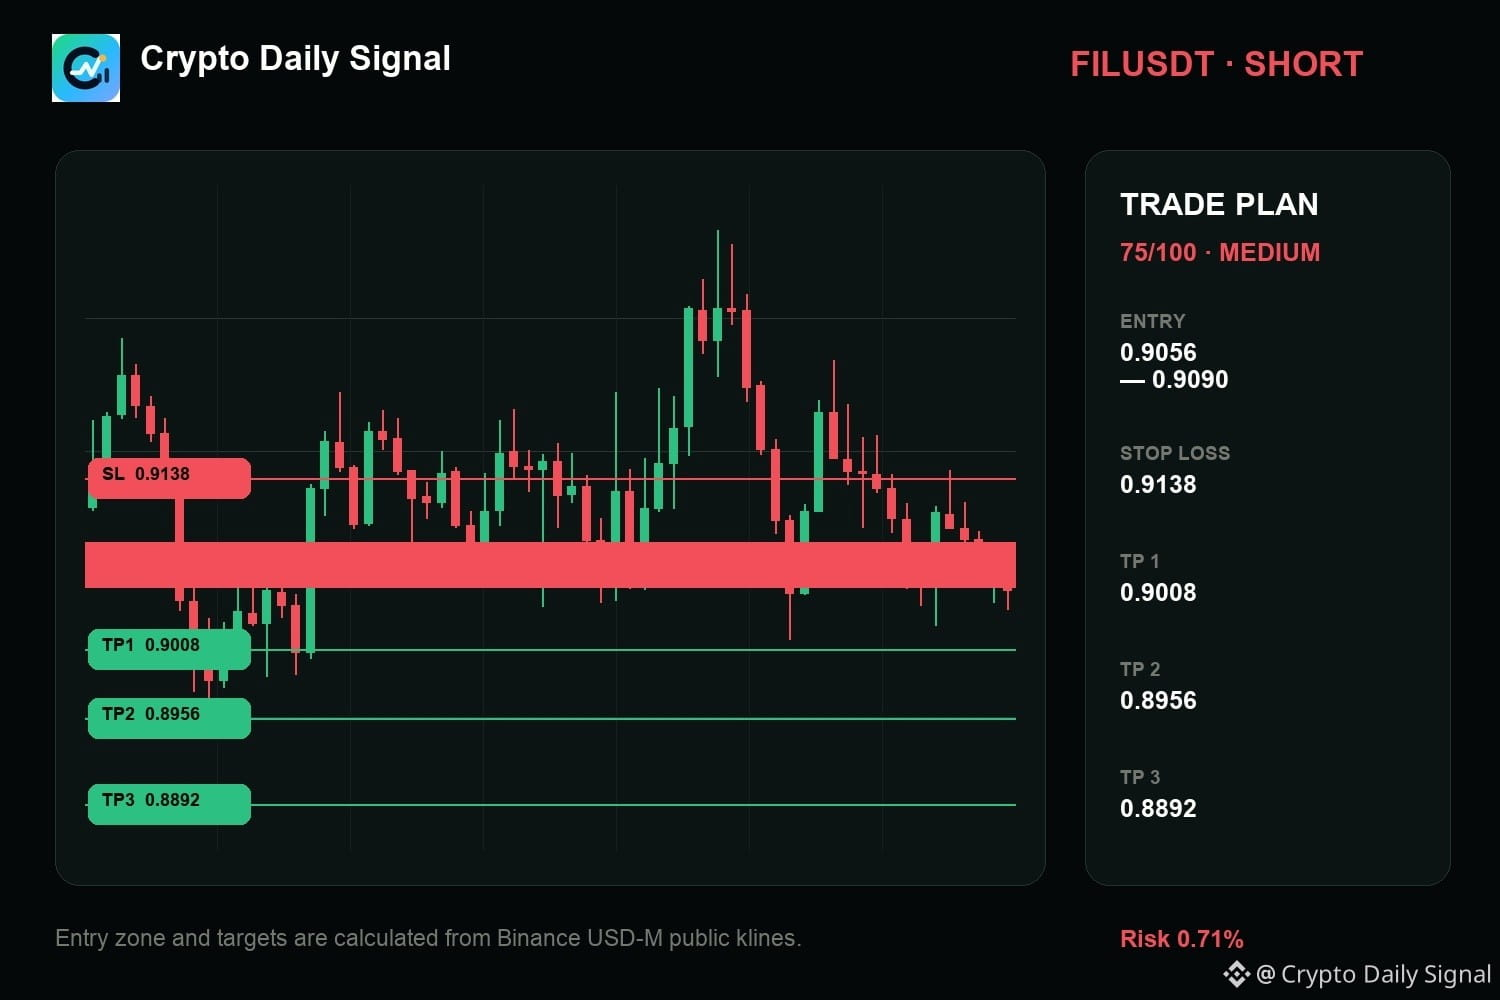
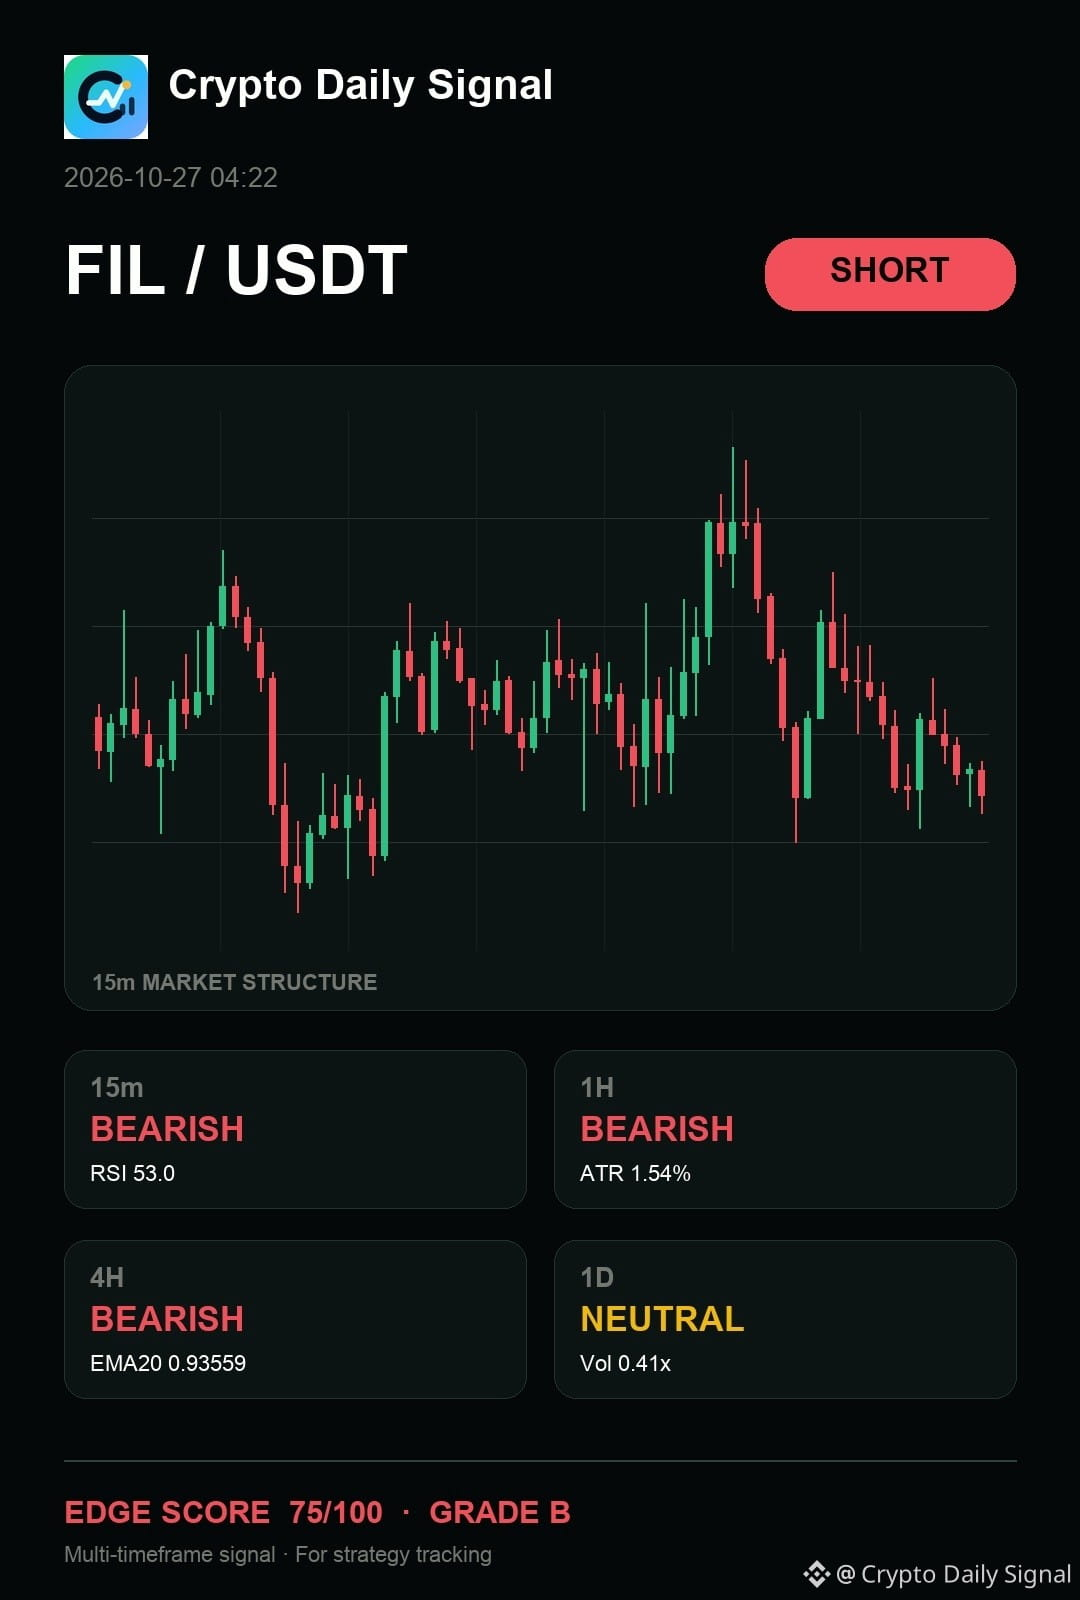
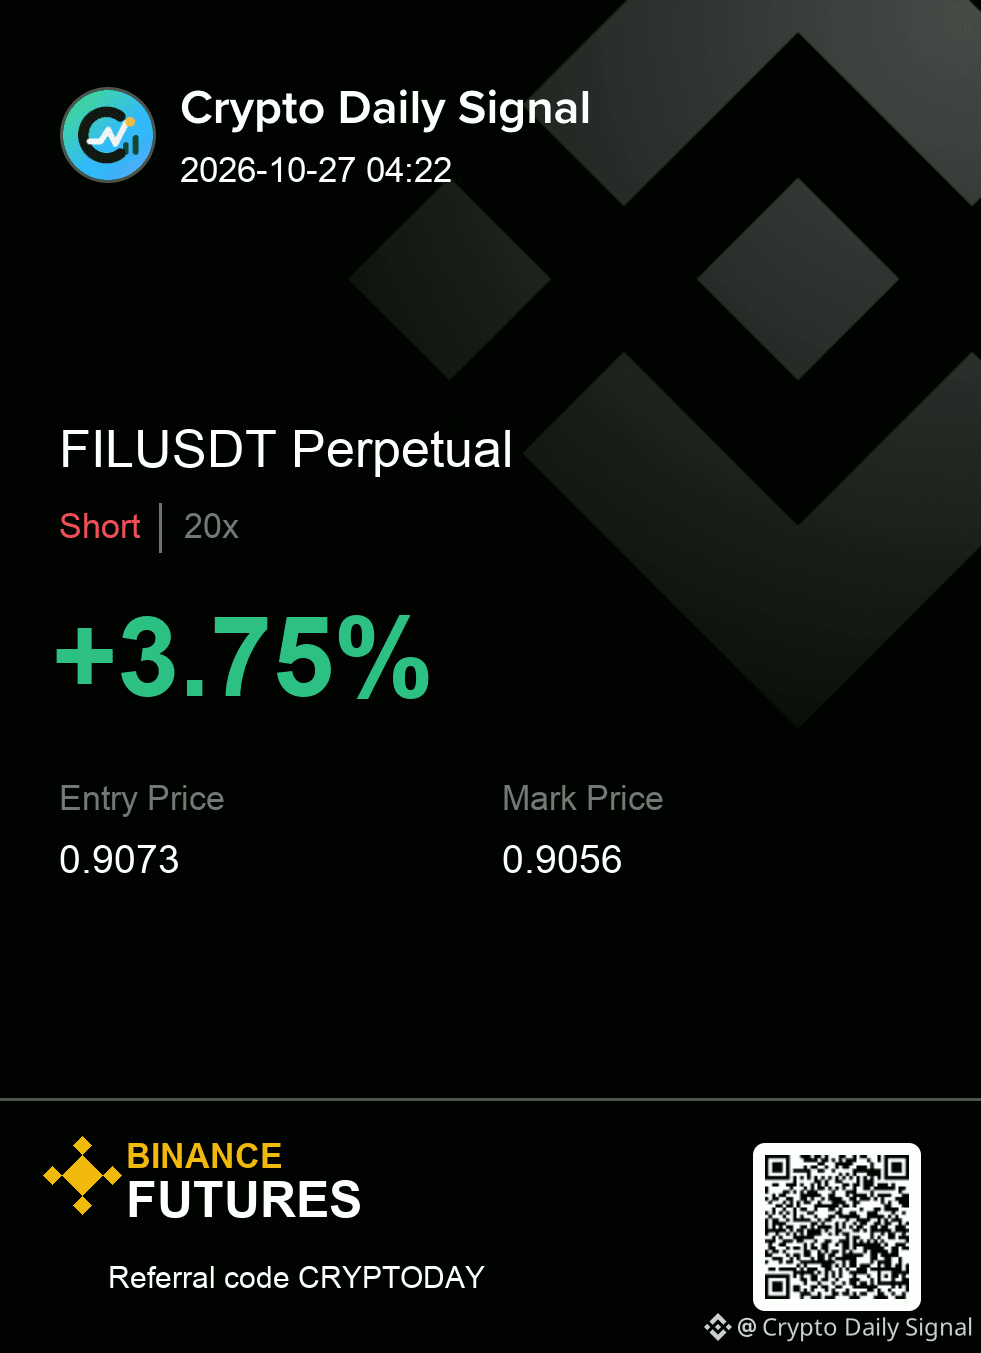
$FIL stays on my short list for now. The higher-timeframe picture reads neutral, and the four-hour leg remains bearish. Let price prove the zone rather than chasing momentum; if the risk boundary fails, I move on without arguing with it.
SHORT plan for FILUSDT
0.9056 - 0.9090 entry | 0.9138 stop
0.9008 → 0.8956 → 0.8892
Worth tracking from here, or does the range still need more time?
#Futures
{future}(FILUSDT)
$FIL stays on my short list for now. The higher-timeframe picture reads neutral, and the four-hour leg remains bearish. Let price prove the zone rather than chasing momentum; if the risk boundary fails, I move on without arguing with it.
SHORT plan for FILUSDT
0.9056 - 0.9090 entry | 0.9138 stop
0.9008 → 0.8956 → 0.8892
Worth tracking from here, or does the range still need more time?
#Futures
SHORT plan for FILUSDT
0.9056 - 0.9090 entry | 0.9138 stop
0.9008 → 0.8956 → 0.8892
Worth tracking from here, or does the range still need more time?
#Futures
7

·
--
$Q +76% today, and my long caught the first leg ✅
long above 0.1000 triggered at 21:40, TP1 0.1080 hit 5 min later. then one wick to 0.0865 took the rest out at entry... right before it ran to 0.1243 😅
now it's chopping 0.101 to 0.115 with lower highs since the top
short below 0.1000 | SL 0.1065 | TP 0.0930 / 0.0870
long above 0.1250 | SL 0.1170 | TP 0.1350 / 0.1450
not financial advice. top is in or one more leg?
#BinancePick #EarningsSeason #q #Futures
10
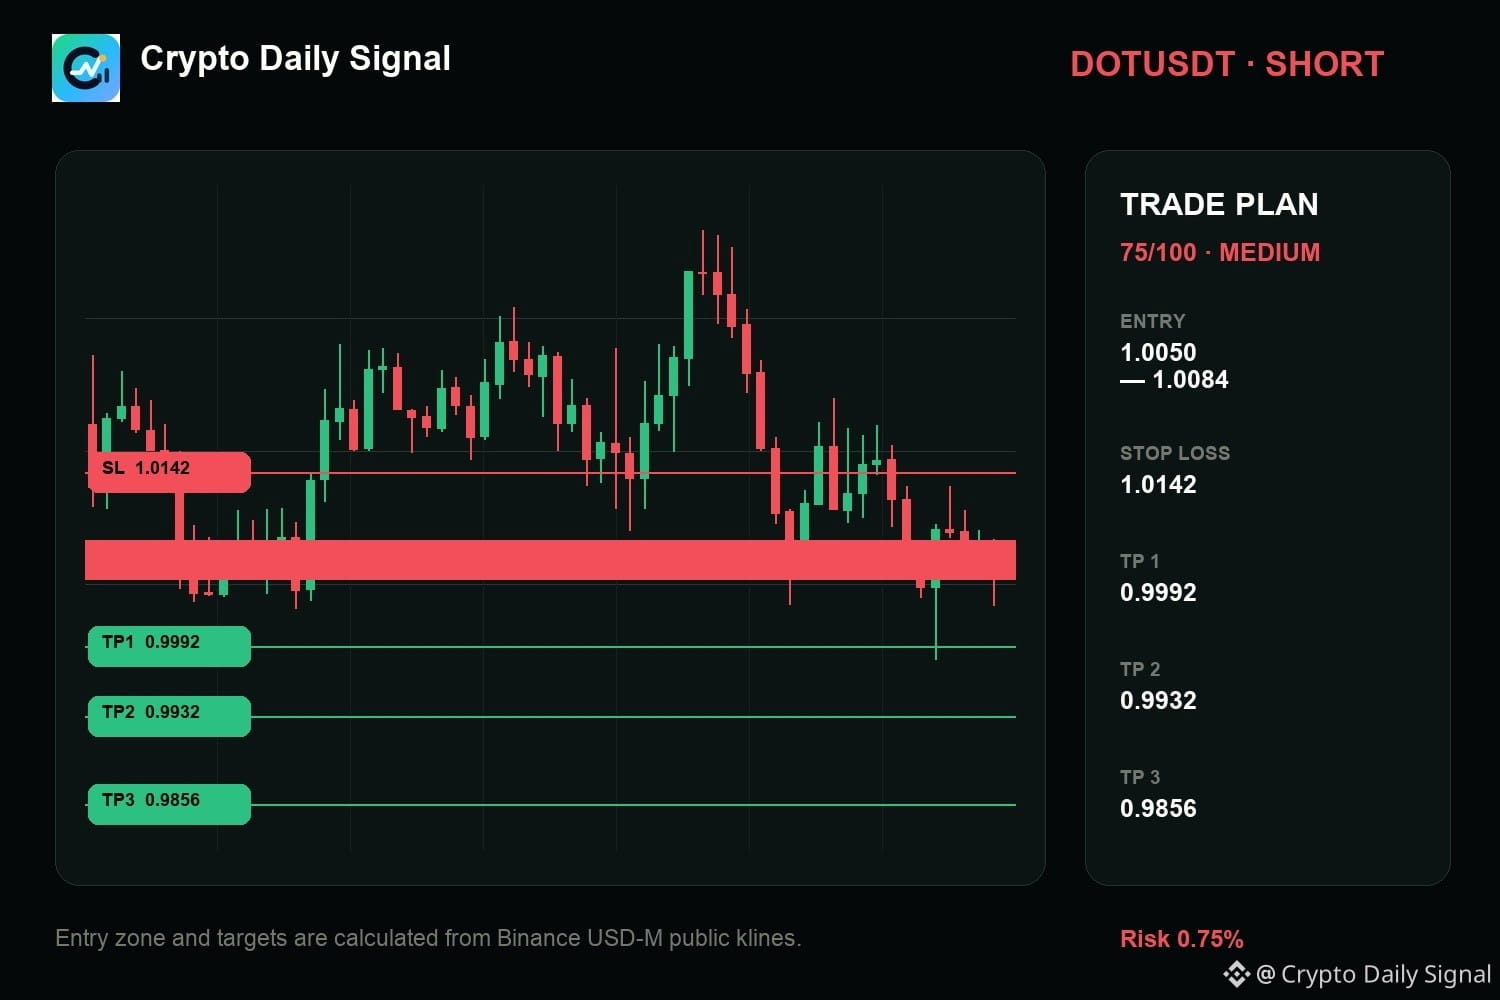
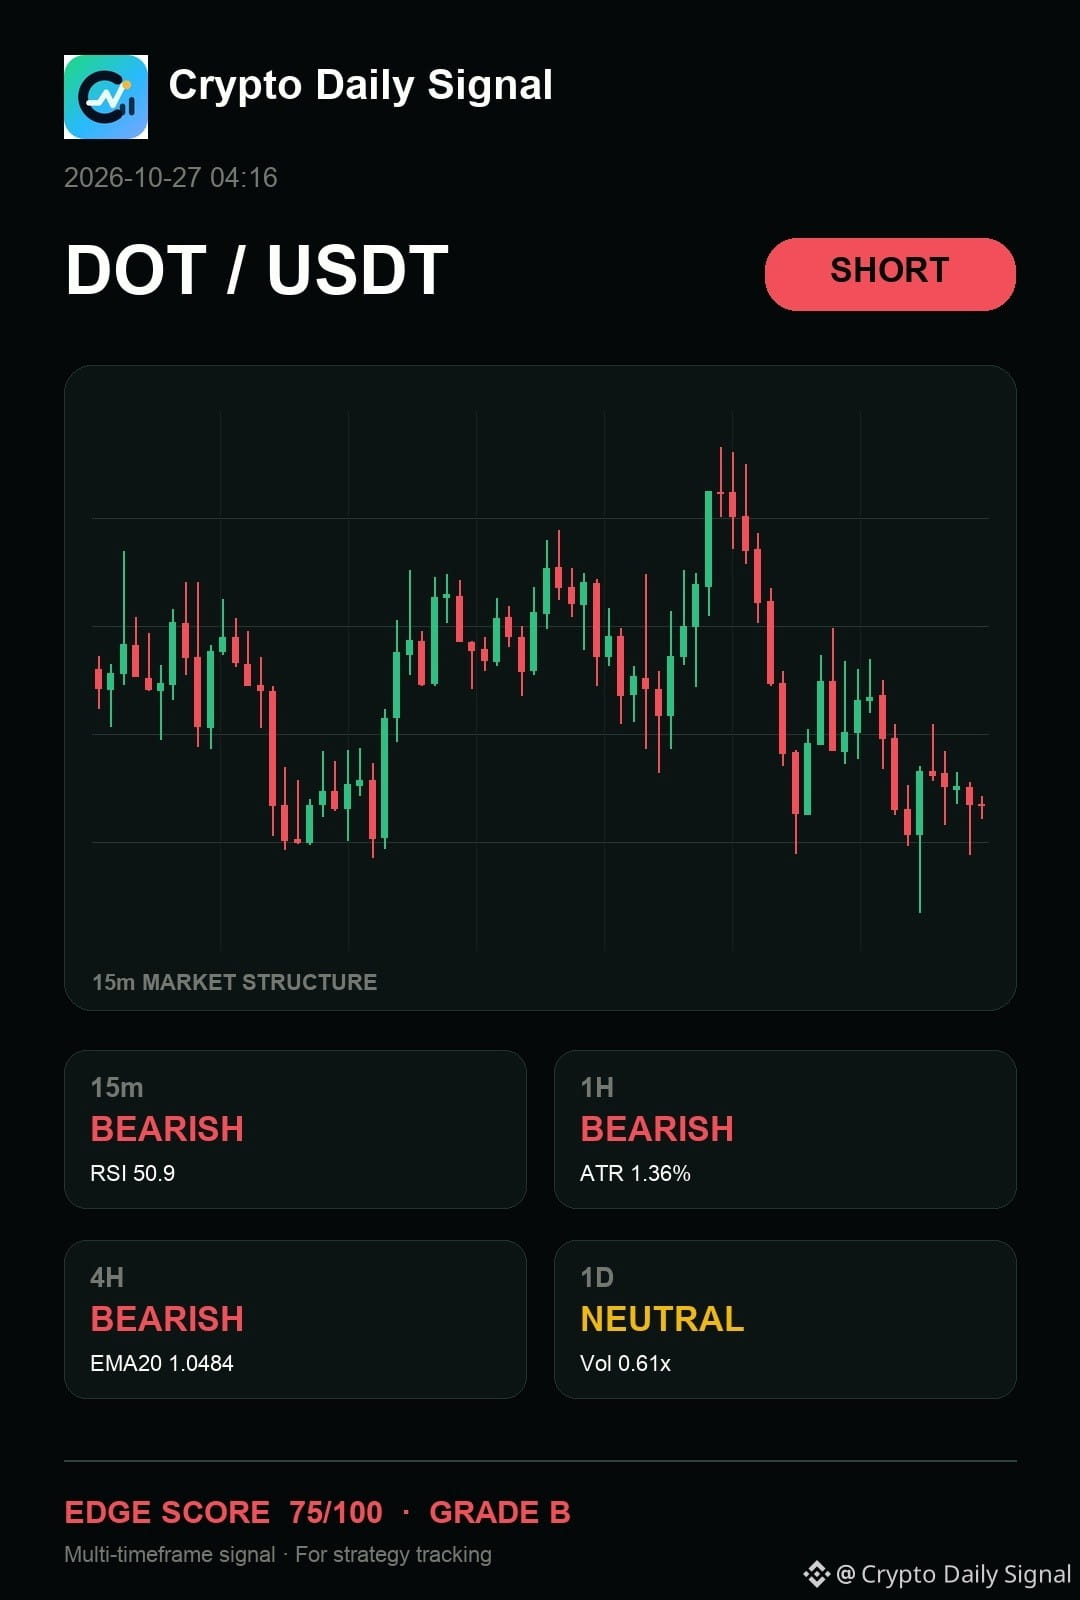
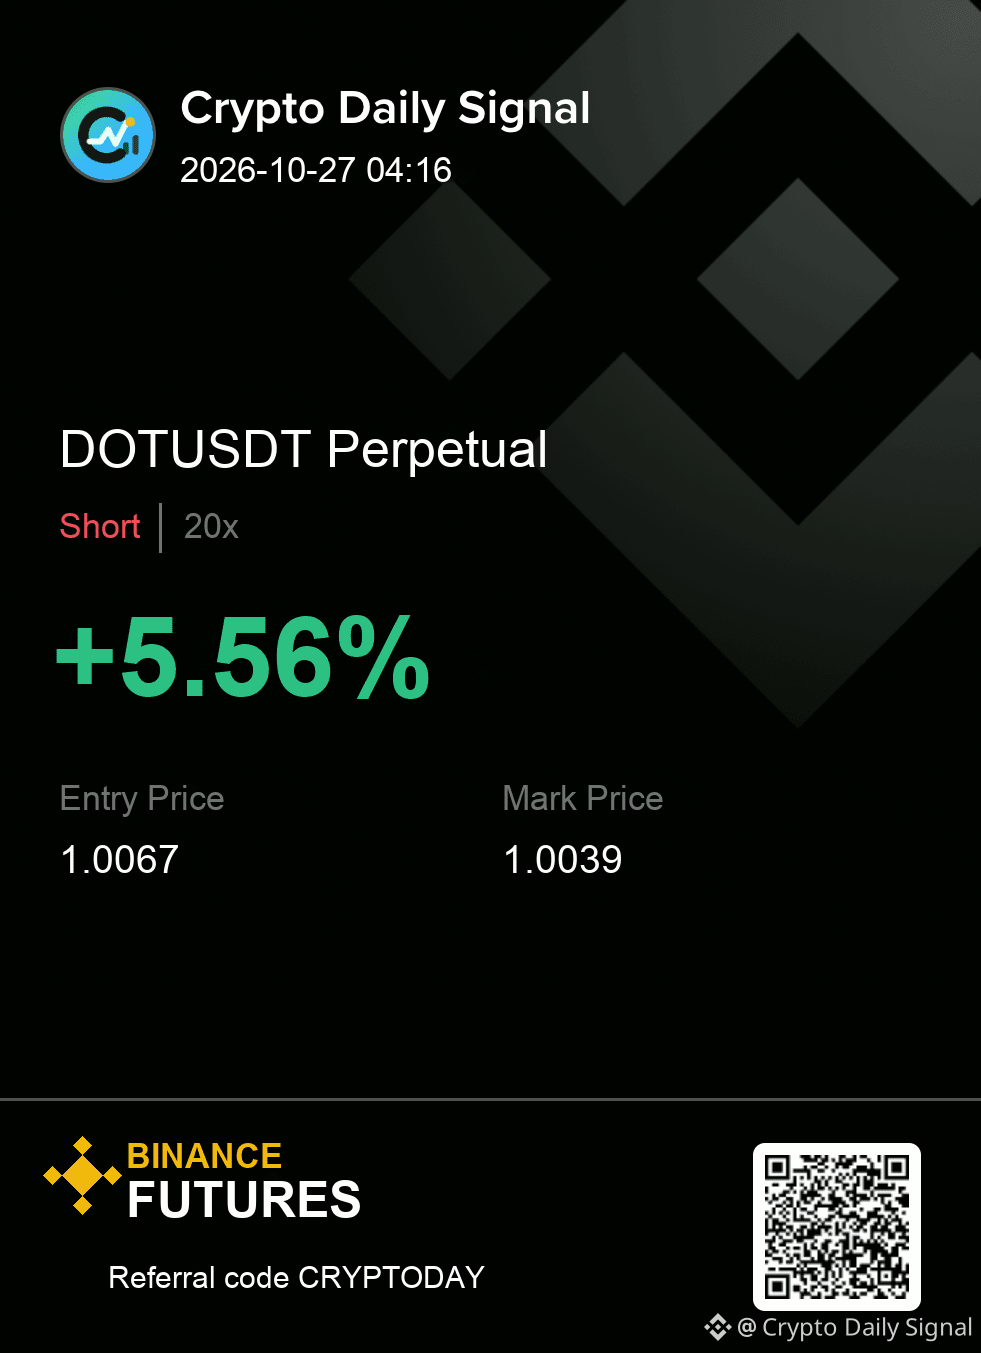
$DOT — look, my read is simple: it still gives sellers the cleaner argument as the recent price movement showed a sequence of lower highs, confirming weakness. The appearance of a large upper wick at the recent peak suggests supply is taking notice. If we see a solid close under the latest low, that confirms the short view; a big push above the recent high would cancel this trade.
Levels — DOTUSDT
Zone: 1.0050 - 1.0084
Cut: 1.0142
Scale: 0.9992 | 0.9932 | 0.9856
#Futures
{future}(DOTUSDT)
$DOT — look, my read is simple: it still gives sellers the cleaner argument as the recent price movement showed a sequence of lower highs, confirming weakness. The appearance of a large upper wick at the recent peak suggests supply is taking notice. If we see a solid close under the latest low, that confirms the short view; a big push above the recent high would cancel this trade.
Levels — DOTUSDT
Zone: 1.0050 - 1.0084
Cut: 1.0142
Scale: 0.9992 | 0.9932 | 0.9856
#Futures
Levels — DOTUSDT
Zone: 1.0050 - 1.0084
Cut: 1.0142
Scale: 0.9992 | 0.9932 | 0.9856
#Futures
11

·
--
📖 Crypto glossary: Funding Rate
If you trade perpetual futures, this one quietly touches your PnL every few hours 👇
🔹 What it is
A small payment swapped between long and short traders. It keeps the perp price close to the spot price.
🔹 How it works
✅ Positive rate: longs pay shorts (perp trading above spot, market leaning bullish)
✅ Negative rate: shorts pay longs (perp below spot, market leaning bearish)
⏱️ On Binance it's usually settled every 8 hours, and you only pay or receive it if you hold a position at that moment
🔹 Why it matters
💡 Holding a big position for days can add up to real costs
💡 Very high positive funding often means crowded longs, a sign the market may be overheated
Do you check funding before opening a perp trade? 👇
#CryptoEducation💡🚀 #futures #Binance #crypto
2
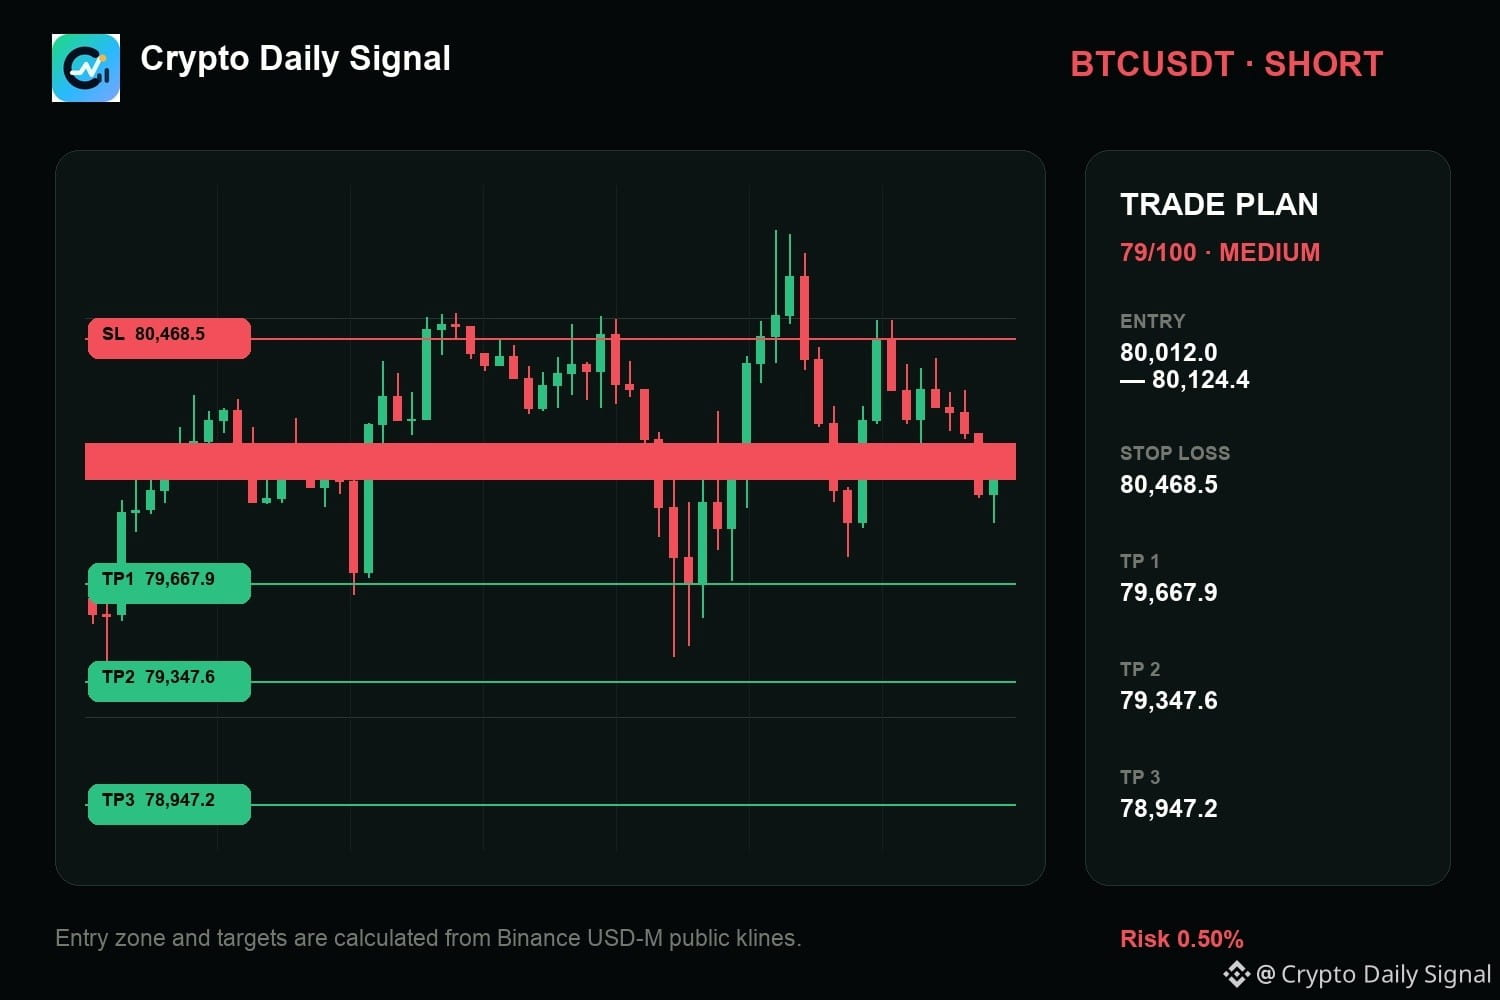
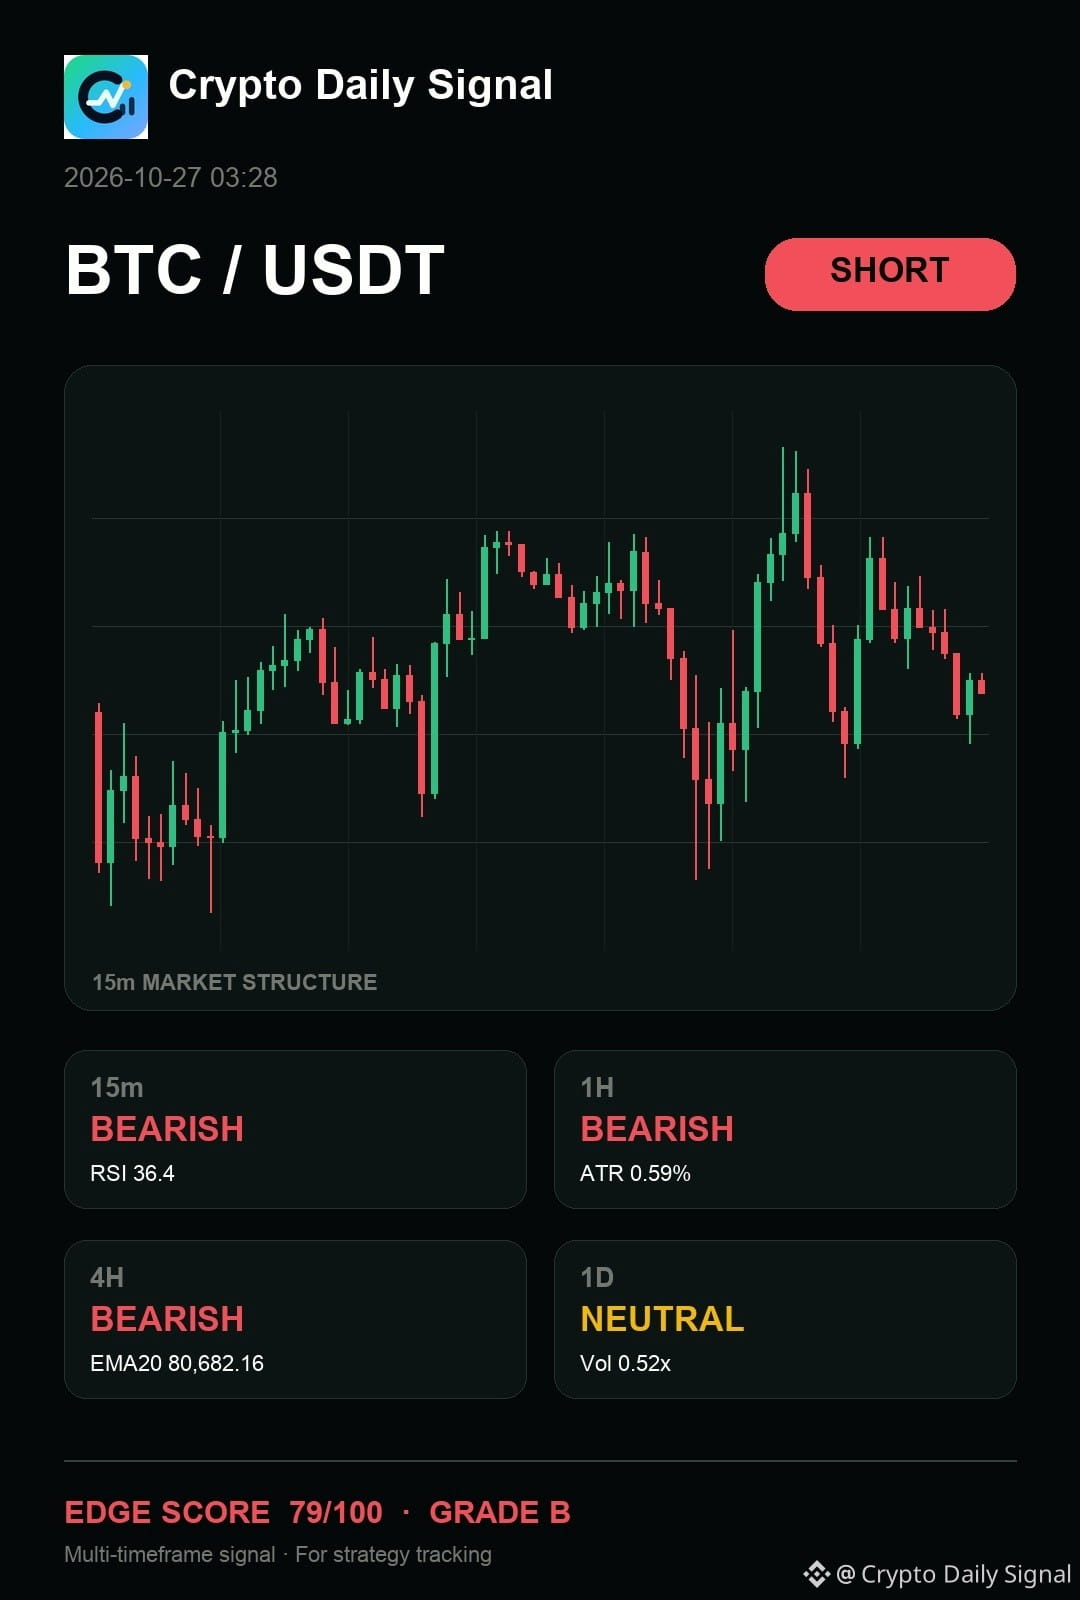
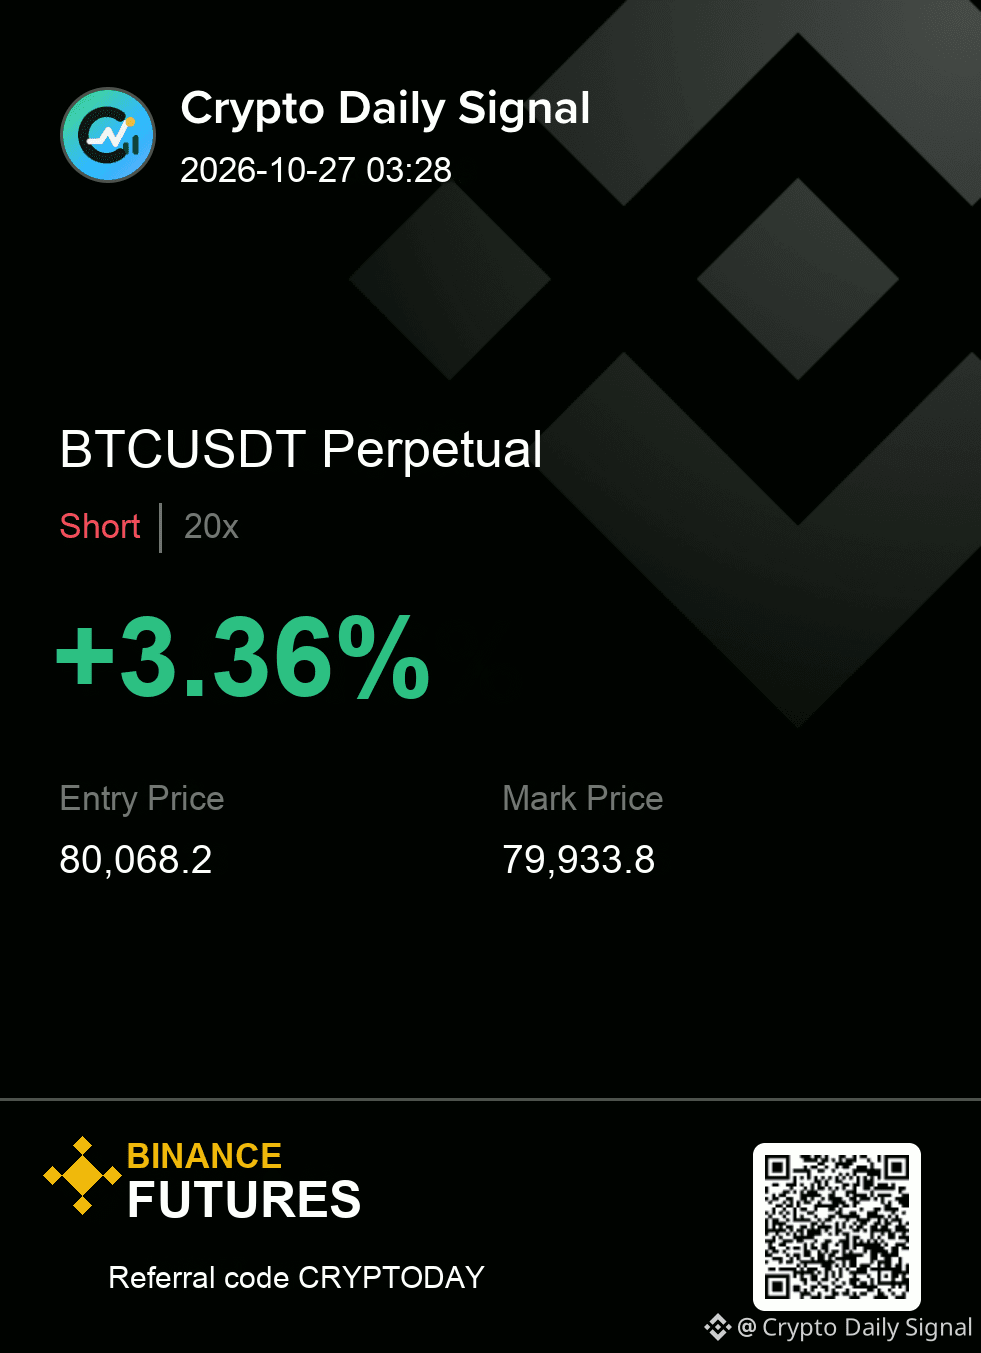
$BTC needs the sell-side reaction to confirm the bearish thesis, meaning a close below the immediate short-term support is key. The price action is currently trapped in a range, though shorter-term momentum points down. A solid close back above the recent high would cancel out the short argument entirely.
BTCUSDT SHORT
IN 80,012.0 - 80,124.4
OUT 80,468.5
TP 79,667.9 · 79,347.6 · 78,947.2
Execution is simple here: respect the zone and respect the cut.
#Futures
{future}(BTCUSDT)
$BTC needs the sell-side reaction to confirm the bearish thesis, meaning a close below the immediate short-term support is key. The price action is currently trapped in a range, though shorter-term momentum points down. A solid close back above the recent high would cancel out the short argument entirely.
BTCUSDT SHORT
IN 80,012.0 - 80,124.4
OUT 80,468.5
TP 79,667.9 · 79,347.6 · 78,947.2
Execution is simple here: respect the zone and respect the cut.
#Futures
BTCUSDT SHORT
IN 80,012.0 - 80,124.4
OUT 80,468.5
TP 79,667.9 · 79,347.6 · 78,947.2
Execution is simple here: respect the zone and respect the cut.
#Futures
9
Connectez-vous pour découvrir plus de contenu
Rejoignez la communauté mondiale des adeptes de cryptomonnaies sur Binance Square
⚡️ Suviez les dernières informations importantes sur les cryptomonnaies.
💬 Jugé digne de confiance par la plus grande plateforme d’échange de cryptomonnaies au monde.
👍 Découvrez les connaissances que partagent les créateurs vérifiés.
Adresse e-mail/Nº de téléphone
Sujets d’actualité
1
#EthereumDropsBelow$2300
1,934 vues
83 mentions
2
#BitcoinSlipsBelow$80KAgain
5,122 vues
50 mentions
3
#ThailandLaunchesWORPTStablecoinToQRPaymentApp
9,473 vues
239 mentions
4
#StrategySkipsBitcoinPurchasesSpends$205MOnSTRCBuybacks
4,531 vues
77 mentions
5
#BitmineAdds10452ETH
45,415 vues
667 mentions
6
#SouthKoreaConsidersEducationTaxOnCryptoExchanges
25,570 vues
526 mentions
7
#OCCUrgesCommunityBanksToEnterStablecoinPayments
19,814 vues
358 mentions
8
#RippleWinsFullApprovalAsNationalTrustBank
27,463 vues
349 mentions
9
#AkashSelectsSolanaAsMigrationTarget
12,577 vues
170 mentions
10
#OndoToOpenSubscriptionsForOpenAIPreIPOTokenizedNotes
728 vues
25 mentions