
#elliottwavetheory
elliottwavetheory
82,608 vues
101 mentions
Populaire
Récents
·
--
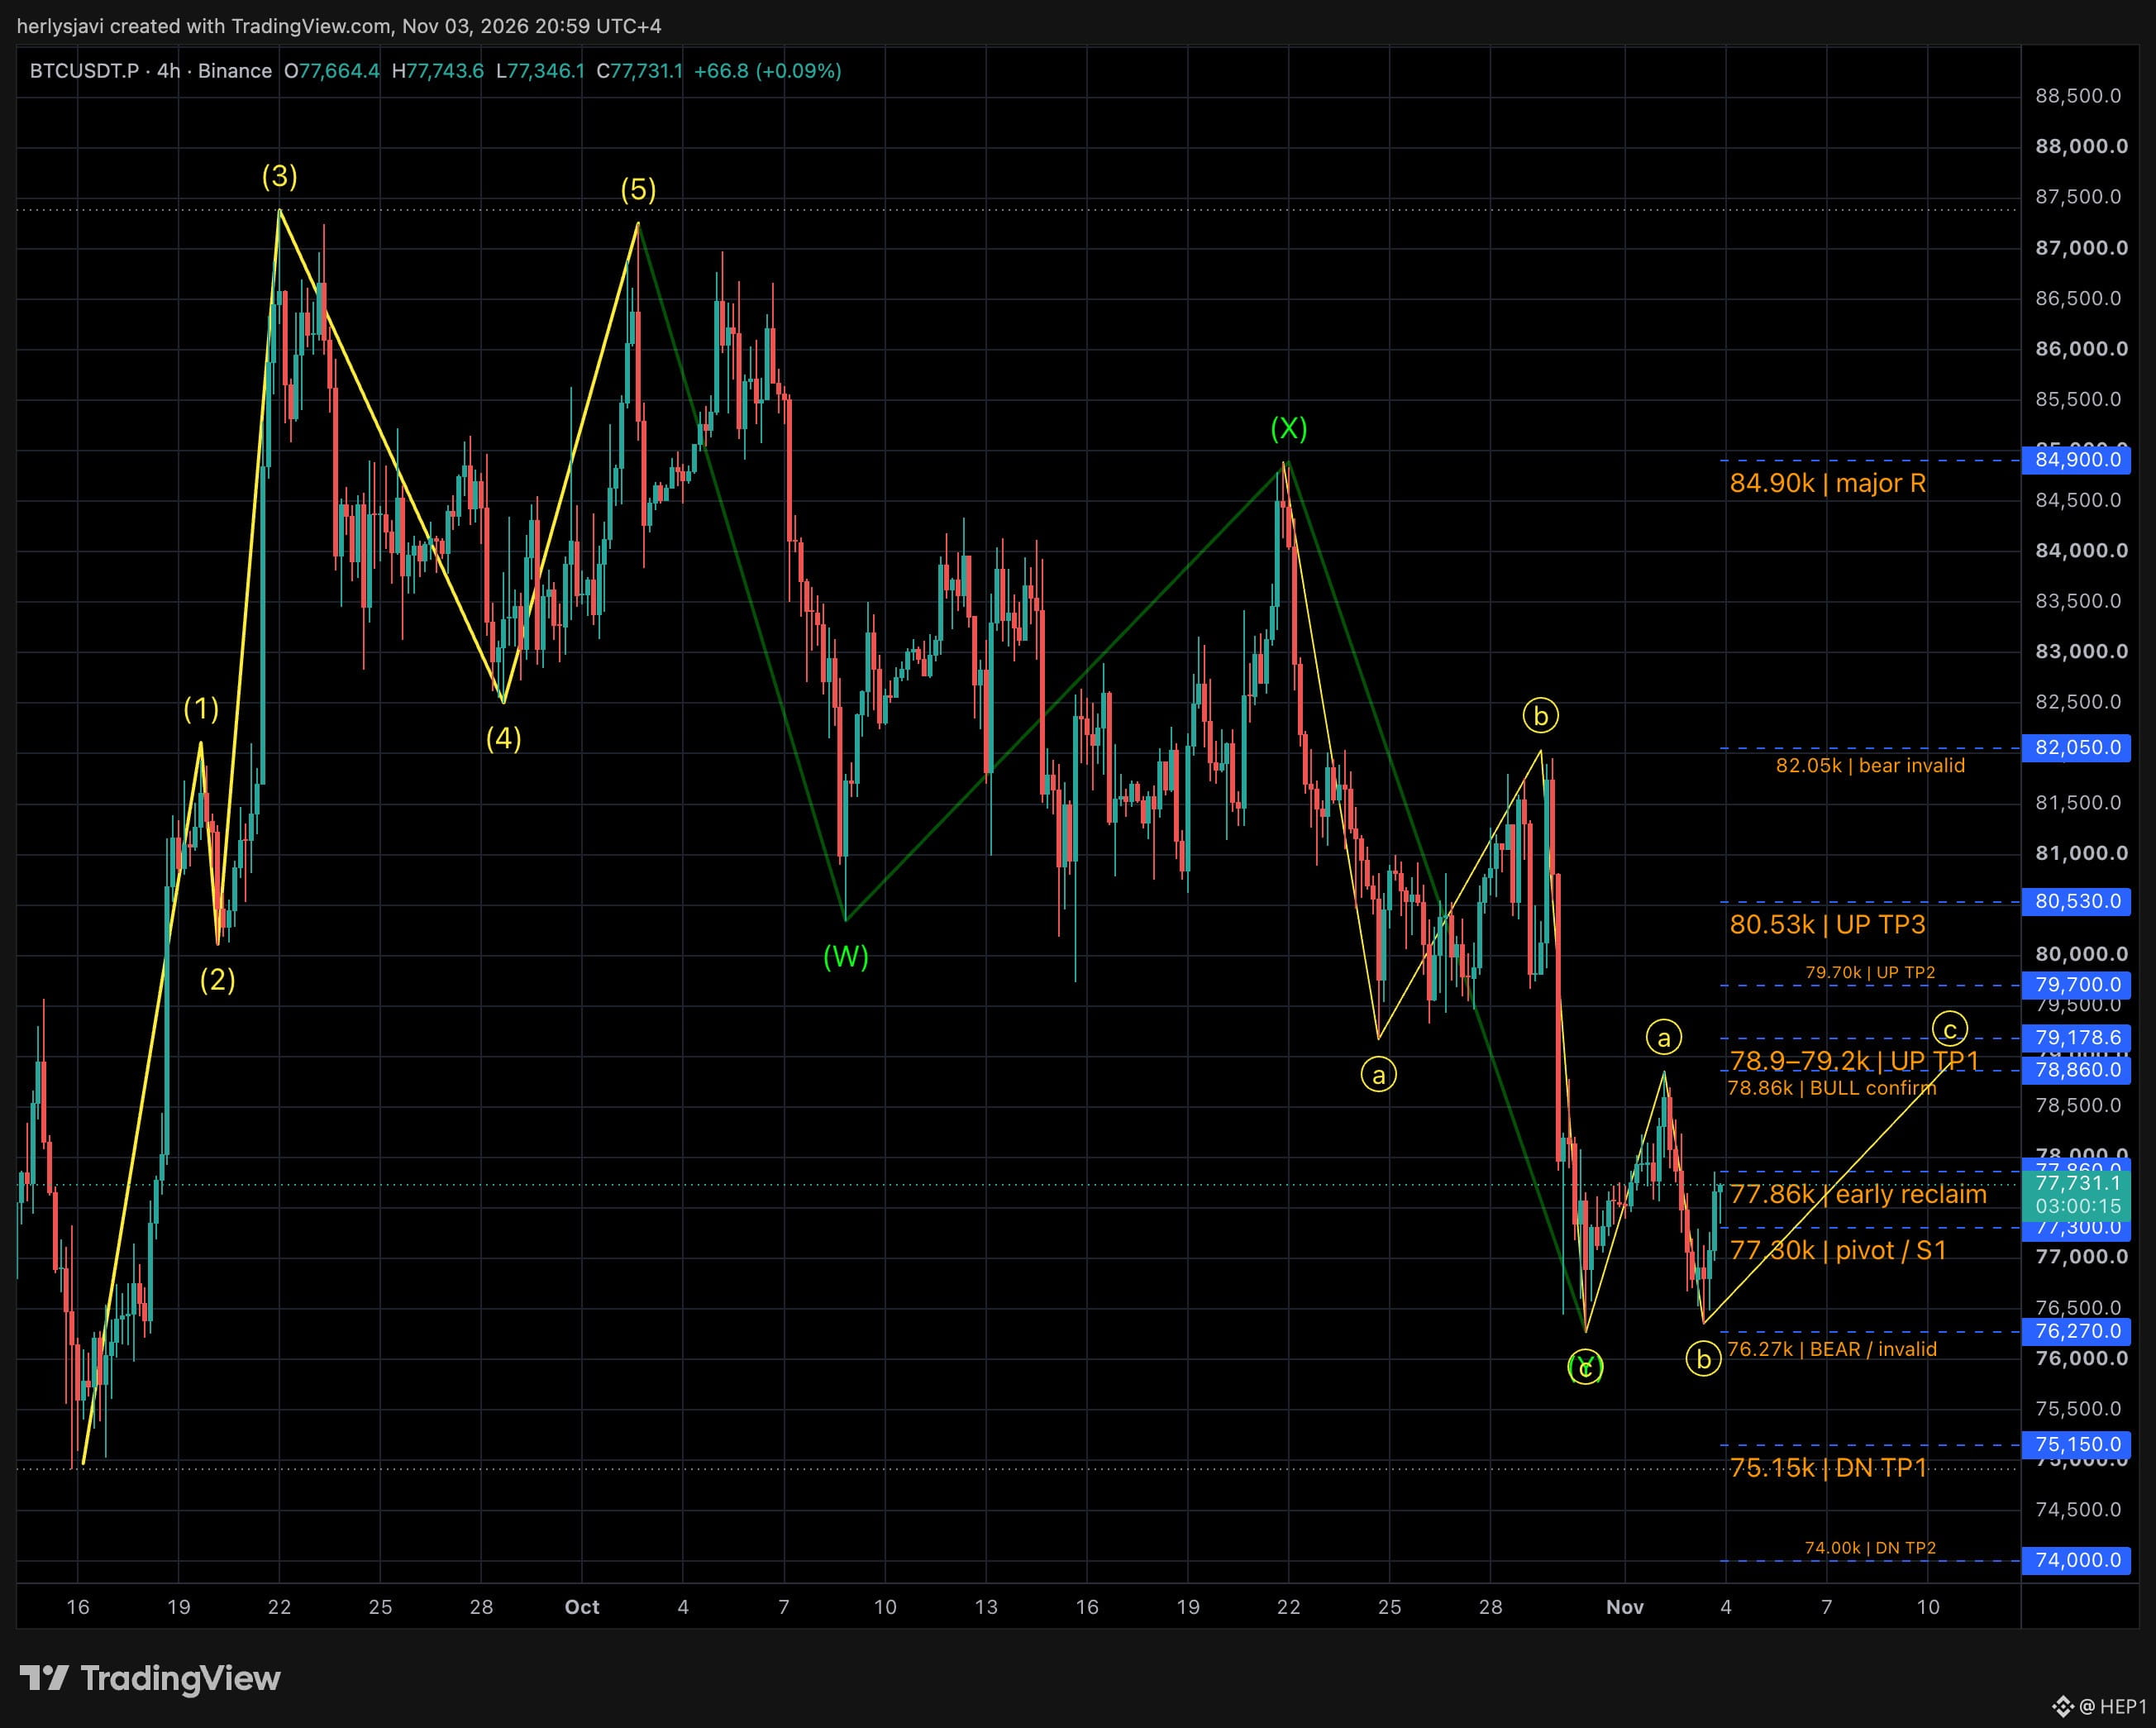
Mise à jour : la poursuite du mouvement se déroule comme prévu selon l’analyse précédente. La précédente cassure haussière au-dessus de 78 300 a atteint 78 853,5, avant de s’inverser. Le support à 76 270 tient toujours, donc un rebond en vague C reste possible. La tendance baissière générale persiste tant que BTC ne repasse pas au-dessus de 77 860, puis ne franchit pas 78 860.
Donnez votre avis.
#BTC #ElliottWaveTheory #elliottwaves #Tecnicalanalaysis
Mise à jour : la poursuite du mouvement se déroule comme prévu selon l’analyse précédente. La précédente cassure haussière au-dessus de 78 300 a atteint 78 853,5, avant de s’inverser. Le support à 76 270 tient toujours, donc un rebond en vague C reste possible. La tendance baissière générale persiste tant que BTC ne repasse pas au-dessus de 77 860, puis ne franchit pas 78 860.
Donnez votre avis.
#BTC #ElliottWaveTheory #elliottwaves #Tecnicalanalaysis
Donnez votre avis.
#BTC #ElliottWaveTheory #elliottwaves #Tecnicalanalaysis
HEP1
·
--
Mise à jour.
Haussier : au-dessus de 78 300, objectifs à 79 178,6 / 79 700 / 81 200.
Baissier : sous 76 270, objectifs à 75 150 / 74 000. L’ancien plus bas à 76 444 n’a pas tenu.
Le creux révisé en C/Y et le rebond ABC projeté restent hypothétiques.
Les cassures nécessitent une clôture en 4H et un retest.
Partagez vos réflexions
#elliottwaves #ElliottWaveTheory #elliot #elliotwave
Haussier : au-dessus de 78 300, objectifs à 79 178,6 / 79 700 / 81 200.
Baissier : sous 76 270, objectifs à 75 150 / 74 000. L’ancien plus bas à 76 444 n’a pas tenu.
Le creux révisé en C/Y et le rebond ABC projeté restent hypothétiques.
Les cassures nécessitent une clôture en 4H et un retest.
Partagez vos réflexions
#elliottwaves #ElliottWaveTheory #elliot #elliotwave
2
83

·
--
Baissier
$BTC | 1W UPDATE 📈
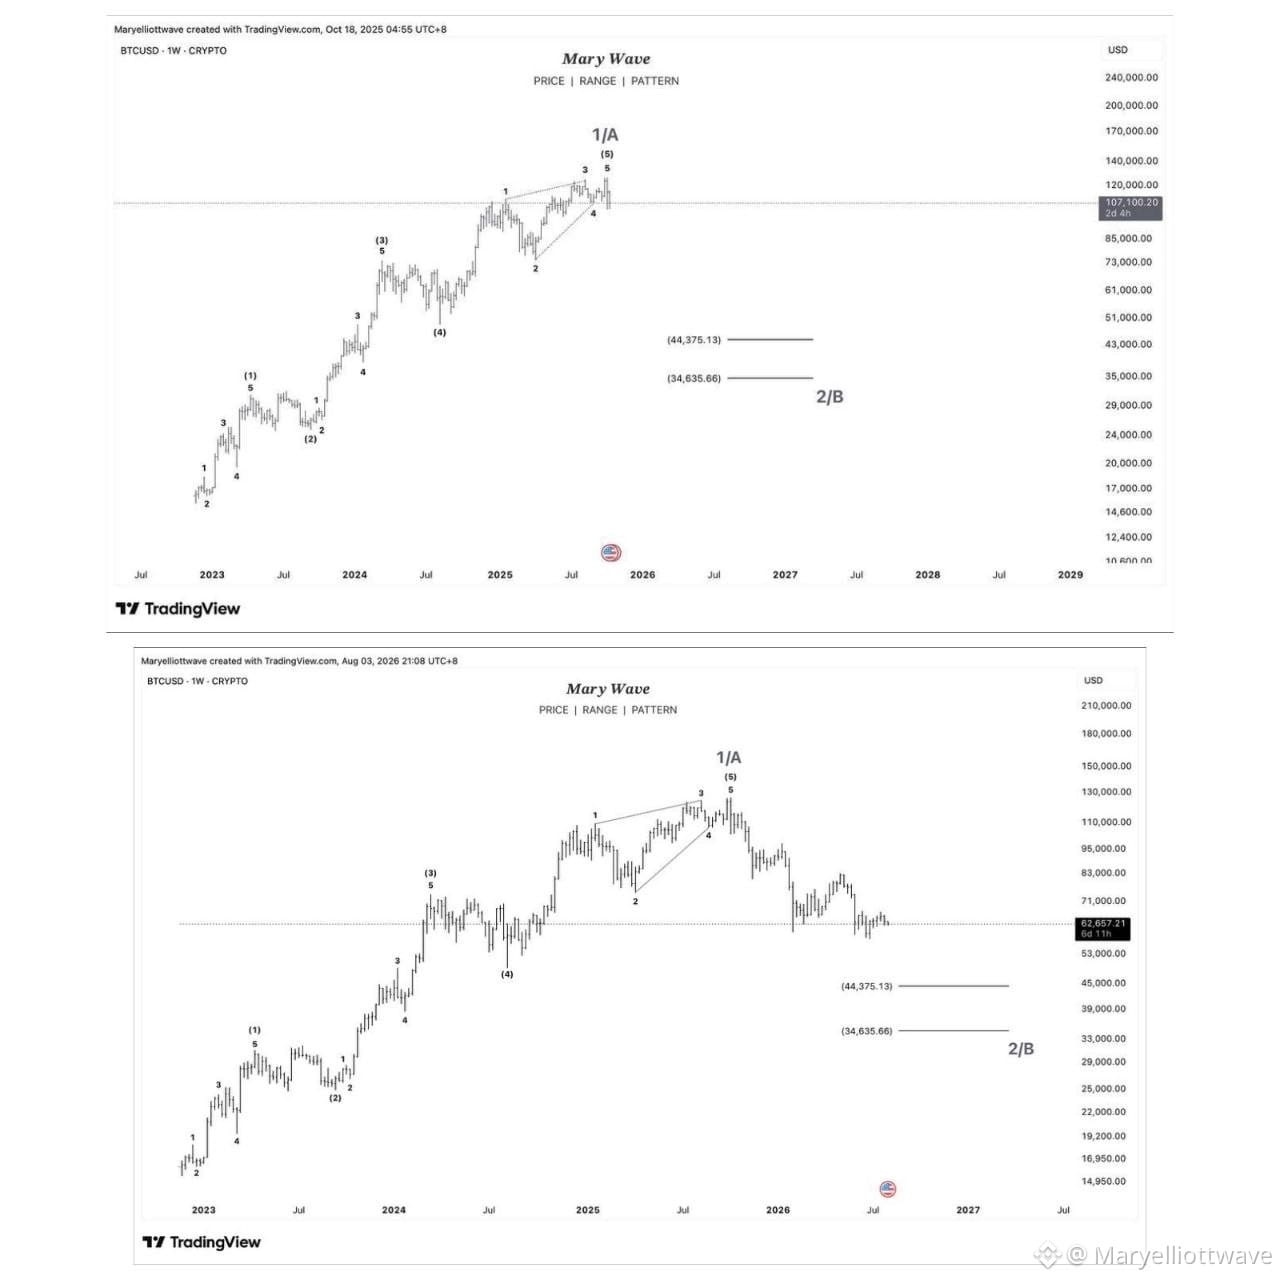
J’ai tracé cette feuille de route basée sur la théorie des Ondes d’Elliott le 18 octobre 2025. Le deuxième graphique montre comment le marché a évolué au 3 août 2026.
Lorsque j’ai d’abord partagé cette analyse, j’ai reçu beaucoup de critiques. Beaucoup pensaient que Bitcoin continuerait simplement de monter tout droit et qu’une correction plus profonde n’était pas possible. Ce n’est pas un problème : chacun est libre d’avoir sa propre vision du marché.
En tant qu’Elliottien, ma responsabilité n’est pas de prédire chaque mouvement avec certitude. Elle consiste à analyser le marché de manière objective en utilisant les règles des Ondes d’Elliott, à identifier la structure la plus probable, à définir les niveaux d’invalidation, et à ajuster uniquement lorsque le prix fournit une raison valable de le faire.
Il ne s’agit pas de prouver qui avait raison ou tort. Les marchés ne récompensent pas les opinions. Ils récompensent la discipline, la gestion du risque et la capacité à suivre un plan structuré.
Je ne suis pas un Elliottien parfait, et je ne prétends jamais l’être. Il y aura toujours des décomptes alternatifs, et je m’adapte dès que le marché invalide un scénario. C’est une partie de l’analyse professionnelle.
Je suis reconnaissant envers ceux qui ont pris le temps de comprendre le graphique avec un esprit ouvert. Certains ont même partagé que cela les avait aidés à gérer le risque et à prendre de meilleures décisions. Si vous n’êtes pas d’accord avec cette analyse, ce n’est pas grave du tout. Au lieu de la rejeter d’emblée, prenez le temps de comprendre la structure et le raisonnement qui la sous-tendent. Même si cela ne correspond pas à votre vision, cela peut tout de même offrir un autre point de vue.
Les Ondes d’Elliott ne consistent pas à prédire l’avenir avec certitude. Il s’agit de se préparer aux probabilités tout en respectant le risque.
#BTC #Bitcoin❗ #ElliottWaveTheory #TechnicalAnalysis
$BTC | 1W UPDATE 📈
J’ai tracé cette feuille de route basée sur la théorie des Ondes d’Elliott le 18 octobre 2025. Le deuxième graphique montre comment le marché a évolué au 3 août 2026.
Lorsque j’ai d’abord partagé cette analyse, j’ai reçu beaucoup de critiques. Beaucoup pensaient que Bitcoin continuerait simplement de monter tout droit et qu’une correction plus profonde n’était pas possible. Ce n’est pas un problème : chacun est libre d’avoir sa propre vision du marché.
En tant qu’Elliottien, ma responsabilité n’est pas de prédire chaque mouvement avec certitude. Elle consiste à analyser le marché de manière objective en utilisant les règles des Ondes d’Elliott, à identifier la structure la plus probable, à définir les niveaux d’invalidation, et à ajuster uniquement lorsque le prix fournit une raison valable de le faire.
Il ne s’agit pas de prouver qui avait raison ou tort. Les marchés ne récompensent pas les opinions. Ils récompensent la discipline, la gestion du risque et la capacité à suivre un plan structuré.
Je ne suis pas un Elliottien parfait, et je ne prétends jamais l’être. Il y aura toujours des décomptes alternatifs, et je m’adapte dès que le marché invalide un scénario. C’est une partie de l’analyse professionnelle.
Je suis reconnaissant envers ceux qui ont pris le temps de comprendre le graphique avec un esprit ouvert. Certains ont même partagé que cela les avait aidés à gérer le risque et à prendre de meilleures décisions. Si vous n’êtes pas d’accord avec cette analyse, ce n’est pas grave du tout. Au lieu de la rejeter d’emblée, prenez le temps de comprendre la structure et le raisonnement qui la sous-tendent. Même si cela ne correspond pas à votre vision, cela peut tout de même offrir un autre point de vue.
Les Ondes d’Elliott ne consistent pas à prédire l’avenir avec certitude. Il s’agit de se préparer aux probabilités tout en respectant le risque.
#BTC #Bitcoin❗ #ElliottWaveTheory #TechnicalAnalysis
J’ai tracé cette feuille de route basée sur la théorie des Ondes d’Elliott le 18 octobre 2025. Le deuxième graphique montre comment le marché a évolué au 3 août 2026.
Lorsque j’ai d’abord partagé cette analyse, j’ai reçu beaucoup de critiques. Beaucoup pensaient que Bitcoin continuerait simplement de monter tout droit et qu’une correction plus profonde n’était pas possible. Ce n’est pas un problème : chacun est libre d’avoir sa propre vision du marché.
En tant qu’Elliottien, ma responsabilité n’est pas de prédire chaque mouvement avec certitude. Elle consiste à analyser le marché de manière objective en utilisant les règles des Ondes d’Elliott, à identifier la structure la plus probable, à définir les niveaux d’invalidation, et à ajuster uniquement lorsque le prix fournit une raison valable de le faire.
Il ne s’agit pas de prouver qui avait raison ou tort. Les marchés ne récompensent pas les opinions. Ils récompensent la discipline, la gestion du risque et la capacité à suivre un plan structuré.
Je ne suis pas un Elliottien parfait, et je ne prétends jamais l’être. Il y aura toujours des décomptes alternatifs, et je m’adapte dès que le marché invalide un scénario. C’est une partie de l’analyse professionnelle.
Je suis reconnaissant envers ceux qui ont pris le temps de comprendre le graphique avec un esprit ouvert. Certains ont même partagé que cela les avait aidés à gérer le risque et à prendre de meilleures décisions. Si vous n’êtes pas d’accord avec cette analyse, ce n’est pas grave du tout. Au lieu de la rejeter d’emblée, prenez le temps de comprendre la structure et le raisonnement qui la sous-tendent. Même si cela ne correspond pas à votre vision, cela peut tout de même offrir un autre point de vue.
Les Ondes d’Elliott ne consistent pas à prédire l’avenir avec certitude. Il s’agit de se préparer aux probabilités tout en respectant le risque.
#BTC #Bitcoin❗ #ElliottWaveTheory #TechnicalAnalysis
2
234
$PEPE | 5D OUTLOOK 📉
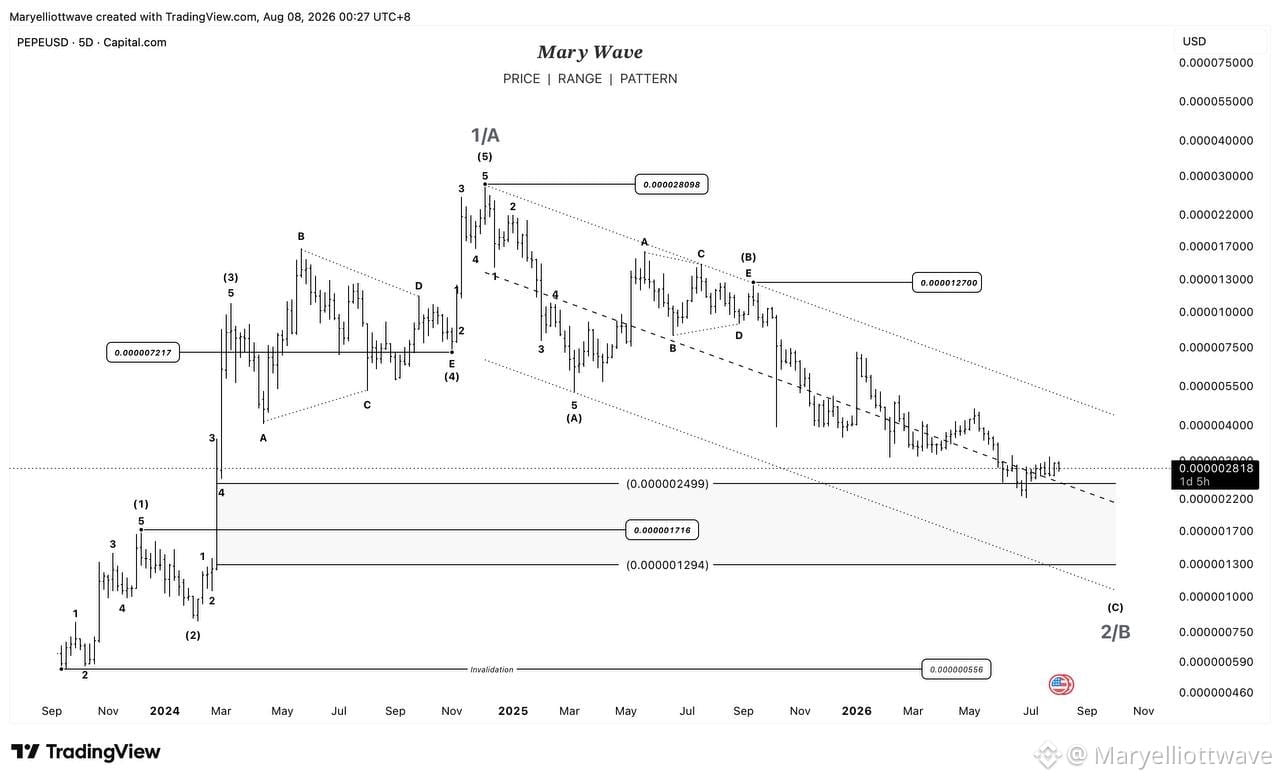
PEPE continue de se développer au sein d’une structure corrective plus large après l’achèvement d’une avancée impulsive plus grande identifiée comme la vague 1/A près de 0,000028098 $.
D’un point de vue de la théorie des vagues d’Elliott, la baisse à partir de ce sommet semble s’inscrire dans une correction en A-B-C, la vague (A) étant déjà terminée et la vague (B) en train de former un triangle correctif avant que le prix ne reprenne sa baisse. Le scénario privilégié suggère que la vague (C) de la plus grande vague 2/B est encore en cours.
Tant que la structure baissière plus large reste intacte, PEPE pourrait continuer de baisser vers la zone de support 0,000002499–0,000001294 $, qui demeure mon principal centre d’intérêt pour l’éventuelle complétion de la vague 2/B.
Le décompte plus large haussier basé sur les vagues d’Elliott reste valide tant que le prix demeure au-dessus du niveau d’invalidation majeur à 0,000000556 $. Si la correction se termine finalement en respectant ce niveau, je réévaluerai la structure à la recherche de signes de la prochaine avancée impulsive plus grande.
Le marché décidera en fin de compte si ce décompte des vagues d’Elliott reste valide. D’ici là, je continue de respecter la structure corrective actuelle et je reste flexible si l’évolution des prix fournit une raison valable de réévaluer le décompte.
Cette analyse est uniquement à des fins éducatives et ne doit pas être considérée comme un conseil financier.
#PEPE #PEPEUSDT #Cryptocurrency #ElliottWaveTheory #TechnicalAnalysis
$PEPE | 5D OUTLOOK 📉
PEPE continue de se développer au sein d’une structure corrective plus large après l’achèvement d’une avancée impulsive plus grande identifiée comme la vague 1/A près de 0,000028098 $.
D’un point de vue de la théorie des vagues d’Elliott, la baisse à partir de ce sommet semble s’inscrire dans une correction en A-B-C, la vague (A) étant déjà terminée et la vague (B) en train de former un triangle correctif avant que le prix ne reprenne sa baisse. Le scénario privilégié suggère que la vague (C) de la plus grande vague 2/B est encore en cours.
Tant que la structure baissière plus large reste intacte, PEPE pourrait continuer de baisser vers la zone de support 0,000002499–0,000001294 $, qui demeure mon principal centre d’intérêt pour l’éventuelle complétion de la vague 2/B.
Le décompte plus large haussier basé sur les vagues d’Elliott reste valide tant que le prix demeure au-dessus du niveau d’invalidation majeur à 0,000000556 $. Si la correction se termine finalement en respectant ce niveau, je réévaluerai la structure à la recherche de signes de la prochaine avancée impulsive plus grande.
Le marché décidera en fin de compte si ce décompte des vagues d’Elliott reste valide. D’ici là, je continue de respecter la structure corrective actuelle et je reste flexible si l’évolution des prix fournit une raison valable de réévaluer le décompte.
Cette analyse est uniquement à des fins éducatives et ne doit pas être considérée comme un conseil financier.
#PEPE #PEPEUSDT #Cryptocurrency #ElliottWaveTheory #TechnicalAnalysis
PEPE continue de se développer au sein d’une structure corrective plus large après l’achèvement d’une avancée impulsive plus grande identifiée comme la vague 1/A près de 0,000028098 $.
D’un point de vue de la théorie des vagues d’Elliott, la baisse à partir de ce sommet semble s’inscrire dans une correction en A-B-C, la vague (A) étant déjà terminée et la vague (B) en train de former un triangle correctif avant que le prix ne reprenne sa baisse. Le scénario privilégié suggère que la vague (C) de la plus grande vague 2/B est encore en cours.
Tant que la structure baissière plus large reste intacte, PEPE pourrait continuer de baisser vers la zone de support 0,000002499–0,000001294 $, qui demeure mon principal centre d’intérêt pour l’éventuelle complétion de la vague 2/B.
Le décompte plus large haussier basé sur les vagues d’Elliott reste valide tant que le prix demeure au-dessus du niveau d’invalidation majeur à 0,000000556 $. Si la correction se termine finalement en respectant ce niveau, je réévaluerai la structure à la recherche de signes de la prochaine avancée impulsive plus grande.
Le marché décidera en fin de compte si ce décompte des vagues d’Elliott reste valide. D’ici là, je continue de respecter la structure corrective actuelle et je reste flexible si l’évolution des prix fournit une raison valable de réévaluer le décompte.
Cette analyse est uniquement à des fins éducatives et ne doit pas être considérée comme un conseil financier.
#PEPE #PEPEUSDT #Cryptocurrency #ElliottWaveTheory #TechnicalAnalysis
7
3.8k

·
--
Haussier
📉 Perspectives des vagues d’Elliott : le $BTC pourrait-il viser 52 000 $ ?
Selon la théorie des vagues d’Elliott, la vague 3 ne peut pas être la plus courte dans un cycle à cinq vagues.
📊 La vague 3 a reculé d’environ 38,5 %, tandis que la vague 5 actuelle est en baisse d’environ 30 %. Si la vague 5 se termine avec une ampleur similaire, un objectif de baisse potentiel se situerait près de 52 000 $.
⚠️ Il s’agit d’une analyse macroéconomique de marché, et non d’un signal de trading à court terme. Si BTC atteint cette zone, elle pourrait devenir un secteur clé à surveiller pour des opportunités à long terme.
#BTC #Bitcoin #Crypto #Trading #ElliottWaveTheory $BTC
📉 Perspectives des vagues d’Elliott : le $BTC pourrait-il viser 52 000 $ ?
Selon la théorie des vagues d’Elliott, la vague 3 ne peut pas être la plus courte dans un cycle à cinq vagues.
📊 La vague 3 a reculé d’environ 38,5 %, tandis que la vague 5 actuelle est en baisse d’environ 30 %. Si la vague 5 se termine avec une ampleur similaire, un objectif de baisse potentiel se situerait près de 52 000 $.
⚠️ Il s’agit d’une analyse macroéconomique de marché, et non d’un signal de trading à court terme. Si BTC atteint cette zone, elle pourrait devenir un secteur clé à surveiller pour des opportunités à long terme.
#BTC #Bitcoin #Crypto #Trading #ElliottWaveTheory $BTC
Selon la théorie des vagues d’Elliott, la vague 3 ne peut pas être la plus courte dans un cycle à cinq vagues.
📊 La vague 3 a reculé d’environ 38,5 %, tandis que la vague 5 actuelle est en baisse d’environ 30 %. Si la vague 5 se termine avec une ampleur similaire, un objectif de baisse potentiel se situerait près de 52 000 $.
⚠️ Il s’agit d’une analyse macroéconomique de marché, et non d’un signal de trading à court terme. Si BTC atteint cette zone, elle pourrait devenir un secteur clé à surveiller pour des opportunités à long terme.
#BTC #Bitcoin #Crypto #Trading #ElliottWaveTheory $BTC
1
67
·
--
Haussier
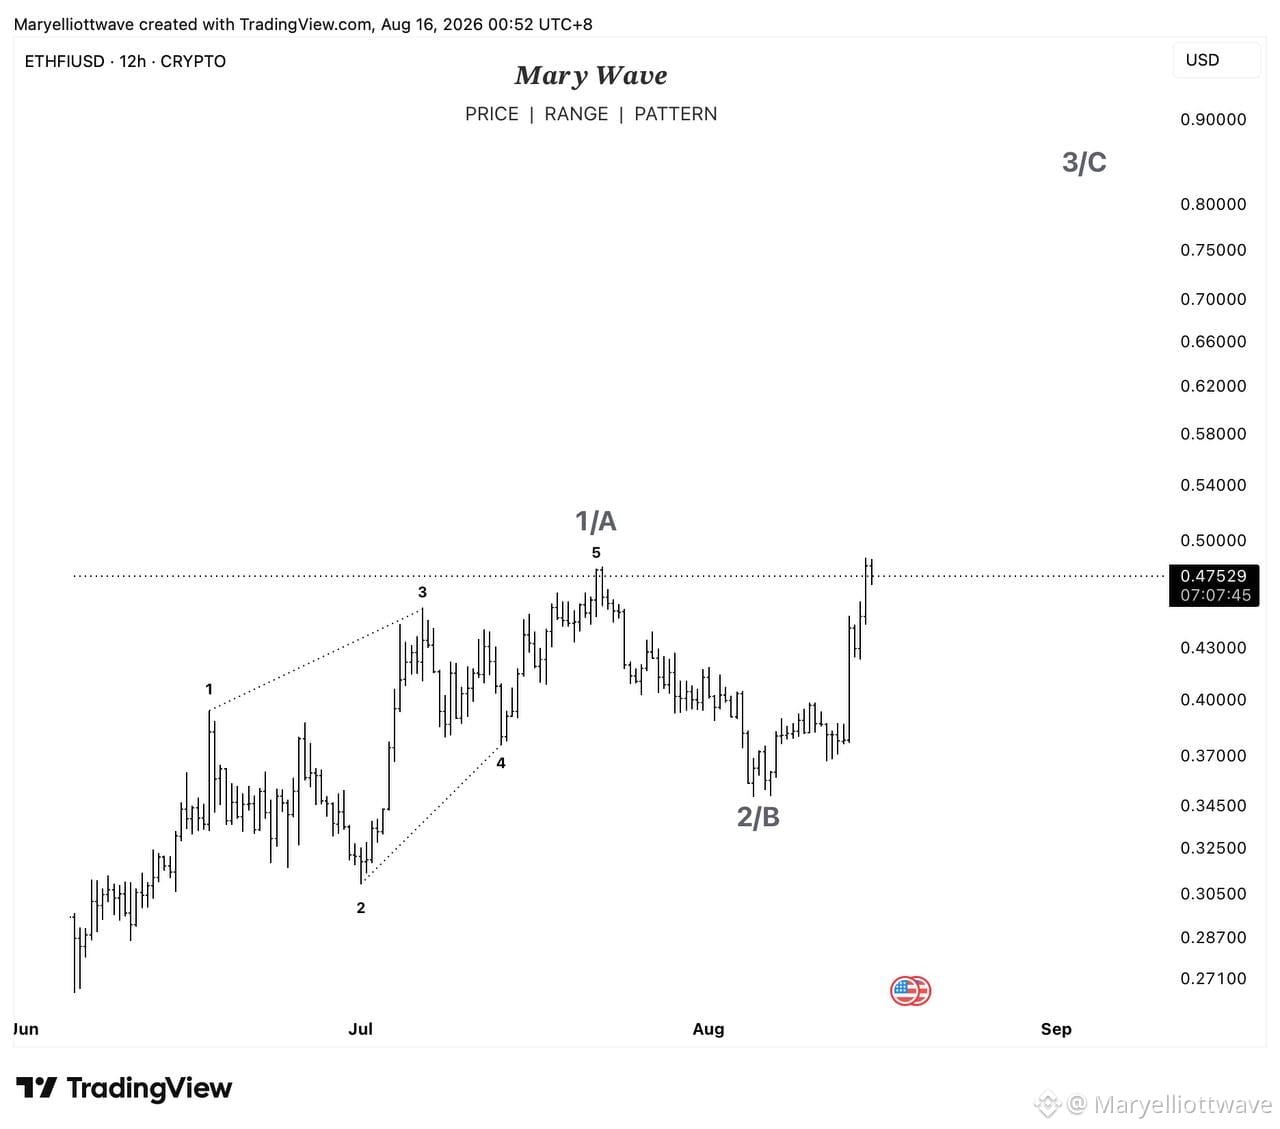
$ETHFI | Perspectives à 12H 📊
ETHFI semble avoir terminé l’onde 2/B après la progression vers l’onde 1/A.
Le prix teste maintenant le précédent plus haut, autour de la zone de 0,48 $. Une cassure durable au-dessus de ce niveau renforcerait le scénario selon lequel l’onde 3/C est déjà en cours.
Pour l’instant, je surveille la structure et la manière dont le prix réagit autour du plus haut de l’onde 1/A.
À des fins éducatives uniquement. Pas un conseil financier.
#ETHFIUSDT #ElliottWaveTheory
$ETHFI | Perspectives à 12H 📊
ETHFI semble avoir terminé l’onde 2/B après la progression vers l’onde 1/A.
Le prix teste maintenant le précédent plus haut, autour de la zone de 0,48 $. Une cassure durable au-dessus de ce niveau renforcerait le scénario selon lequel l’onde 3/C est déjà en cours.
Pour l’instant, je surveille la structure et la manière dont le prix réagit autour du plus haut de l’onde 1/A.
À des fins éducatives uniquement. Pas un conseil financier.
#ETHFIUSDT #ElliottWaveTheory
ETHFI semble avoir terminé l’onde 2/B après la progression vers l’onde 1/A.
Le prix teste maintenant le précédent plus haut, autour de la zone de 0,48 $. Une cassure durable au-dessus de ce niveau renforcerait le scénario selon lequel l’onde 3/C est déjà en cours.
Pour l’instant, je surveille la structure et la manière dont le prix réagit autour du plus haut de l’onde 1/A.
À des fins éducatives uniquement. Pas un conseil financier.
#ETHFIUSDT #ElliottWaveTheory
5
6.6k
·
--
Haussier
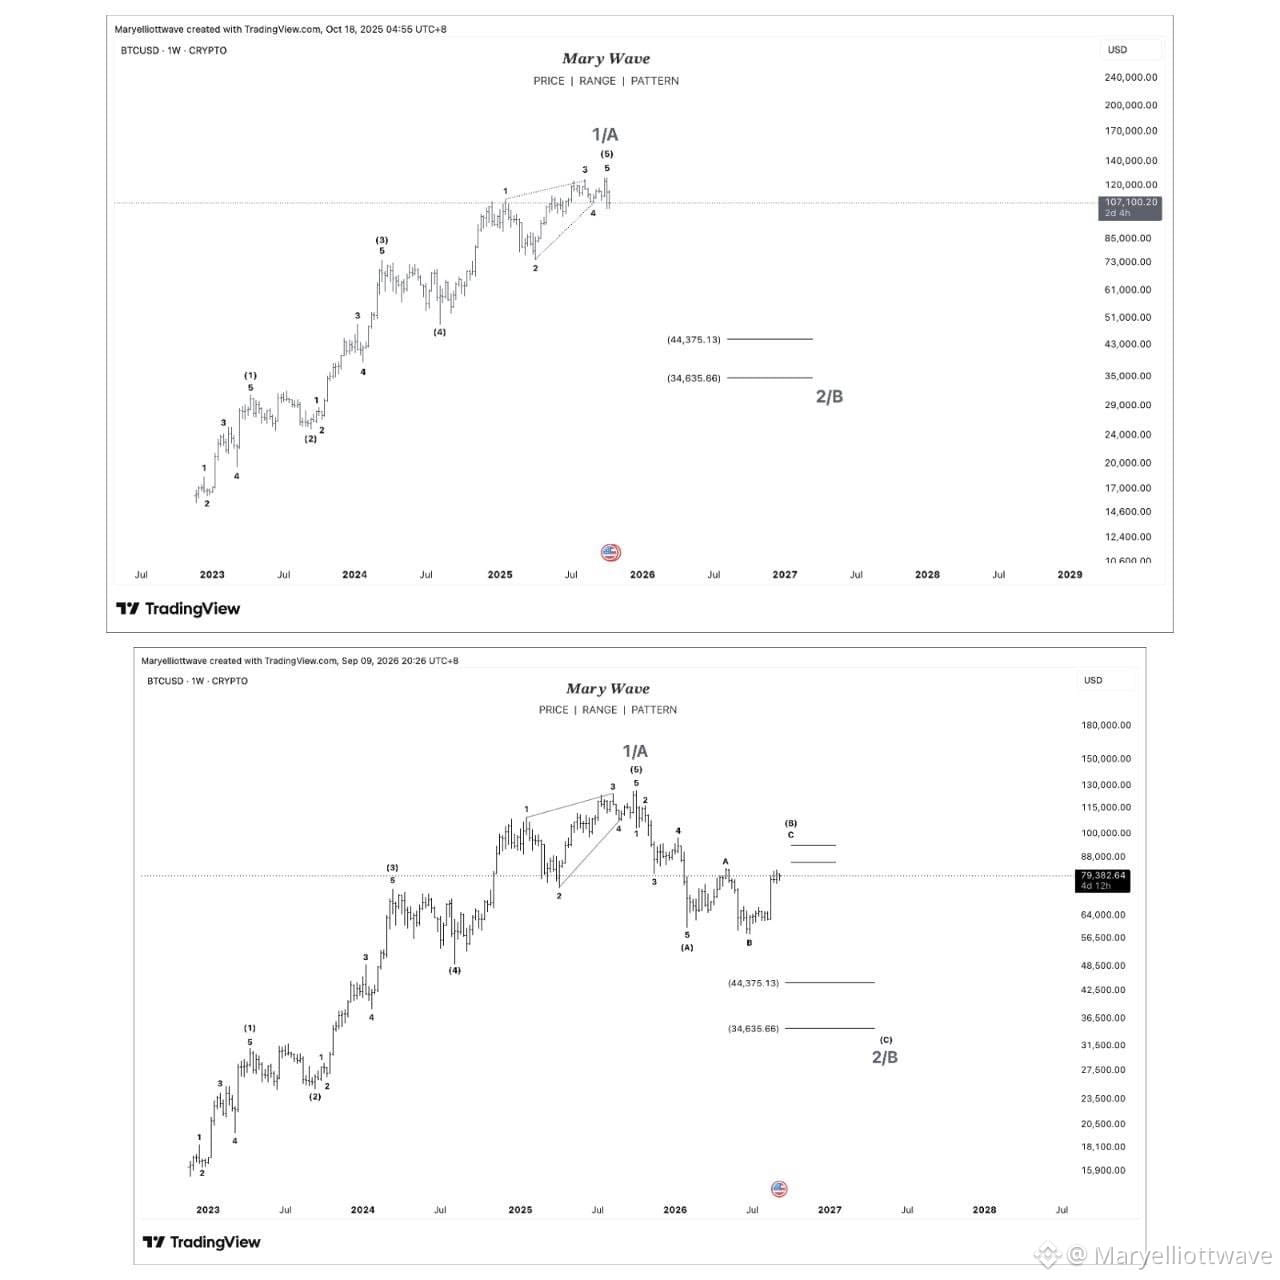
$BTC | 1W PERSPECTIVE MACRO
Un regard en arrière sur l’image d’ensemble.
Le nombre initial de macro était déjà en train de suivre l’achèvement de 1/A, avec 44 375,13 et 34 635,66 marqués comme les zones plus profondes à surveiller pour la correction plus large de 2/B.
Au fur et à mesure que le prix évoluait, la structure a commencé à se dévoiler plus clairement.
À ce stade, je suis en train d’évaluer la possibilité que la vague (A) de 2/B soit terminée, puis que la reprise actuelle A-B-C pour la vague (B) soit en cours.
Si cette reprise s’achève et que la structure confirme une baisse, la prochaine phase que je surveillerai est la vague (C) vers les mêmes zones macro projetées :
44 375,13 • 34 635,66
Avertissement : Il s’agit de mon analyse personnelle des Ondes d’Elliott, partagée uniquement à des fins éducatives. Ce n’est pas un conseil financier. Faites toujours vos propres recherches et gérez votre risque.
#Bitcoin #ElliottWaveTheory
$BTC | 1W PERSPECTIVE MACRO
Un regard en arrière sur l’image d’ensemble.
Le nombre initial de macro était déjà en train de suivre l’achèvement de 1/A, avec 44 375,13 et 34 635,66 marqués comme les zones plus profondes à surveiller pour la correction plus large de 2/B.
Au fur et à mesure que le prix évoluait, la structure a commencé à se dévoiler plus clairement.
À ce stade, je suis en train d’évaluer la possibilité que la vague (A) de 2/B soit terminée, puis que la reprise actuelle A-B-C pour la vague (B) soit en cours.
Si cette reprise s’achève et que la structure confirme une baisse, la prochaine phase que je surveillerai est la vague (C) vers les mêmes zones macro projetées :
44 375,13 • 34 635,66
Avertissement : Il s’agit de mon analyse personnelle des Ondes d’Elliott, partagée uniquement à des fins éducatives. Ce n’est pas un conseil financier. Faites toujours vos propres recherches et gérez votre risque.
#Bitcoin #ElliottWaveTheory
Un regard en arrière sur l’image d’ensemble.
Le nombre initial de macro était déjà en train de suivre l’achèvement de 1/A, avec 44 375,13 et 34 635,66 marqués comme les zones plus profondes à surveiller pour la correction plus large de 2/B.
Au fur et à mesure que le prix évoluait, la structure a commencé à se dévoiler plus clairement.
À ce stade, je suis en train d’évaluer la possibilité que la vague (A) de 2/B soit terminée, puis que la reprise actuelle A-B-C pour la vague (B) soit en cours.
Si cette reprise s’achève et que la structure confirme une baisse, la prochaine phase que je surveillerai est la vague (C) vers les mêmes zones macro projetées :
44 375,13 • 34 635,66
Avertissement : Il s’agit de mon analyse personnelle des Ondes d’Elliott, partagée uniquement à des fins éducatives. Ce n’est pas un conseil financier. Faites toujours vos propres recherches et gérez votre risque.
#Bitcoin #ElliottWaveTheory
1
1.3k

·
--
Haussier
$ETHFI | Vue sur 12 heures 📊
Il semble qu’ETHFI ait terminé l’onde 2/B après l’impulsion vers l’onde 1/A.
À présent, le prix teste le précédent sommet près de la zone de 0,48 $. Si une cassure durable au-dessus de ce niveau se produit, cela renforcera la probabilité que l’onde 3/C ait déjà commencé.
Pour le moment, j’observe la structure et la manière dont le prix réagit autour du sommet de l’onde 1/A.
Uniquement à des fins éducatives. Ce n’est pas un conseil financier.
#ETHFIUSDT #ElliottWaveTheory
$ETHFI | Vue sur 12 heures 📊
Il semble qu’ETHFI ait terminé l’onde 2/B après l’impulsion vers l’onde 1/A.
À présent, le prix teste le précédent sommet près de la zone de 0,48 $. Si une cassure durable au-dessus de ce niveau se produit, cela renforcera la probabilité que l’onde 3/C ait déjà commencé.
Pour le moment, j’observe la structure et la manière dont le prix réagit autour du sommet de l’onde 1/A.
Uniquement à des fins éducatives. Ce n’est pas un conseil financier.
#ETHFIUSDT #ElliottWaveTheory
Il semble qu’ETHFI ait terminé l’onde 2/B après l’impulsion vers l’onde 1/A.
À présent, le prix teste le précédent sommet près de la zone de 0,48 $. Si une cassure durable au-dessus de ce niveau se produit, cela renforcera la probabilité que l’onde 3/C ait déjà commencé.
Pour le moment, j’observe la structure et la manière dont le prix réagit autour du sommet de l’onde 1/A.
Uniquement à des fins éducatives. Ce n’est pas un conseil financier.
#ETHFIUSDT #ElliottWaveTheory
1
181
·
--
Haussier
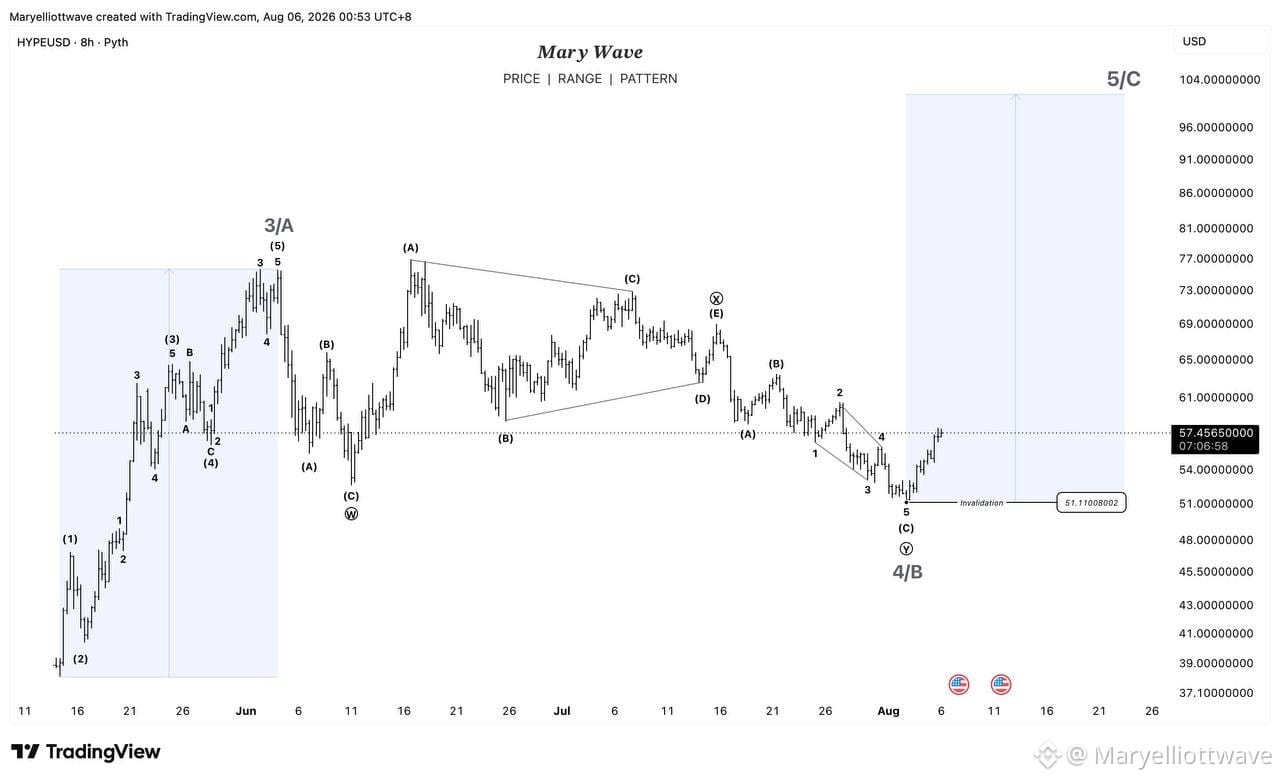
$HYPE | 8H OUTLOOK 📈
$HYPE semble avoir achevé une correction complexe de type Wave 4/B, le prix affichant désormais les premières étapes d’une avancée impulsive potentielle.
Du point de vue des Ondes d’Elliott, la baisse récente semble terminée, suivie par une structure initiale en cinq vagues à partir des plus bas. Si ce décompte reste valide, le marché pourrait maintenant développer la Wave 5/C, avec un objectif haussier proche de la zone des 100 $.
Le décompte actuel des Ondes d’Elliott reste valide tant que le prix se maintient au-dessus du niveau d’invalidation à 51,11 $. Une cassure en dessous de ce niveau invaliderait le scénario haussier privilégié et nécessiterait une réévaluation de la structure des vagues.
Les Ondes d’Elliott ne consistent pas à prédire chaque mouvement avec certitude. Il s’agit d’identifier la structure de marché la plus probable, de définir des niveaux d’invalidation objectifs et de s’adapter uniquement lorsque l’évolution des prix fournit une raison valable de le faire.
Cette analyse est fournie à des fins éducatives uniquement et ne doit pas être considérée comme un conseil financier.
#HYPE #Hyperliquid #ElliottWaveTheory #TechnicalAnalysis
$HYPE | 8H OUTLOOK 📈
$HYPE semble avoir achevé une correction complexe de type Wave 4/B, le prix affichant désormais les premières étapes d’une avancée impulsive potentielle.
Du point de vue des Ondes d’Elliott, la baisse récente semble terminée, suivie par une structure initiale en cinq vagues à partir des plus bas. Si ce décompte reste valide, le marché pourrait maintenant développer la Wave 5/C, avec un objectif haussier proche de la zone des 100 $.
Le décompte actuel des Ondes d’Elliott reste valide tant que le prix se maintient au-dessus du niveau d’invalidation à 51,11 $. Une cassure en dessous de ce niveau invaliderait le scénario haussier privilégié et nécessiterait une réévaluation de la structure des vagues.
Les Ondes d’Elliott ne consistent pas à prédire chaque mouvement avec certitude. Il s’agit d’identifier la structure de marché la plus probable, de définir des niveaux d’invalidation objectifs et de s’adapter uniquement lorsque l’évolution des prix fournit une raison valable de le faire.
Cette analyse est fournie à des fins éducatives uniquement et ne doit pas être considérée comme un conseil financier.
#HYPE #Hyperliquid #ElliottWaveTheory #TechnicalAnalysis
$HYPE semble avoir achevé une correction complexe de type Wave 4/B, le prix affichant désormais les premières étapes d’une avancée impulsive potentielle.
Du point de vue des Ondes d’Elliott, la baisse récente semble terminée, suivie par une structure initiale en cinq vagues à partir des plus bas. Si ce décompte reste valide, le marché pourrait maintenant développer la Wave 5/C, avec un objectif haussier proche de la zone des 100 $.
Le décompte actuel des Ondes d’Elliott reste valide tant que le prix se maintient au-dessus du niveau d’invalidation à 51,11 $. Une cassure en dessous de ce niveau invaliderait le scénario haussier privilégié et nécessiterait une réévaluation de la structure des vagues.
Les Ondes d’Elliott ne consistent pas à prédire chaque mouvement avec certitude. Il s’agit d’identifier la structure de marché la plus probable, de définir des niveaux d’invalidation objectifs et de s’adapter uniquement lorsque l’évolution des prix fournit une raison valable de le faire.
Cette analyse est fournie à des fins éducatives uniquement et ne doit pas être considérée comme un conseil financier.
#HYPE #Hyperliquid #ElliottWaveTheory #TechnicalAnalysis
1
236
Bonjour, Binance Square ! 👋
Je m’appelle Mary, je viens des Philippines, et je suis la fondatrice de Wave3.
Je suis utilisatrice de Binance depuis plus de 7,5 ans, et je suis ravie de commencer enfin à partager mon parcours ici sur Binance Square.
Je suis passionnée par l’aide aux traders pour comprendre les marchés grâce à la théorie des vagues d’Elliott, la psychologie du trading et la gestion des risques. Chez Wave3, nous nous engageons à aider les traders à devenir plus disciplinés, plus indépendants et plus confiants dans leurs décisions. Je suis incroyablement fière de constater que de nombreux membres de notre communauté sont parvenus à devenir des champions lors de compétitions de trading aux Philippines.
Au-delà du trading, je suis également passionnée par l’éducation à la blockchain. Avec mon cofondateur, j’ai coécrit le manuel Wave3, un livre éducatif sur la théorie des vagues d’Elliott, officiellement enregistré à la Bibliothèque nationale des Philippines et doté d’un ISBN.
Au fil des années, j’ai eu le privilège de collaborer avec plusieurs grandes plateformes d’échanges de crypto en tant que KOL, partenaire affilié et membre VIP. Ces expériences m’ont permis de rencontrer et de soutenir des milliers de traders tout en contribuant à la croissance de l’écosystème Web3 grâce à l’éducation.
Je ne crois pas au fait de suivre aveuglément des signaux. Je pense que les meilleurs traders comprennent pourquoi le marché bouge. Mon objectif est d’aider les traders à comprendre la structure du marché, à penser par eux-mêmes, à gérer efficacement le risque et à construire une constance sur le long terme.
Ici sur Binance Square, je partagerai des analyses de la théorie des vagues d’Elliott et des enseignements éducatifs sur la crypto, le forex, les actions, les matières premières et les indices. Que vous soyez débutant en trading ou trader déjà expérimenté, j’espère que mon contenu vous aidera à devenir plus confiant et plus constant sur les marchés.
Si vous aimez les analyses objectives du marché et les contenus de trading éducatifs, j’adorerais que vous vous joigniez à moi dans cette aventure. N’hésitez pas à me suivre, et continuons à apprendre et à grandir ensemble.
On se retrouve dans la prochaine vague. 🌊📈
Quel marché souhaitez-vous que j’analyse en premier ? 👇
#BinanceSquare #ElliottWaveTheory #TechnicalAnalysis #TradingEducation #RiskManagement
Bonjour, Binance Square ! 👋
Je m’appelle Mary, je viens des Philippines, et je suis la fondatrice de Wave3.
Je suis utilisatrice de Binance depuis plus de 7,5 ans, et je suis ravie de commencer enfin à partager mon parcours ici sur Binance Square.
Je suis passionnée par l’aide aux traders pour comprendre les marchés grâce à la théorie des vagues d’Elliott, la psychologie du trading et la gestion des risques. Chez Wave3, nous nous engageons à aider les traders à devenir plus disciplinés, plus indépendants et plus confiants dans leurs décisions. Je suis incroyablement fière de constater que de nombreux membres de notre communauté sont parvenus à devenir des champions lors de compétitions de trading aux Philippines.
Au-delà du trading, je suis également passionnée par l’éducation à la blockchain. Avec mon cofondateur, j’ai coécrit le manuel Wave3, un livre éducatif sur la théorie des vagues d’Elliott, officiellement enregistré à la Bibliothèque nationale des Philippines et doté d’un ISBN.
Au fil des années, j’ai eu le privilège de collaborer avec plusieurs grandes plateformes d’échanges de crypto en tant que KOL, partenaire affilié et membre VIP. Ces expériences m’ont permis de rencontrer et de soutenir des milliers de traders tout en contribuant à la croissance de l’écosystème Web3 grâce à l’éducation.
Je ne crois pas au fait de suivre aveuglément des signaux. Je pense que les meilleurs traders comprennent pourquoi le marché bouge. Mon objectif est d’aider les traders à comprendre la structure du marché, à penser par eux-mêmes, à gérer efficacement le risque et à construire une constance sur le long terme.
Ici sur Binance Square, je partagerai des analyses de la théorie des vagues d’Elliott et des enseignements éducatifs sur la crypto, le forex, les actions, les matières premières et les indices. Que vous soyez débutant en trading ou trader déjà expérimenté, j’espère que mon contenu vous aidera à devenir plus confiant et plus constant sur les marchés.
Si vous aimez les analyses objectives du marché et les contenus de trading éducatifs, j’adorerais que vous vous joigniez à moi dans cette aventure. N’hésitez pas à me suivre, et continuons à apprendre et à grandir ensemble.
On se retrouve dans la prochaine vague. 🌊📈
Quel marché souhaitez-vous que j’analyse en premier ? 👇
#BinanceSquare #ElliottWaveTheory #TechnicalAnalysis #TradingEducation #RiskManagement
Je m’appelle Mary, je viens des Philippines, et je suis la fondatrice de Wave3.
Je suis utilisatrice de Binance depuis plus de 7,5 ans, et je suis ravie de commencer enfin à partager mon parcours ici sur Binance Square.
Je suis passionnée par l’aide aux traders pour comprendre les marchés grâce à la théorie des vagues d’Elliott, la psychologie du trading et la gestion des risques. Chez Wave3, nous nous engageons à aider les traders à devenir plus disciplinés, plus indépendants et plus confiants dans leurs décisions. Je suis incroyablement fière de constater que de nombreux membres de notre communauté sont parvenus à devenir des champions lors de compétitions de trading aux Philippines.
Au-delà du trading, je suis également passionnée par l’éducation à la blockchain. Avec mon cofondateur, j’ai coécrit le manuel Wave3, un livre éducatif sur la théorie des vagues d’Elliott, officiellement enregistré à la Bibliothèque nationale des Philippines et doté d’un ISBN.
Au fil des années, j’ai eu le privilège de collaborer avec plusieurs grandes plateformes d’échanges de crypto en tant que KOL, partenaire affilié et membre VIP. Ces expériences m’ont permis de rencontrer et de soutenir des milliers de traders tout en contribuant à la croissance de l’écosystème Web3 grâce à l’éducation.
Je ne crois pas au fait de suivre aveuglément des signaux. Je pense que les meilleurs traders comprennent pourquoi le marché bouge. Mon objectif est d’aider les traders à comprendre la structure du marché, à penser par eux-mêmes, à gérer efficacement le risque et à construire une constance sur le long terme.
Ici sur Binance Square, je partagerai des analyses de la théorie des vagues d’Elliott et des enseignements éducatifs sur la crypto, le forex, les actions, les matières premières et les indices. Que vous soyez débutant en trading ou trader déjà expérimenté, j’espère que mon contenu vous aidera à devenir plus confiant et plus constant sur les marchés.
Si vous aimez les analyses objectives du marché et les contenus de trading éducatifs, j’adorerais que vous vous joigniez à moi dans cette aventure. N’hésitez pas à me suivre, et continuons à apprendre et à grandir ensemble.
On se retrouve dans la prochaine vague. 🌊📈
Quel marché souhaitez-vous que j’analyse en premier ? 👇
#BinanceSquare #ElliottWaveTheory #TechnicalAnalysis #TradingEducation #RiskManagement

janbronx86:
Wala ka bang update sa Elliott particularly pepe? salamat
54
4
144
63.1k
·
--
Haussier
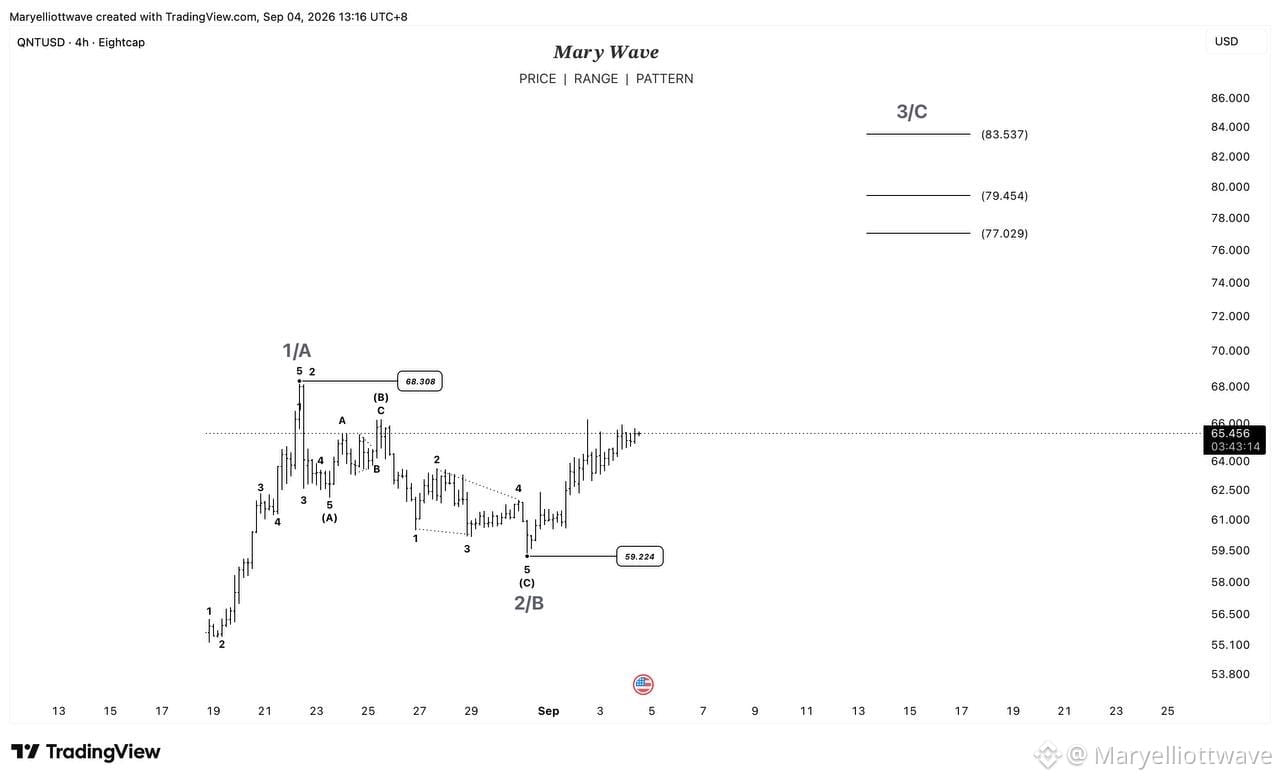
$QNT | 4H OUTLOOK
Observer le déroulement de la structure actuelle 1/A → 2/B → 3/C.
La correction 2/B semble terminée autour de 59.224, le prix récupérant désormais vers le niveau de confirmation 68.308.
Si cela est confirmé, les prochaines zones que je surveillerai sont :
77.029 • 79.454 • 83.537
Pour l’instant, je laisse le prix confirmer la structure en premier. Pas besoin de forcer le décompte. Patience, discipline et gestion du risque avant tout. 🤍
Avertissement : Ceci est mon analyse personnelle des Ondes d’Elliott, partagée uniquement à des fins éducatives. Ce n’est pas un conseil financier. Faites toujours vos propres recherches et gérez votre risque.
#QNT/USDT #ElliottWaveTheory
$QNT | 4H OUTLOOK
Observer le déroulement de la structure actuelle 1/A → 2/B → 3/C.
La correction 2/B semble terminée autour de 59.224, le prix récupérant désormais vers le niveau de confirmation 68.308.
Si cela est confirmé, les prochaines zones que je surveillerai sont :
77.029 • 79.454 • 83.537
Pour l’instant, je laisse le prix confirmer la structure en premier. Pas besoin de forcer le décompte. Patience, discipline et gestion du risque avant tout. 🤍
Avertissement : Ceci est mon analyse personnelle des Ondes d’Elliott, partagée uniquement à des fins éducatives. Ce n’est pas un conseil financier. Faites toujours vos propres recherches et gérez votre risque.
#QNT/USDT #ElliottWaveTheory
Observer le déroulement de la structure actuelle 1/A → 2/B → 3/C.
La correction 2/B semble terminée autour de 59.224, le prix récupérant désormais vers le niveau de confirmation 68.308.
Si cela est confirmé, les prochaines zones que je surveillerai sont :
77.029 • 79.454 • 83.537
Pour l’instant, je laisse le prix confirmer la structure en premier. Pas besoin de forcer le décompte. Patience, discipline et gestion du risque avant tout. 🤍
Avertissement : Ceci est mon analyse personnelle des Ondes d’Elliott, partagée uniquement à des fins éducatives. Ce n’est pas un conseil financier. Faites toujours vos propres recherches et gérez votre risque.
#QNT/USDT #ElliottWaveTheory
452
·
--
Haussier
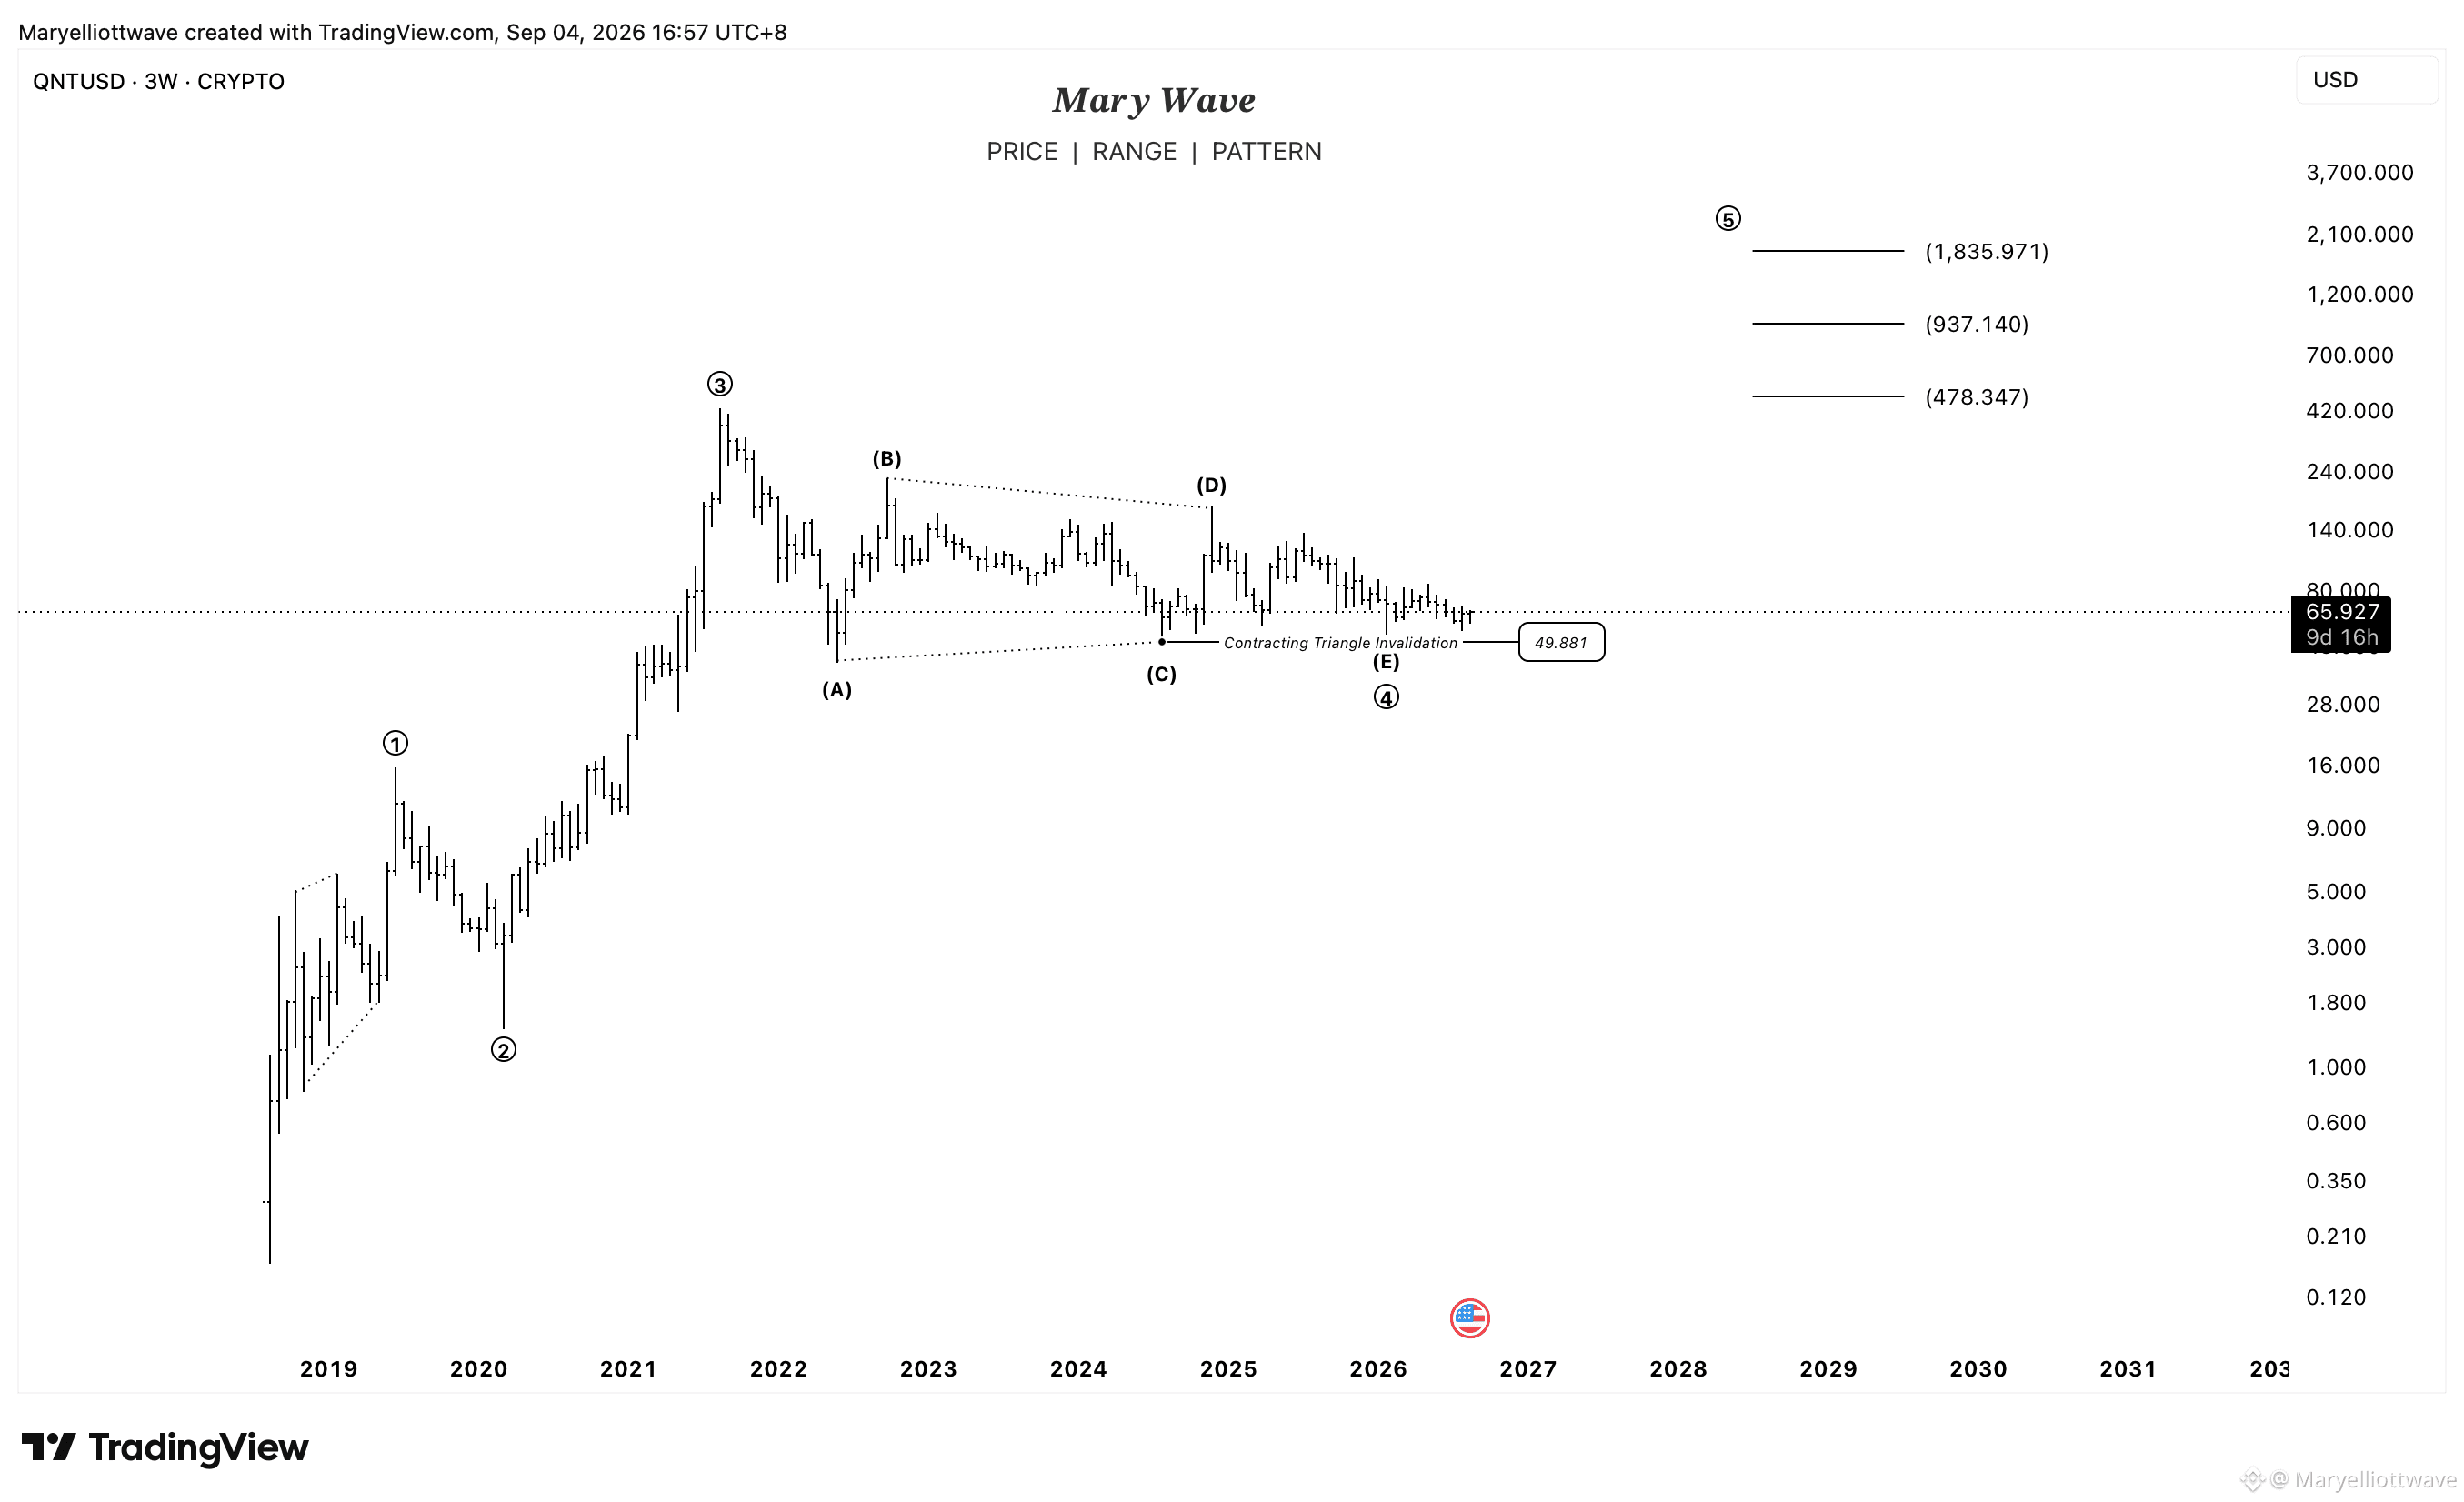
$QNT | 3W MACRO OUTLOOK
En revenant sur le graphique 3W et en observant l’historique complet des prix disponible, il s’agit de la structure plus large des vagues d’Elliott que je suis actuellement pour QNT.
Mon décompte macro actuel indique que les vagues ①, ② et ③ sont déjà terminées, la vague ① se développant en diagonale.
Pour la vague ④, je surveille un triangle A-B-C-D-E potentiellement contractant. Tant que l’invalidation du triangle contractant à 49.881 reste intacte, la structure demeure valide.
Si le triangle se complète et que le prix confirme une hausse, les prochaines zones que je vais surveiller pour la Macro Wave ⑤ sont :
478.347 • 937.140 • 1,835.971
Pour l’instant, je laisse la structure se confirmer. Inutile de forcer le décompte. Patience, discipline et gestion du risque avant tout. 🤍
Avertissement : ceci est mon analyse personnelle des vagues d’Elliott, partagée uniquement à des fins éducatives. Ce n’est pas un conseil financier. Faites toujours vos propres recherches et gérez votre risque.
#QNTUSDT #ElliottWaveTheory
$QNT | 3W MACRO OUTLOOK
En revenant sur le graphique 3W et en observant l’historique complet des prix disponible, il s’agit de la structure plus large des vagues d’Elliott que je suis actuellement pour QNT.
Mon décompte macro actuel indique que les vagues ①, ② et ③ sont déjà terminées, la vague ① se développant en diagonale.
Pour la vague ④, je surveille un triangle A-B-C-D-E potentiellement contractant. Tant que l’invalidation du triangle contractant à 49.881 reste intacte, la structure demeure valide.
Si le triangle se complète et que le prix confirme une hausse, les prochaines zones que je vais surveiller pour la Macro Wave ⑤ sont :
478.347 • 937.140 • 1,835.971
Pour l’instant, je laisse la structure se confirmer. Inutile de forcer le décompte. Patience, discipline et gestion du risque avant tout. 🤍
Avertissement : ceci est mon analyse personnelle des vagues d’Elliott, partagée uniquement à des fins éducatives. Ce n’est pas un conseil financier. Faites toujours vos propres recherches et gérez votre risque.
#QNTUSDT #ElliottWaveTheory
En revenant sur le graphique 3W et en observant l’historique complet des prix disponible, il s’agit de la structure plus large des vagues d’Elliott que je suis actuellement pour QNT.
Mon décompte macro actuel indique que les vagues ①, ② et ③ sont déjà terminées, la vague ① se développant en diagonale.
Pour la vague ④, je surveille un triangle A-B-C-D-E potentiellement contractant. Tant que l’invalidation du triangle contractant à 49.881 reste intacte, la structure demeure valide.
Si le triangle se complète et que le prix confirme une hausse, les prochaines zones que je vais surveiller pour la Macro Wave ⑤ sont :
478.347 • 937.140 • 1,835.971
Pour l’instant, je laisse la structure se confirmer. Inutile de forcer le décompte. Patience, discipline et gestion du risque avant tout. 🤍
Avertissement : ceci est mon analyse personnelle des vagues d’Elliott, partagée uniquement à des fins éducatives. Ce n’est pas un conseil financier. Faites toujours vos propres recherches et gérez votre risque.
#QNTUSDT #ElliottWaveTheory
604
·
--
Haussier
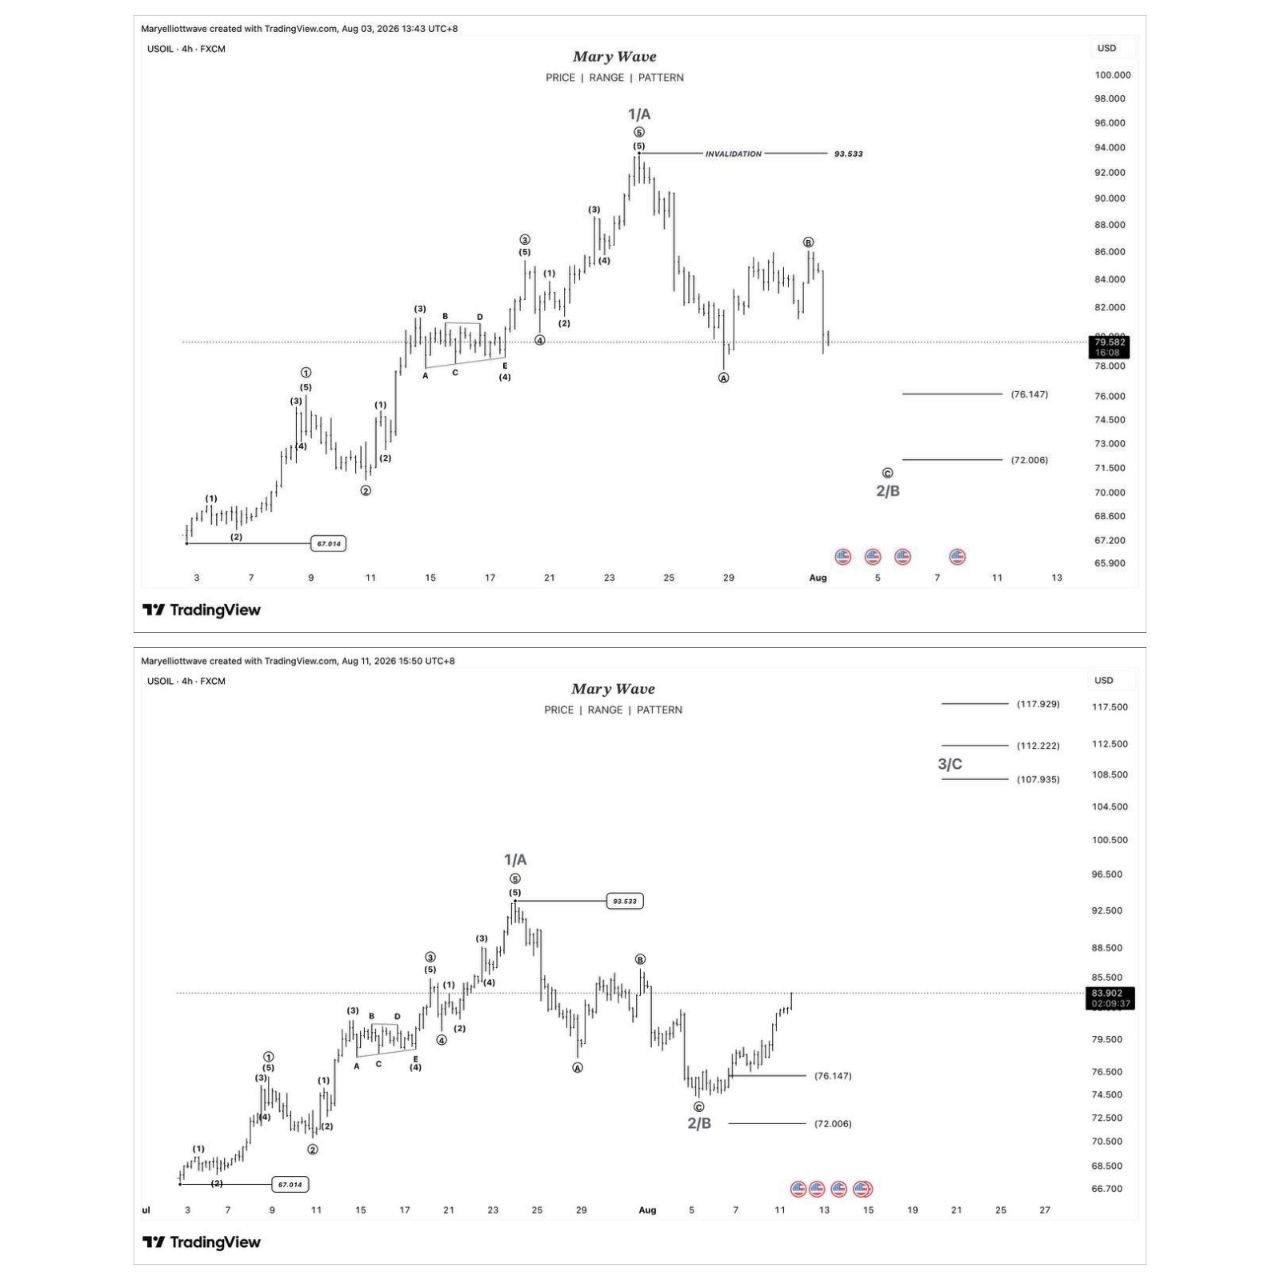
$USOIL | AVANT & APRÈS 📊
Le premier graphique a été créé le 3 août 2026.
Je m’attendais à ce que USOIL continue à baisser et achève la vague 2/B autour de la zone des $76.147–$72.006. Le prix a finalement touché la zone et a réagi fortement à partir de là.
Nous nous traitons maintenant au-dessus de $83, et j’observe comment la structure évolue à partir d’ici. Si ce décompte continue de se dérouler, la vague 3/C est le prochain mouvement que je recherche, avec $107.935–$117.929 comme zone haussière.
Une étape à la fois. Nous suivons la structure et laissons le marché faire le reste. 📈
#USOILUSD #ElliottWaveTheory #TechnicalAnalysis
$USOIL | AVANT & APRÈS 📊
Le premier graphique a été créé le 3 août 2026.
Je m’attendais à ce que USOIL continue à baisser et achève la vague 2/B autour de la zone des $76.147–$72.006. Le prix a finalement touché la zone et a réagi fortement à partir de là.
Nous nous traitons maintenant au-dessus de $83, et j’observe comment la structure évolue à partir d’ici. Si ce décompte continue de se dérouler, la vague 3/C est le prochain mouvement que je recherche, avec $107.935–$117.929 comme zone haussière.
Une étape à la fois. Nous suivons la structure et laissons le marché faire le reste. 📈
#USOILUSD #ElliottWaveTheory #TechnicalAnalysis
Le premier graphique a été créé le 3 août 2026.
Je m’attendais à ce que USOIL continue à baisser et achève la vague 2/B autour de la zone des $76.147–$72.006. Le prix a finalement touché la zone et a réagi fortement à partir de là.
Nous nous traitons maintenant au-dessus de $83, et j’observe comment la structure évolue à partir d’ici. Si ce décompte continue de se dérouler, la vague 3/C est le prochain mouvement que je recherche, avec $107.935–$117.929 comme zone haussière.
Une étape à la fois. Nous suivons la structure et laissons le marché faire le reste. 📈
#USOILUSD #ElliottWaveTheory #TechnicalAnalysis
1
2
1.1k
·
--
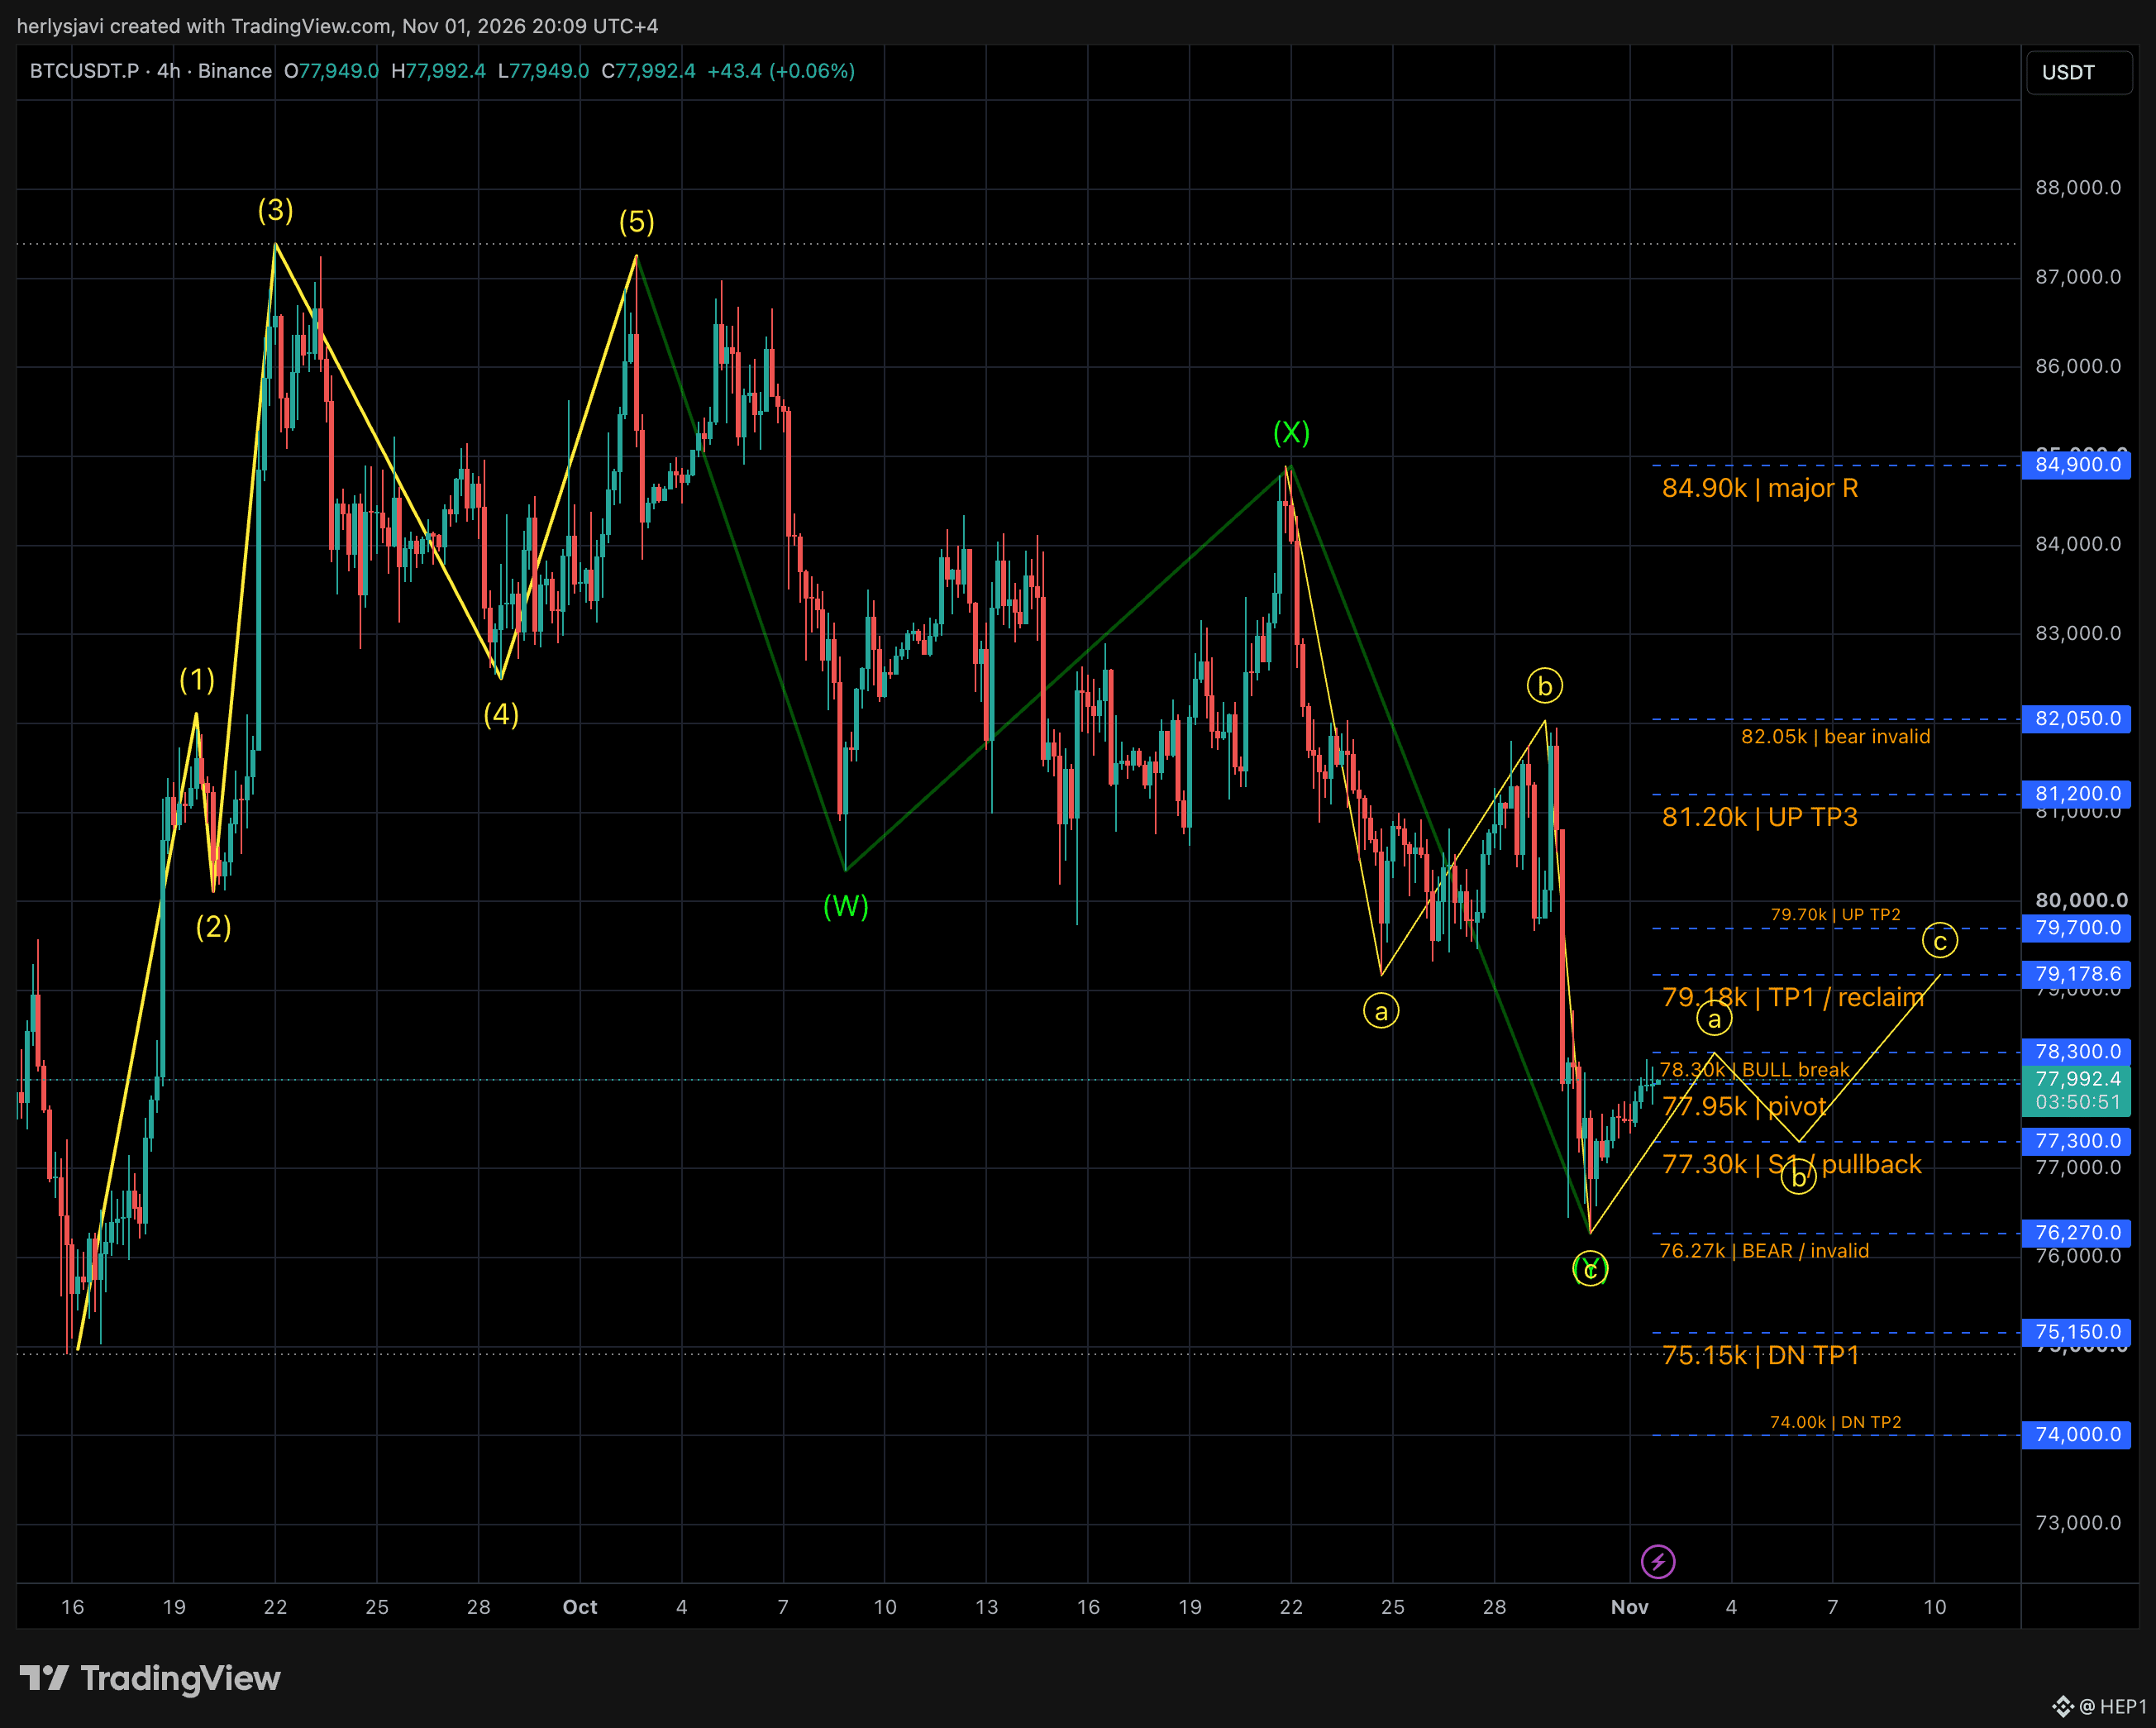
Mise à jour.
Haussier : au-dessus de 78 300, objectifs à 79 178,6 / 79 700 / 81 200.
Baissier : sous 76 270, objectifs à 75 150 / 74 000. L’ancien plus bas à 76 444 n’a pas tenu.
Le creux révisé en C/Y et le rebond ABC projeté restent hypothétiques.
Les cassures nécessitent une clôture en 4H et un retest.
Partagez vos réflexions
#elliottwaves #ElliottWaveTheory #elliot #elliotwave
Mise à jour.
Haussier : au-dessus de 78 300, objectifs à 79 178,6 / 79 700 / 81 200.
Baissier : sous 76 270, objectifs à 75 150 / 74 000. L’ancien plus bas à 76 444 n’a pas tenu.
Le creux révisé en C/Y et le rebond ABC projeté restent hypothétiques.
Les cassures nécessitent une clôture en 4H et un retest.
Partagez vos réflexions
#elliottwaves #ElliottWaveTheory #elliot #elliotwave
Haussier : au-dessus de 78 300, objectifs à 79 178,6 / 79 700 / 81 200.
Baissier : sous 76 270, objectifs à 75 150 / 74 000. L’ancien plus bas à 76 444 n’a pas tenu.
Le creux révisé en C/Y et le rebond ABC projeté restent hypothétiques.
Les cassures nécessitent une clôture en 4H et un retest.
Partagez vos réflexions
#elliottwaves #ElliottWaveTheory #elliot #elliotwave
HEP1
·
--
#BTC #TradingCommunity #elliottwaves Le prix est passé sous les deux niveaux de confirmation baissiers et a traversé les deux premières zones cibles à la baisse. La bougie 4H visible a atteint 76,444 avant de rebondir vers 78,070. Un creux C/Y potentiel mérite donc d’être signalé, mais la fin de la correction doit encore être confirmée. Le graphique est à jour.
Reprise haussière : 79,178.6 → objectifs : 79,700 / 81,200 / 82,050.
Poursuite baissière : sous 76,444 → 75,150 / 74,000. 76,444 est un creux C/Y potentiel ; la fin de la correction reste à confirmer. Qu’en pensez-vous ?
Reprise haussière : 79,178.6 → objectifs : 79,700 / 81,200 / 82,050.
Poursuite baissière : sous 76,444 → 75,150 / 74,000. 76,444 est un creux C/Y potentiel ; la fin de la correction reste à confirmer. Qu’en pensez-vous ?
1
1
60
·
--
Article
Voir la traduction
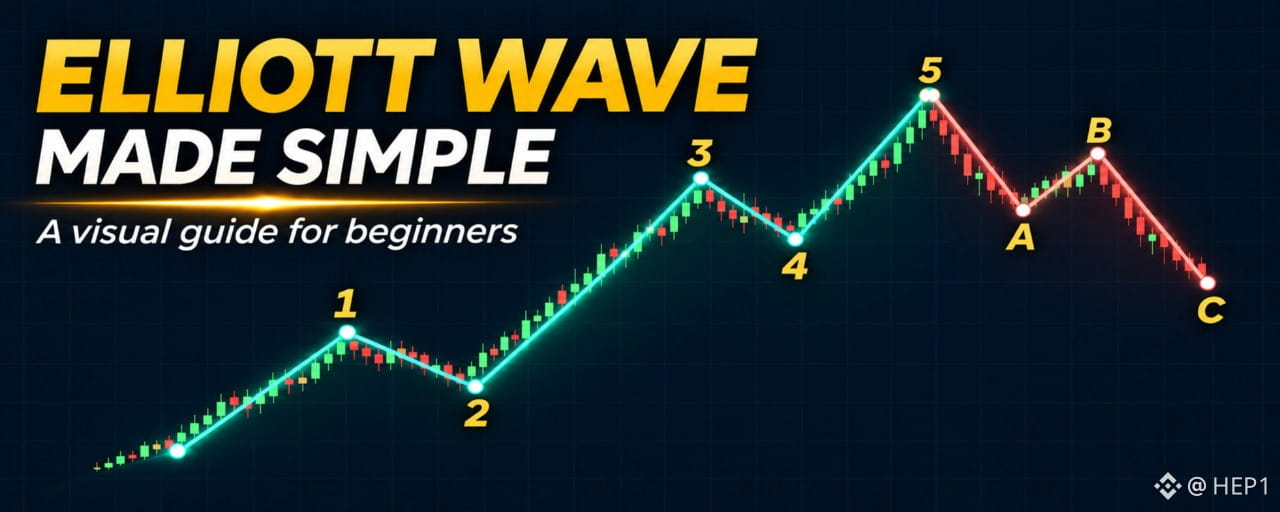
Elliott Wave Analysis: A Beginner’s Guide🌊 Elliott Wave Made Simple: Read the Structure, Understand the Crowd
Why do markets rally, pull back, and rally again? Elliott Wave Analysis interprets these swings through recurring price patterns and crowd psychology.
Ralph Nelson Elliott developed the idea in the 1930s, studying stock markets. Traders now apply it to crypto too. Check The Binance Academy "Introduction to Elliott Wave Theory"
1️⃣ Learn the basic structure
Think of a bullish sequence as five waves advancing, followed by a correction.
🟢 1, 3, 5: move forward.
↩️ 2, 4: pull back.
🔴 A, B, C: illustrate a simple zigzag correction.
Larger waves contain smaller waves. In a standard impulse, the internal structure is 5–3–5–3–5, with “3” representing corrective structure. Corrections can also form flats, triangles, and combinations.
2️⃣ Understand the crowd 🧠
The labels describe price structure; the personalities help explain the story behind it.
These are tendencies, not a fixed script. Excitement alone cannot identify wave 5, and fear alone cannot identify wave C.
3️⃣ Three rules to remember 📋
A convincing story still needs a valid structure. Each red example below shows a broken rule.
Standard impulse ruleIn a bullish exampleWave 2 cannot fully retrace wave 1.It stays above wave 1’s starting low.Wave 3 cannot be shortest among 1, 3, and 5.Compare price distances, not duration.Wave 4 cannot overlap wave 1’s territory.It stays above wave 1’s high.
If a rule breaks, reconsider the count. Diagonals are a separate structure with different overlap rules. Consult StockCharts "Identifying Elliott Wave Patterns".
4️⃣ Where does Fibonacci fit? 📐
Fibonacci helps mark possible reaction zones.
If wave 1 rises from $100 to $120, a 61.8% retracement is:
$120 − ($20 × 0.618) = $107.64
That is a zone to investigate—not an automatic buy.
Retracements measure pullbacks; extensions project possible future distances. Common Fibonacci ratios include 38.2%, 61.8%, and 161.8%. The popular 50% level is not itself a Fibonacci ratio.
5️⃣ Example: a possible wave 2 ending 🔍
Look for several clues to agree.
✅ The count respects the rules.
✅ Price reacts near support and a Fibonacci zone.
✅ RSI or MACD shows improving momentum.
✅ A hammer or bullish engulfing candle is followed by price strength.
In this hypothetical example, a move below $100 invalidates the proposed bullish wave 2 count. Agreement supports a scenario; it cannot guarantee wave 3.
6️⃣ Example: a possible wave 5 warning ⚠️
A new price high can hide weakening momentum.
Higher price high + lower RSI high = bearish divergence.
A shooting star or bearish engulfing pattern near resistance may add evidence. Watch for bearish follow-through and a break of nearby support. Divergence can persist, and wave 5 can extend. Consult the Binance Academy "How to Read the Most Popular Candlestick Patterns"
📝 Your beginner checklist
Structure → Rules → Fibonacci zone → Momentum → Candle confirmation → Risk plan
Start on a higher timeframe, keep an alternative count, and mark what would invalidate your idea.
Use waves to organize scenarios. Let price test them.
Educational only. Wave counts are subjective, and no pattern guarantees the next move.
#ElliottWave #CryptoEducation #TechnicalAnalysis #TradingPsychology #ElliottWaveTheory
Elliott Wave Analysis: A Beginner’s Guide
🌊 Elliott Wave Made Simple: Read the Structure, Understand the Crowd
Why do markets rally, pull back, and rally again? Elliott Wave Analysis interprets these swings through recurring price patterns and crowd psychology.
Ralph Nelson Elliott developed the idea in the 1930s, studying stock markets. Traders now apply it to crypto too. Check The Binance Academy "Introduction to Elliott Wave Theory"
1️⃣ Learn the basic structure
Think of a bullish sequence as five waves advancing, followed by a correction.
🟢 1, 3, 5: move forward.
↩️ 2, 4: pull back.
🔴 A, B, C: illustrate a simple zigzag correction.
Larger waves contain smaller waves. In a standard impulse, the internal structure is 5–3–5–3–5, with “3” representing corrective structure. Corrections can also form flats, triangles, and combinations.
2️⃣ Understand the crowd 🧠
The labels describe price structure; the personalities help explain the story behind it.
These are tendencies, not a fixed script. Excitement alone cannot identify wave 5, and fear alone cannot identify wave C.
3️⃣ Three rules to remember 📋
A convincing story still needs a valid structure. Each red example below shows a broken rule.
Standard impulse ruleIn a bullish exampleWave 2 cannot fully retrace wave 1.It stays above wave 1’s starting low.Wave 3 cannot be shortest among 1, 3, and 5.Compare price distances, not duration.Wave 4 cannot overlap wave 1’s territory.It stays above wave 1’s high.
If a rule breaks, reconsider the count. Diagonals are a separate structure with different overlap rules. Consult StockCharts "Identifying Elliott Wave Patterns".
4️⃣ Where does Fibonacci fit? 📐
Fibonacci helps mark possible reaction zones.
If wave 1 rises from $100 to $120, a 61.8% retracement is:
$120 − ($20 × 0.618) = $107.64
That is a zone to investigate—not an automatic buy.
Retracements measure pullbacks; extensions project possible future distances. Common Fibonacci ratios include 38.2%, 61.8%, and 161.8%. The popular 50% level is not itself a Fibonacci ratio.
5️⃣ Example: a possible wave 2 ending 🔍
Look for several clues to agree.
✅ The count respects the rules.
✅ Price reacts near support and a Fibonacci zone.
✅ RSI or MACD shows improving momentum.
✅ A hammer or bullish engulfing candle is followed by price strength.
In this hypothetical example, a move below $100 invalidates the proposed bullish wave 2 count. Agreement supports a scenario; it cannot guarantee wave 3.
6️⃣ Example: a possible wave 5 warning ⚠️
A new price high can hide weakening momentum.
Higher price high + lower RSI high = bearish divergence.
A shooting star or bearish engulfing pattern near resistance may add evidence. Watch for bearish follow-through and a break of nearby support. Divergence can persist, and wave 5 can extend. Consult the Binance Academy "How to Read the Most Popular Candlestick Patterns"
📝 Your beginner checklist
Structure → Rules → Fibonacci zone → Momentum → Candle confirmation → Risk plan
Start on a higher timeframe, keep an alternative count, and mark what would invalidate your idea.
Use waves to organize scenarios. Let price test them.
Educational only. Wave counts are subjective, and no pattern guarantees the next move.
#ElliottWave #CryptoEducation #TechnicalAnalysis #TradingPsychology #ElliottWaveTheory
Why do markets rally, pull back, and rally again? Elliott Wave Analysis interprets these swings through recurring price patterns and crowd psychology.
Ralph Nelson Elliott developed the idea in the 1930s, studying stock markets. Traders now apply it to crypto too. Check The Binance Academy "Introduction to Elliott Wave Theory"
1️⃣ Learn the basic structure
Think of a bullish sequence as five waves advancing, followed by a correction.
🟢 1, 3, 5: move forward.
↩️ 2, 4: pull back.
🔴 A, B, C: illustrate a simple zigzag correction.
Larger waves contain smaller waves. In a standard impulse, the internal structure is 5–3–5–3–5, with “3” representing corrective structure. Corrections can also form flats, triangles, and combinations.
2️⃣ Understand the crowd 🧠
The labels describe price structure; the personalities help explain the story behind it.
These are tendencies, not a fixed script. Excitement alone cannot identify wave 5, and fear alone cannot identify wave C.
3️⃣ Three rules to remember 📋
A convincing story still needs a valid structure. Each red example below shows a broken rule.
Standard impulse ruleIn a bullish exampleWave 2 cannot fully retrace wave 1.It stays above wave 1’s starting low.Wave 3 cannot be shortest among 1, 3, and 5.Compare price distances, not duration.Wave 4 cannot overlap wave 1’s territory.It stays above wave 1’s high.
If a rule breaks, reconsider the count. Diagonals are a separate structure with different overlap rules. Consult StockCharts "Identifying Elliott Wave Patterns".
4️⃣ Where does Fibonacci fit? 📐
Fibonacci helps mark possible reaction zones.
If wave 1 rises from $100 to $120, a 61.8% retracement is:
$120 − ($20 × 0.618) = $107.64
That is a zone to investigate—not an automatic buy.
Retracements measure pullbacks; extensions project possible future distances. Common Fibonacci ratios include 38.2%, 61.8%, and 161.8%. The popular 50% level is not itself a Fibonacci ratio.
5️⃣ Example: a possible wave 2 ending 🔍
Look for several clues to agree.
✅ The count respects the rules.
✅ Price reacts near support and a Fibonacci zone.
✅ RSI or MACD shows improving momentum.
✅ A hammer or bullish engulfing candle is followed by price strength.
In this hypothetical example, a move below $100 invalidates the proposed bullish wave 2 count. Agreement supports a scenario; it cannot guarantee wave 3.
6️⃣ Example: a possible wave 5 warning ⚠️
A new price high can hide weakening momentum.
Higher price high + lower RSI high = bearish divergence.
A shooting star or bearish engulfing pattern near resistance may add evidence. Watch for bearish follow-through and a break of nearby support. Divergence can persist, and wave 5 can extend. Consult the Binance Academy "How to Read the Most Popular Candlestick Patterns"
📝 Your beginner checklist
Structure → Rules → Fibonacci zone → Momentum → Candle confirmation → Risk plan
Start on a higher timeframe, keep an alternative count, and mark what would invalidate your idea.
Use waves to organize scenarios. Let price test them.
Educational only. Wave counts are subjective, and no pattern guarantees the next move.
#ElliottWave #CryptoEducation #TechnicalAnalysis #TradingPsychology #ElliottWaveTheory
1
66
·
--
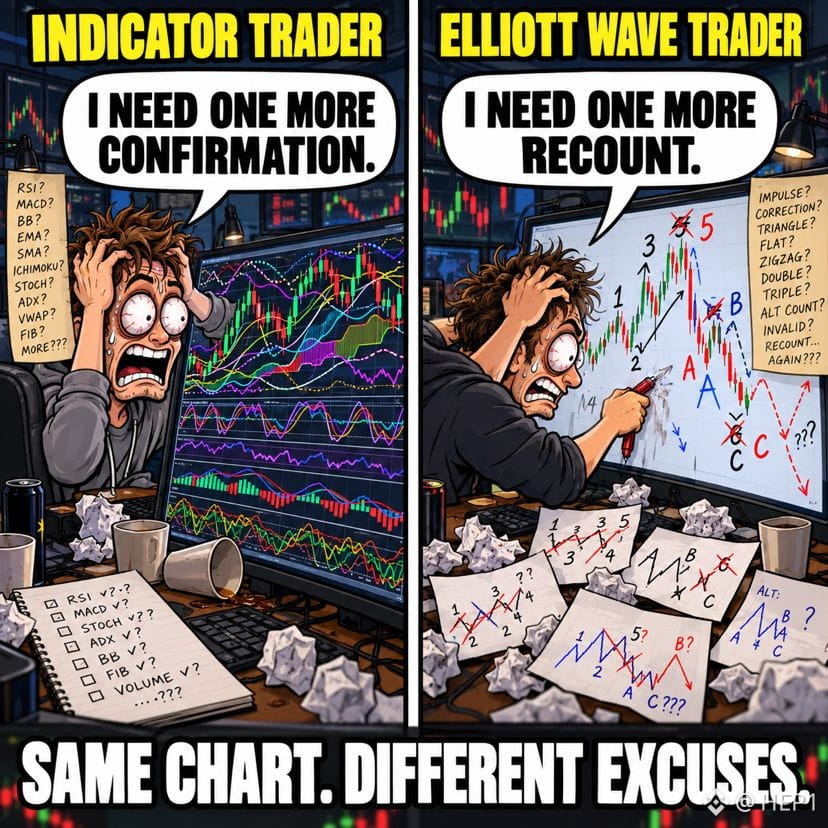
Indicateurs : en attente de confirmation. Vagues d’Elliott : recomptage depuis lundi. 😂🤣😂📊🌊 #TradingMemes #TechnicalAnalysis #ElliottWaveTheory #BinanceSquare #elliottwaves
Indicateurs : en attente de confirmation. Vagues d’Elliott : recomptage depuis lundi. 😂🤣😂📊🌊 #TradingMemes #TechnicalAnalysis #ElliottWaveTheory #BinanceSquare #elliottwaves
2
92

·
--
Baissier
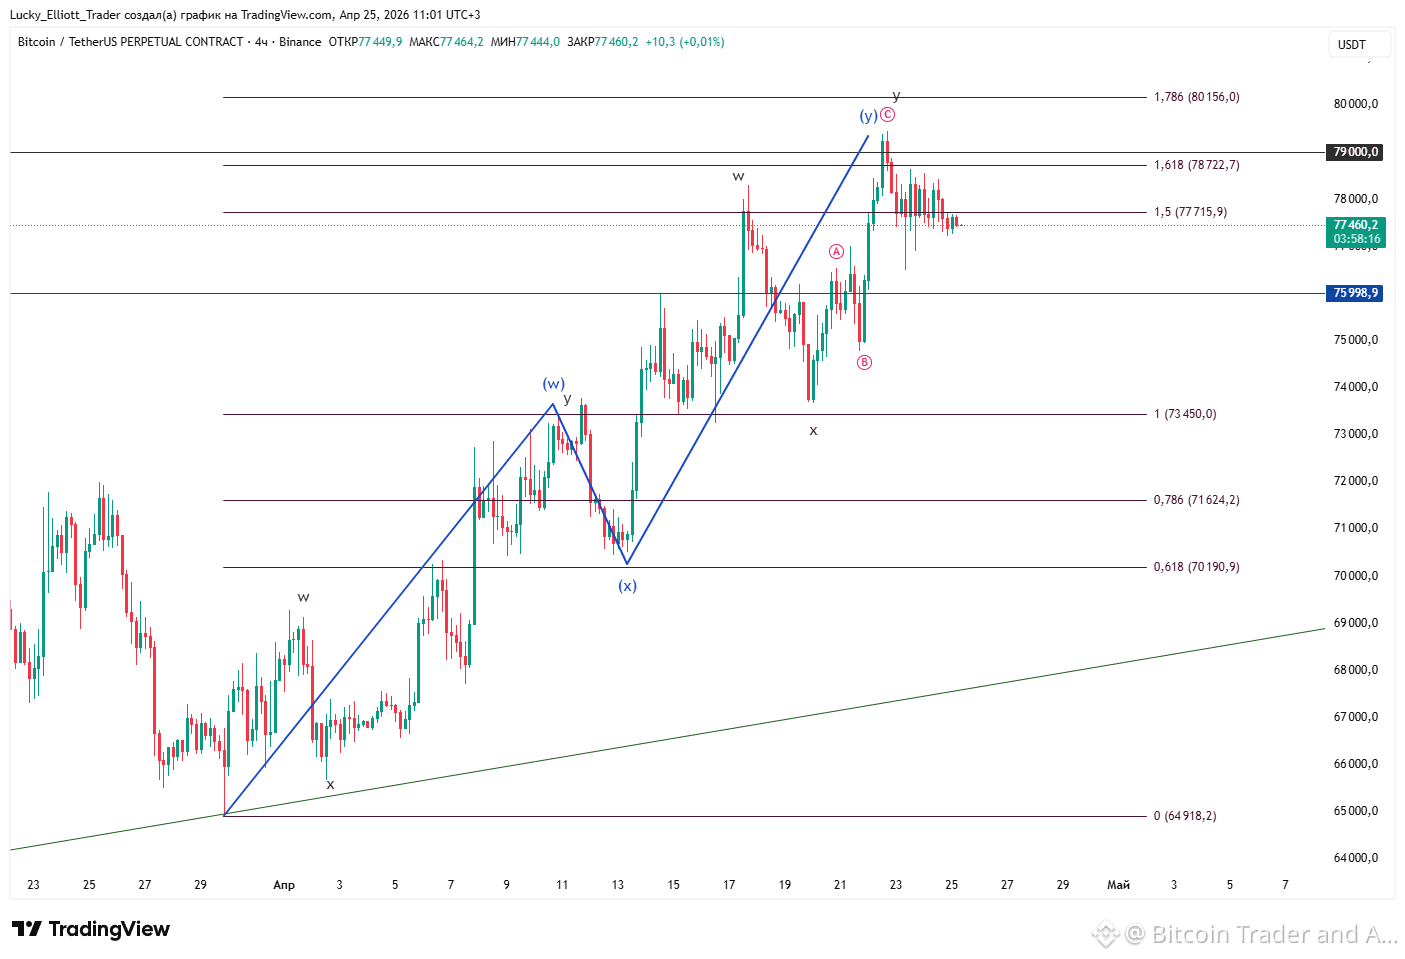
👀 Quelle est la structure de croissance selon l'analyse des vagues pour $BTC ?
En tenant compte de la divergence [(👉link)](https://app.binance.com/uni-qr/cpos/315735782899601), toute la montée du bitcoin peut être divisée en deux zigzags égaux (W)-(X)-(Y), qui contiennent également des zigzags à l'intérieur.
C'est un autre argument que la montée $BTC est terminée et qu'une vague de chute commence ! 📉
#ElliottWaveTheory
{future}(BTCUSDT)
👀 Quelle est la structure de croissance selon l'analyse des vagues pour $BTC ?
En tenant compte de la divergence (👉link), toute la montée du bitcoin peut être divisée en deux zigzags égaux (W)-(X)-(Y), qui contiennent également des zigzags à l'intérieur.
C'est un autre argument que la montée $BTC est terminée et qu'une vague de chute commence ! 📉
#ElliottWaveTheory
En tenant compte de la divergence (👉link), toute la montée du bitcoin peut être divisée en deux zigzags égaux (W)-(X)-(Y), qui contiennent également des zigzags à l'intérieur.
C'est un autre argument que la montée $BTC est terminée et qu'une vague de chute commence ! 📉
#ElliottWaveTheory
6
1.1k

·
--
Baissier
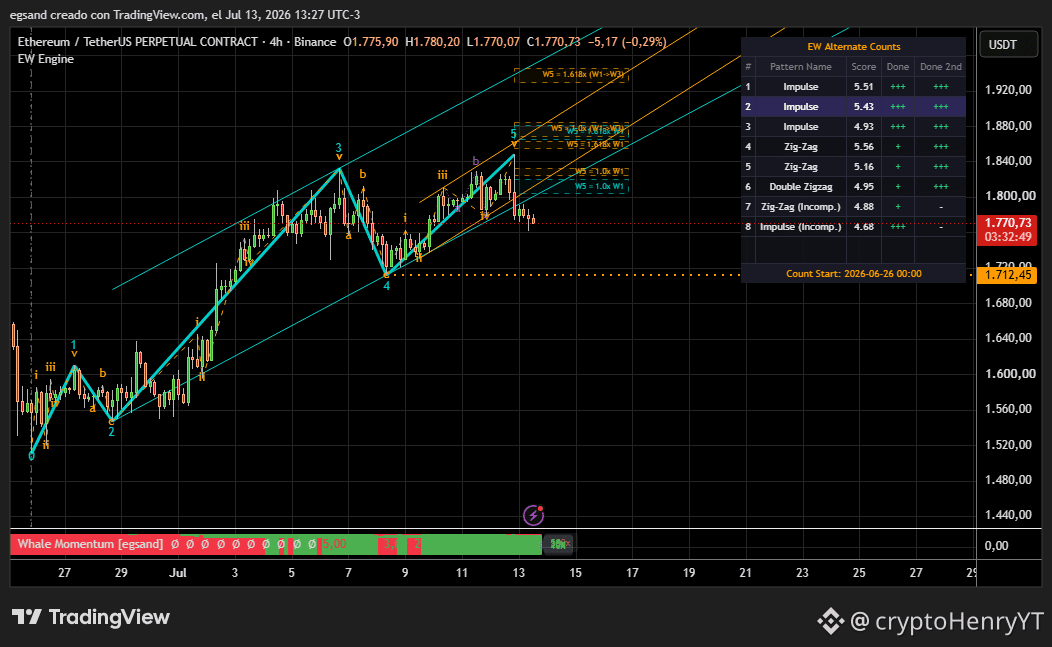
#elliottwaves #ElliottWaveTheory Actualisation du comptage d’Ethereum 4H $ETH , un zig-zag ? une consolidation ? qu’est-ce que ce sera ?
#elliottwaves #ElliottWaveTheory Actualisation du comptage d’Ethereum 4H $ETH , un zig-zag ? une consolidation ? qu’est-ce que ce sera ?
56

·
--
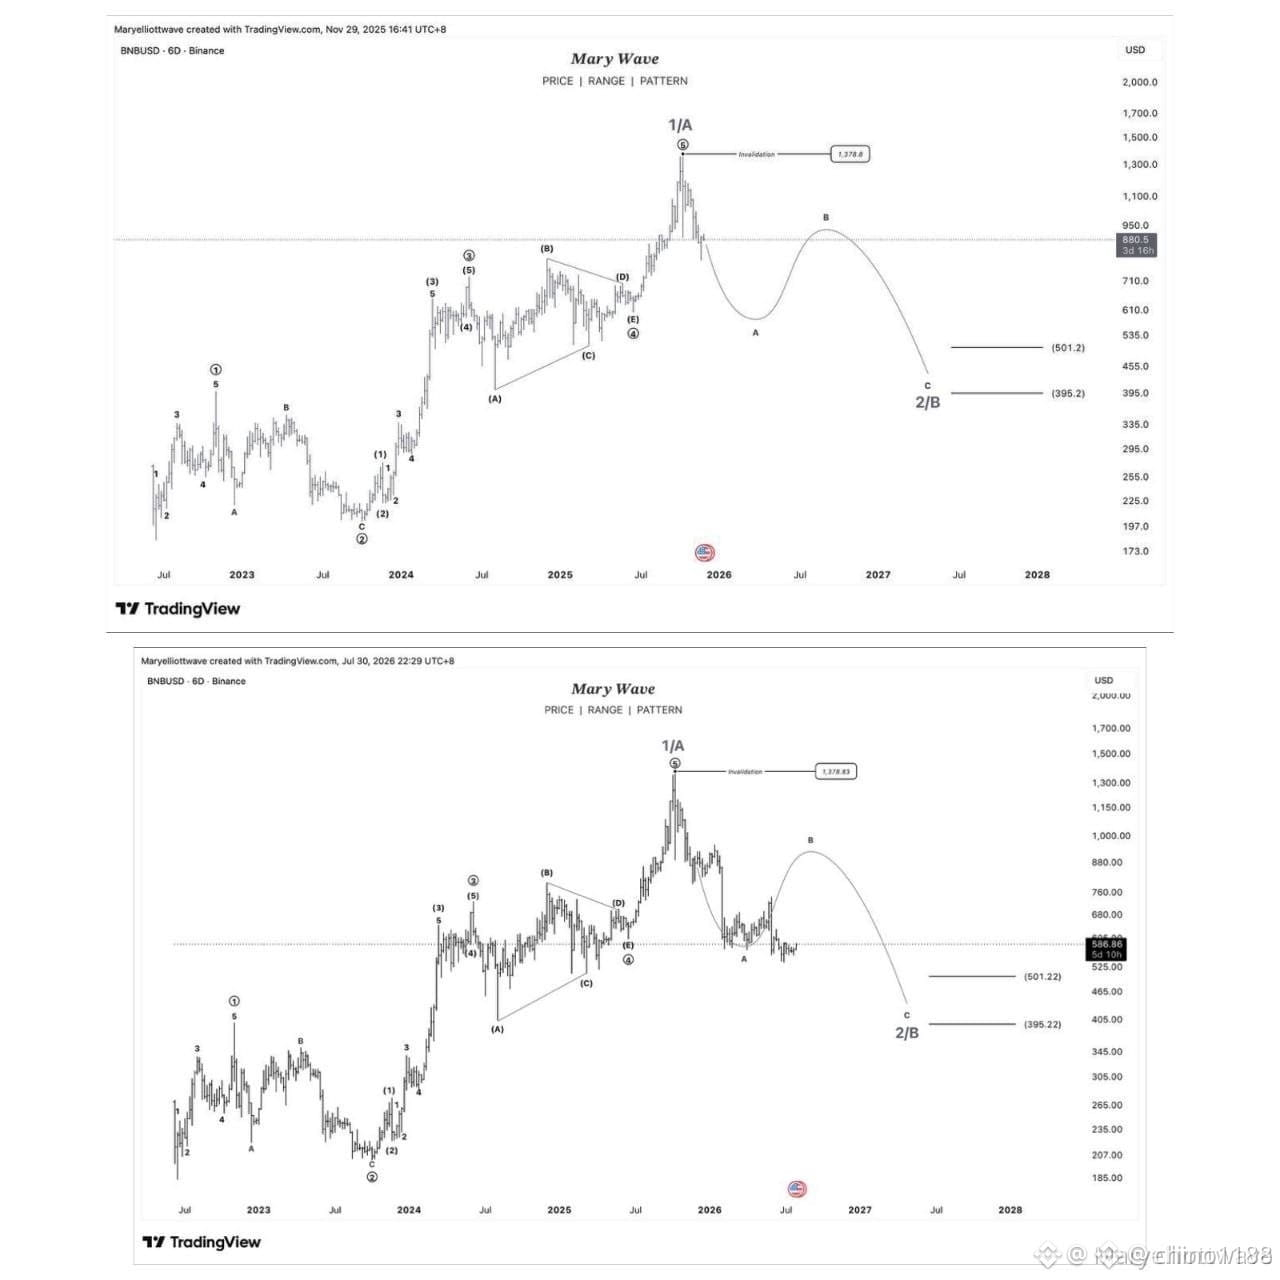
$BNB | 6D UPDATE 📈
En novembre 2025, j’ai partagé cette feuille de route Elliott Wave à plus grande échelle pour $BNB. Le deuxième graphique montre comment le marché a évolué au cours des mois suivants. J’ai volontairement ne pas renommer le décompte des vagues afin que vous puissiez comparer l’analyse originale avec la structure actuelle du marché.
L’Elliott Wave ne consiste pas à prédire chaque mouvement de prix avec certitude. Il s’agit d’identifier la structure de marché la plus probable, de définir des niveaux d’invalidation clairs et de ne s’adapter que lorsque l’évolution des prix fournit une raison valable de le faire.
La cohérence vient du respect de règles objectives de l’Elliott Wave, et non du fait de changer constamment le décompte des vagues. Laissez le prix confirmer la structure, respectez vos niveaux d’invalidation, gérez votre risque et laissez le marché se dérouler une vague à la fois.
#BNB #BNBUSD #ElliottWave #ElliottWaveTheory #TechnicalAnalysis #CryptoTrading
$BNB | 6D UPDATE 📈
En novembre 2025, j’ai partagé cette feuille de route Elliott Wave à plus grande échelle pour $BNB . Le deuxième graphique montre comment le marché a évolué au cours des mois suivants. J’ai volontairement ne pas renommer le décompte des vagues afin que vous puissiez comparer l’analyse originale avec la structure actuelle du marché.
L’Elliott Wave ne consiste pas à prédire chaque mouvement de prix avec certitude. Il s’agit d’identifier la structure de marché la plus probable, de définir des niveaux d’invalidation clairs et de ne s’adapter que lorsque l’évolution des prix fournit une raison valable de le faire.
La cohérence vient du respect de règles objectives de l’Elliott Wave, et non du fait de changer constamment le décompte des vagues. Laissez le prix confirmer la structure, respectez vos niveaux d’invalidation, gérez votre risque et laissez le marché se dérouler une vague à la fois.
#BNB #BNBUSD #ElliottWave #ElliottWaveTheory #TechnicalAnalysis #CryptoTrading
En novembre 2025, j’ai partagé cette feuille de route Elliott Wave à plus grande échelle pour $BNB . Le deuxième graphique montre comment le marché a évolué au cours des mois suivants. J’ai volontairement ne pas renommer le décompte des vagues afin que vous puissiez comparer l’analyse originale avec la structure actuelle du marché.
L’Elliott Wave ne consiste pas à prédire chaque mouvement de prix avec certitude. Il s’agit d’identifier la structure de marché la plus probable, de définir des niveaux d’invalidation clairs et de ne s’adapter que lorsque l’évolution des prix fournit une raison valable de le faire.
La cohérence vient du respect de règles objectives de l’Elliott Wave, et non du fait de changer constamment le décompte des vagues. Laissez le prix confirmer la structure, respectez vos niveaux d’invalidation, gérez votre risque et laissez le marché se dérouler une vague à la fois.
#BNB #BNBUSD #ElliottWave #ElliottWaveTheory #TechnicalAnalysis #CryptoTrading
25
Connectez-vous pour découvrir plus de contenu
Rejoignez la communauté mondiale des adeptes de cryptomonnaies sur Binance Square
⚡️ Suviez les dernières informations importantes sur les cryptomonnaies.
💬 Jugé digne de confiance par la plus grande plateforme d’échange de cryptomonnaies au monde.
👍 Découvrez les connaissances que partagent les créateurs vérifiés.
Adresse e-mail/Nº de téléphone
Sujets d’actualité
1
#BinanceReopensWithdrawalsForMoreAssets
666,074 vues
3,315 mentions
2
#BTCRebounds80K
166,595 vues
1,560 mentions
3
#Binance98PercentReplenished
85,358 vues
1,056 mentions
4
#StrategySTRCResumesIssuanceAfterOver170Days
171 vues
19 mentions
5
#ADPUSPrivateEmployersAdd86000JobsInOctober
12,150 vues
219 mentions
6
#SouthKoreaSeeksCryptoTaxDelayUntil2029
1,966 vues
38 mentions
7
#USMidterms-WhatAreMarketsExpecting?
484,268 vues
2,497 mentions
8
#US10YearTreasuryYieldFallsTo4.845%
2,894 vues
53 mentions
9
#ZcashExpectsNU7ToMake$16MSproutZECInaccessible
387 vues
9 mentions
10
#AsianChipStocksRetreat
3,196 vues
57 mentions