

#chartanalysis
chartanalysis
1M vues
3,160 mentions
Populaire
Récents

·
--
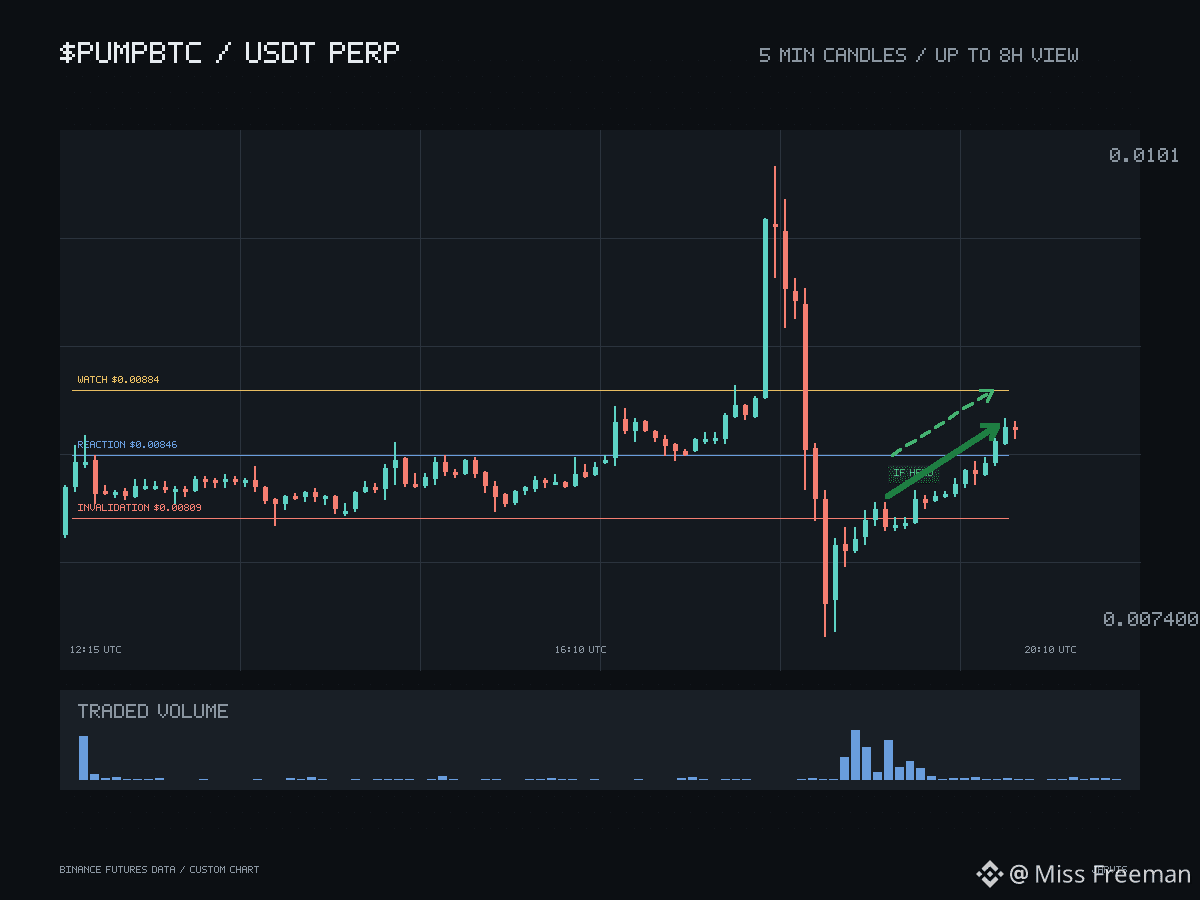
$PUMPBTC is in focus, and the size of that move answers only the easy question: price can travel. It says nothing about who defends it on the first pullback. The read lives or dies on three levels that do different jobs, and mixing them up is the fastest way to misread this chart.
Start from the bottom, where the real stake sits. 0.00809 is structural invalidation. Losing it does not merely fail one pullback — it cancels the higher-high, higher-low structure this constructive case rests on. A hold above it, by the same logic, is not proof of health.
Between here and there sits 0.00846, a local reaction point with a deliberately narrow remit. A first retest needs to become a defended response — sellers absorbed, price closed back above — rather than a wick through and drift. Price structure and volume are the strongest confirming evidence on this chart, and taker flow at the touch is worth watching, but none of it settles the question before the test arrives. Only after that defence shows does 0.00884 earn attention as the next watch, strictly in sequence.
The counterweights are open interest and the current funding snapshot; neither confirms strength the way price and volume do. Constructive, with positioning caution.
#Crypto #ChartAnalysis
$PUMPBTC is in focus, and the size of that move answers only the easy question: price can travel. It says nothing about who defends it on the first pullback. The read lives or dies on three levels that do different jobs, and mixing them up is the fastest way to misread this chart.
Start from the bottom, where the real stake sits. 0.00809 is structural invalidation. Losing it does not merely fail one pullback — it cancels the higher-high, higher-low structure this constructive case rests on. A hold above it, by the same logic, is not proof of health.
Between here and there sits 0.00846, a local reaction point with a deliberately narrow remit. A first retest needs to become a defended response — sellers absorbed, price closed back above — rather than a wick through and drift. Price structure and volume are the strongest confirming evidence on this chart, and taker flow at the touch is worth watching, but none of it settles the question before the test arrives. Only after that defence shows does 0.00884 earn attention as the next watch, strictly in sequence.
The counterweights are open interest and the current funding snapshot; neither confirms strength the way price and volume do. Constructive, with positioning caution.
#Crypto #ChartAnalysis
Start from the bottom, where the real stake sits. 0.00809 is structural invalidation. Losing it does not merely fail one pullback — it cancels the higher-high, higher-low structure this constructive case rests on. A hold above it, by the same logic, is not proof of health.
Between here and there sits 0.00846, a local reaction point with a deliberately narrow remit. A first retest needs to become a defended response — sellers absorbed, price closed back above — rather than a wick through and drift. Price structure and volume are the strongest confirming evidence on this chart, and taker flow at the touch is worth watching, but none of it settles the question before the test arrives. Only after that defence shows does 0.00884 earn attention as the next watch, strictly in sequence.
The counterweights are open interest and the current funding snapshot; neither confirms strength the way price and volume do. Constructive, with positioning caution.
#Crypto #ChartAnalysis
338
·
--
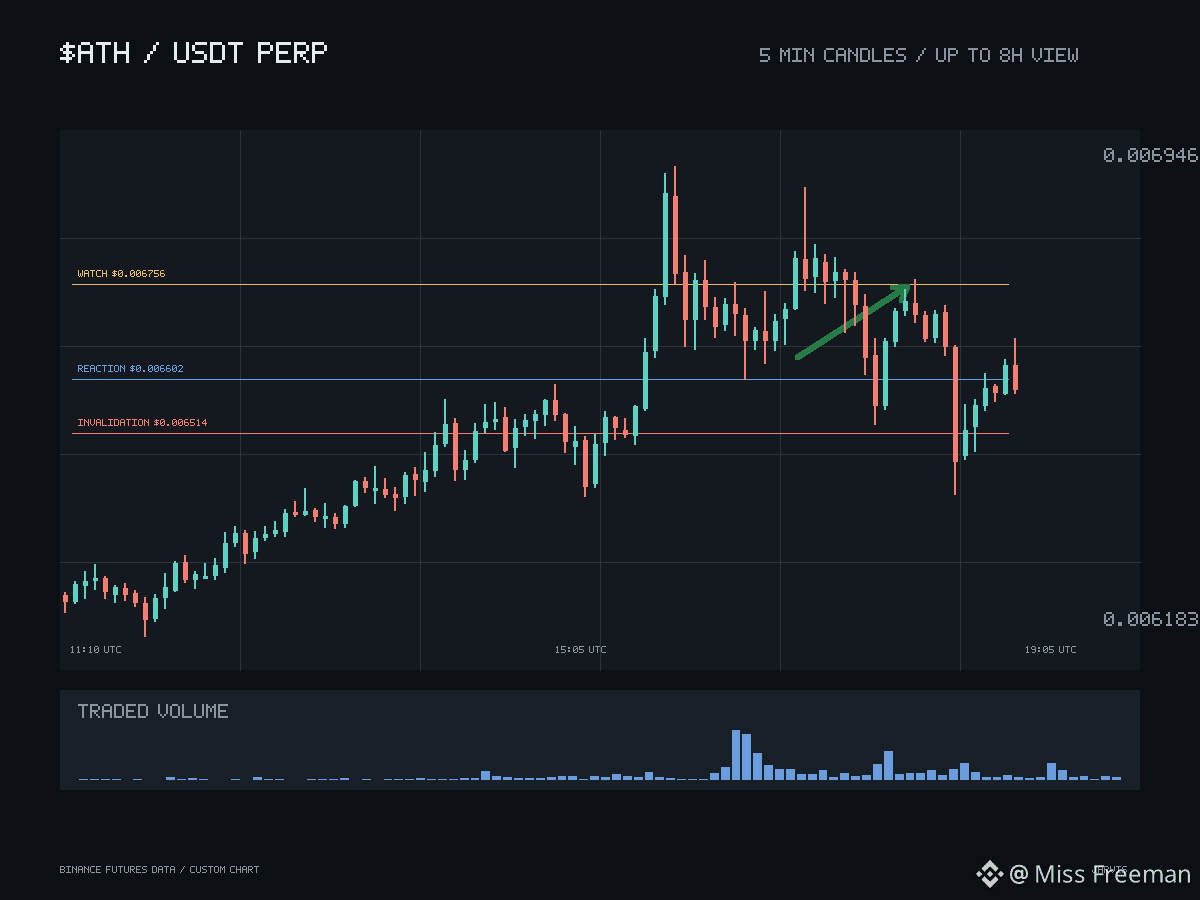
$ATH The levels matter more than the headline here. An upward move answers whether price can travel; it leaves open everything about who defends it afterwards.
Work from the bottom up, because that is where the real stakes sit. 0.006514 is structural invalidation. Losing it does not fail one pullback — it removes the higher-high, higher-low structure the constructive case rests on. A hold above it, equally, is not proof of health.
Above that sits 0.006602, a local reaction point with a narrower job. A first touch needs to become a defended response: sellers absorbed, price closed back above, not a wick through and drift. Price structure and volume are the strongest evidence available, and taker flow at the touch is worth watching — none of it settles the question in advance. Only after that defence appears does 0.006756 earn attention as the next watch, strictly in sequence.
The counterweights are open interest and the current funding snapshot; neither confirms strength the way price and volume do. Constructive, with positioning caution.
#Crypto #ChartAnalysis
$ATH The levels matter more than the headline here. An upward move answers whether price can travel; it leaves open everything about who defends it afterwards.
Work from the bottom up, because that is where the real stakes sit. 0.006514 is structural invalidation. Losing it does not fail one pullback — it removes the higher-high, higher-low structure the constructive case rests on. A hold above it, equally, is not proof of health.
Above that sits 0.006602, a local reaction point with a narrower job. A first touch needs to become a defended response: sellers absorbed, price closed back above, not a wick through and drift. Price structure and volume are the strongest evidence available, and taker flow at the touch is worth watching — none of it settles the question in advance. Only after that defence appears does 0.006756 earn attention as the next watch, strictly in sequence.
The counterweights are open interest and the current funding snapshot; neither confirms strength the way price and volume do. Constructive, with positioning caution.
#Crypto #ChartAnalysis
Work from the bottom up, because that is where the real stakes sit. 0.006514 is structural invalidation. Losing it does not fail one pullback — it removes the higher-high, higher-low structure the constructive case rests on. A hold above it, equally, is not proof of health.
Above that sits 0.006602, a local reaction point with a narrower job. A first touch needs to become a defended response: sellers absorbed, price closed back above, not a wick through and drift. Price structure and volume are the strongest evidence available, and taker flow at the touch is worth watching — none of it settles the question in advance. Only after that defence appears does 0.006756 earn attention as the next watch, strictly in sequence.
The counterweights are open interest and the current funding snapshot; neither confirms strength the way price and volume do. Constructive, with positioning caution.
#Crypto #ChartAnalysis
230
·
--
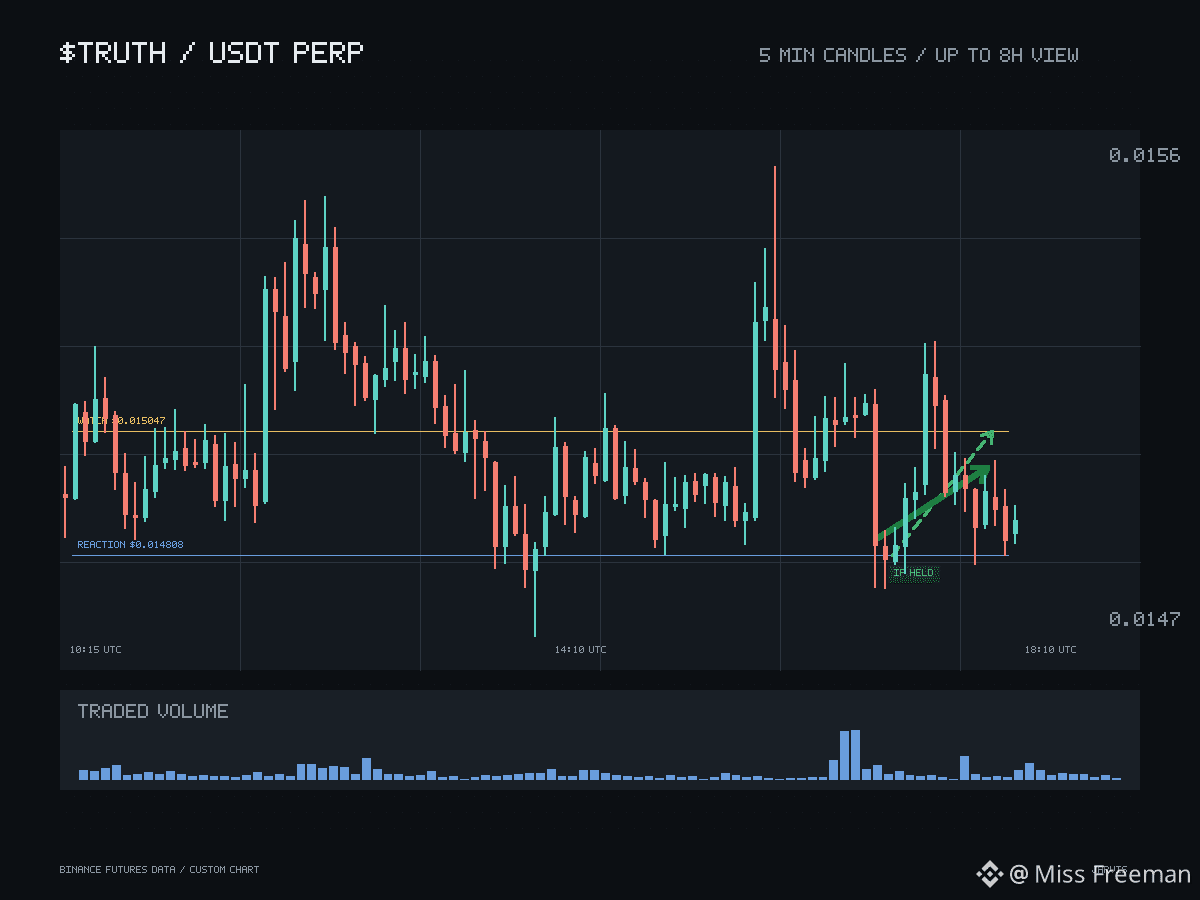
$TRUTH The cleanest thing to say about after today's sharp rally is that the move proves reach, not intent. A day like that rewrites the surface quickly; it says nothing yet about who appears when the move first gives some of itself back.
That question belongs to 0.014808. It is a local reaction point with a deliberately narrow job. A first retest there needs to become a defended response — sellers absorbed, price closed back above — rather than a wick straight through and a slow drift. Price structure and volume are the strongest confirming evidence on this chart, and neither can settle the matter before the test actually arrives.
Only if that defence shows does 0.015047 earn attention as the next watch, strictly in sequence. Strength that skips its own retest proves little about who plans to stay.
Lower down, 0.014542 works on a different layer entirely. Losing it does not merely fail one pullback; it cancels the lower-high, lower-low constructive read outright. A slip through the reaction level is not fatal, and a hold above invalidation is not proof of health — those claims must stay separate.
The counterweights are open interest and the current funding snapshot; neither confirms strength the way price and volume do. Constructive, with positioning caution.
#Crypto #ChartAnalysis
$TRUTH The cleanest thing to say about after today's sharp rally is that the move proves reach, not intent. A day like that rewrites the surface quickly; it says nothing yet about who appears when the move first gives some of itself back.
That question belongs to 0.014808. It is a local reaction point with a deliberately narrow job. A first retest there needs to become a defended response — sellers absorbed, price closed back above — rather than a wick straight through and a slow drift. Price structure and volume are the strongest confirming evidence on this chart, and neither can settle the matter before the test actually arrives.
Only if that defence shows does 0.015047 earn attention as the next watch, strictly in sequence. Strength that skips its own retest proves little about who plans to stay.
Lower down, 0.014542 works on a different layer entirely. Losing it does not merely fail one pullback; it cancels the lower-high, lower-low constructive read outright. A slip through the reaction level is not fatal, and a hold above invalidation is not proof of health — those claims must stay separate.
The counterweights are open interest and the current funding snapshot; neither confirms strength the way price and volume do. Constructive, with positioning caution.
#Crypto #ChartAnalysis
That question belongs to 0.014808. It is a local reaction point with a deliberately narrow job. A first retest there needs to become a defended response — sellers absorbed, price closed back above — rather than a wick straight through and a slow drift. Price structure and volume are the strongest confirming evidence on this chart, and neither can settle the matter before the test actually arrives.
Only if that defence shows does 0.015047 earn attention as the next watch, strictly in sequence. Strength that skips its own retest proves little about who plans to stay.
Lower down, 0.014542 works on a different layer entirely. Losing it does not merely fail one pullback; it cancels the lower-high, lower-low constructive read outright. A slip through the reaction level is not fatal, and a hold above invalidation is not proof of health — those claims must stay separate.
The counterweights are open interest and the current funding snapshot; neither confirms strength the way price and volume do. Constructive, with positioning caution.
#Crypto #ChartAnalysis
280

·
--
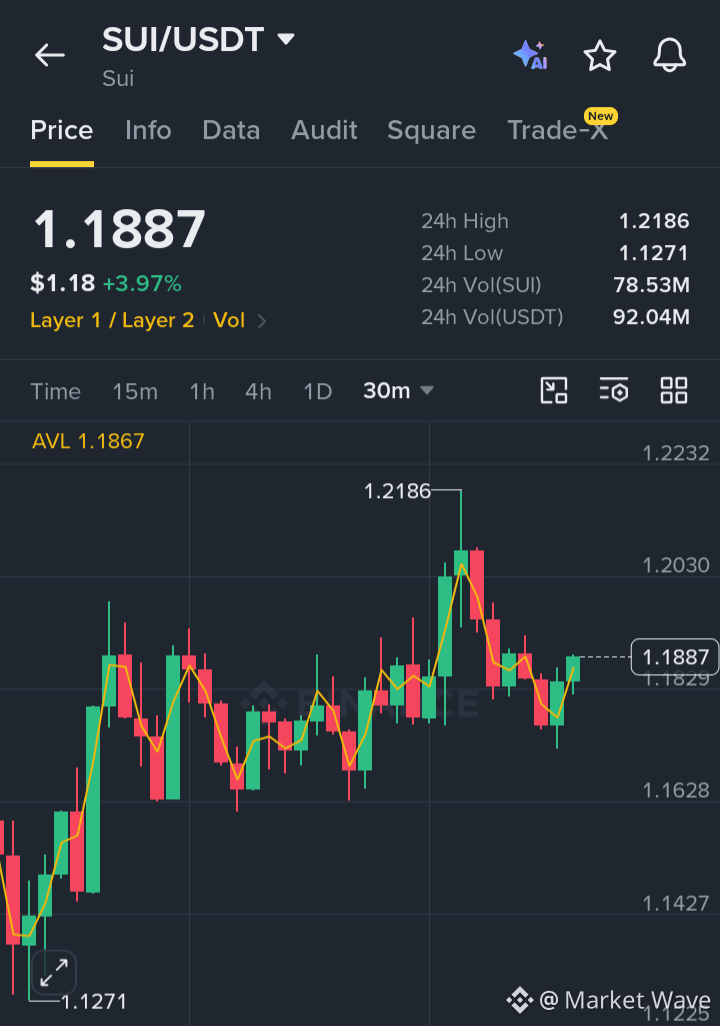
$SUI/USDT TECHNICAL ANALYSIS: BULLISH MOMENTUM CONTINUES $SUI
Targets & Stop Loss:
Target 1: 1.2030
Target 2: 1.2186
Target 3: 1.2232
Stop Loss: 1.1628
#TechnicalAnalysis #CryptoTradingInsights #BullishSetup #PriceAction #ChartAnalysis
$SUI /USDT TECHNICAL ANALYSIS: BULLISH MOMENTUM CONTINUES $SUI
Targets & Stop Loss:
Target 1: 1.2030
Target 2: 1.2186
Target 3: 1.2232
Stop Loss: 1.1628
#TechnicalAnalysis #CryptoTradingInsights #BullishSetup #PriceAction #ChartAnalysis
Targets & Stop Loss:
Target 1: 1.2030
Target 2: 1.2186
Target 3: 1.2232
Stop Loss: 1.1628
#TechnicalAnalysis #CryptoTradingInsights #BullishSetup #PriceAction #ChartAnalysis
107

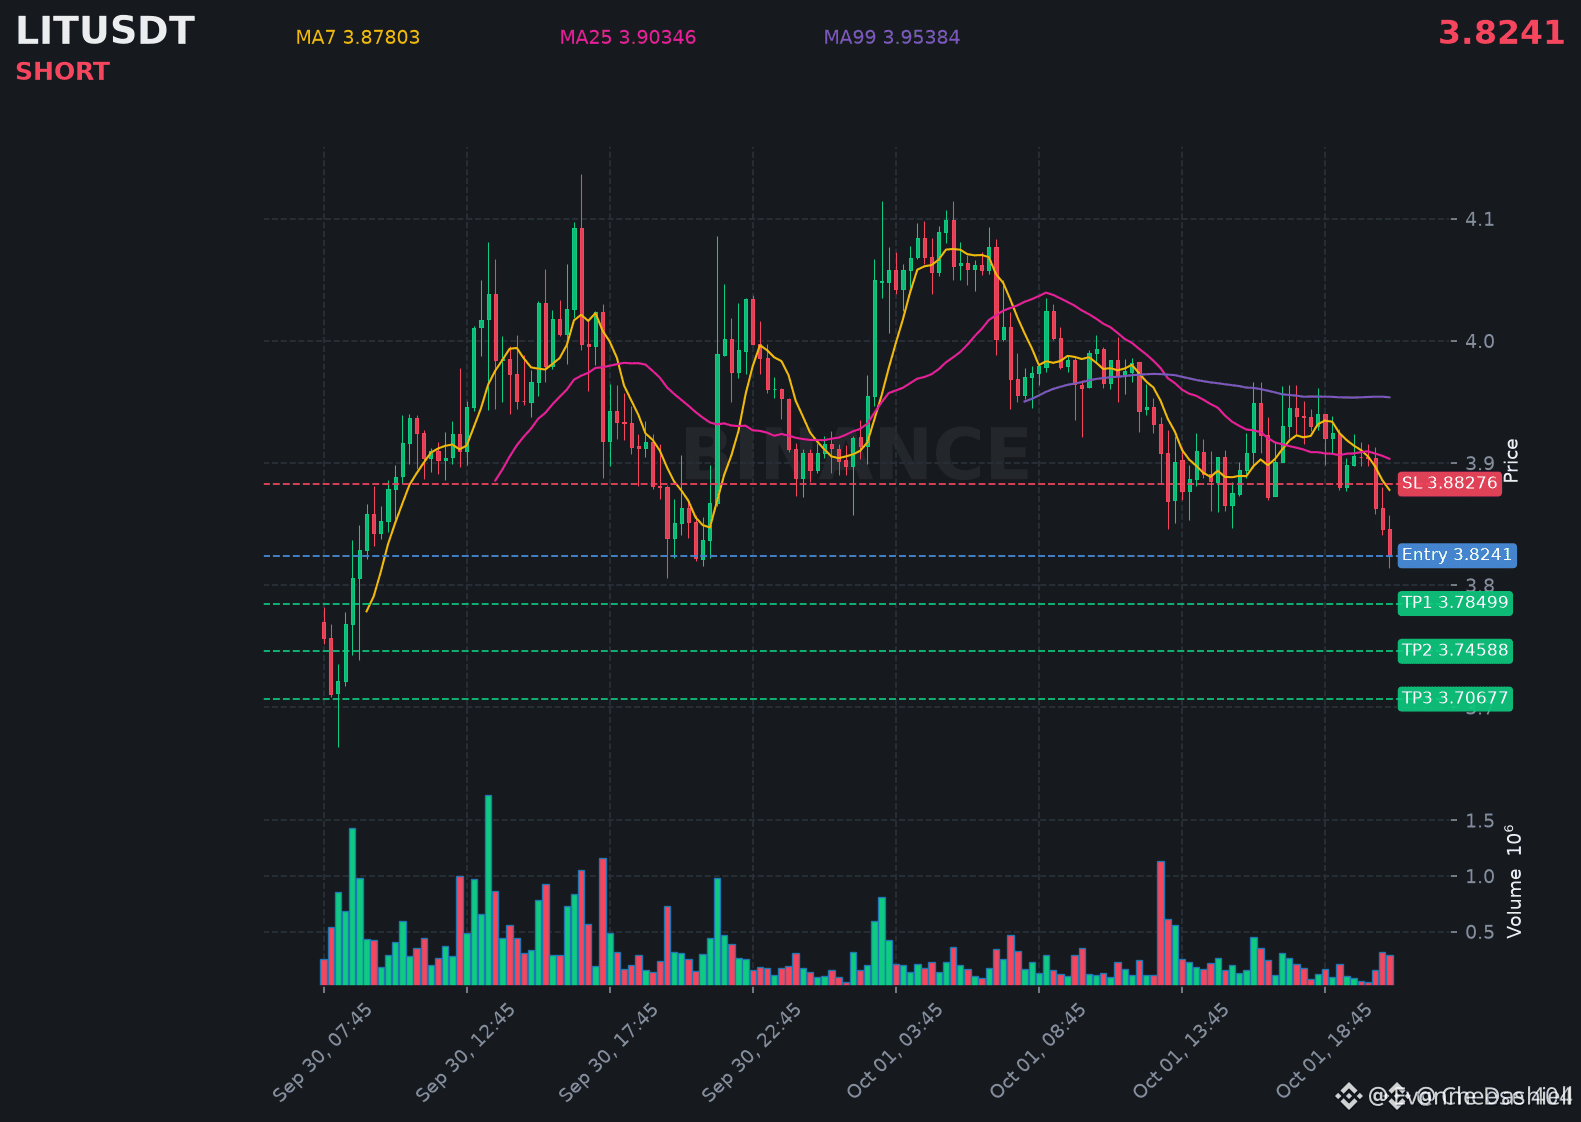
Why is nobody talking about how buying every $LIT dip without confirmation keeps destroying trading accounts?
Traders keep FOMO buying these pullbacks only to watch price seek lower support and wipe out their entries. They have no plan for when the demand zone fails.
$LIT is down 13% to $3.76 after reaching $5.53. Price has lost the short-term moving averages, turning $4.20 to $4.50 into resistance.
The demand zone between $3.50 and $3.76 is the first real support. Macro support sits all the way down at $2.80 if buyers do not show up. Watch $BTC and $BNB for clues on whether this bounce has any legs.
The actionable step is simple. Wait for a clean hold and bounce at $3.70 before even thinking about entering. That filter alone would have saved most people from this latest flush.
Are you buying the dip here or waiting for that $3.70 confirmation?
#LIT #ChartAnalysis #BNBChain
Why is nobody talking about how buying every $LIT dip without confirmation keeps destroying trading accounts?
Traders keep FOMO buying these pullbacks only to watch price seek lower support and wipe out their entries. They have no plan for when the demand zone fails.
$LIT is down 13% to $3.76 after reaching $5.53. Price has lost the short-term moving averages, turning $4.20 to $4.50 into resistance.
The demand zone between $3.50 and $3.76 is the first real support. Macro support sits all the way down at $2.80 if buyers do not show up. Watch $BTC and $BNB for clues on whether this bounce has any legs.
The actionable step is simple. Wait for a clean hold and bounce at $3.70 before even thinking about entering. That filter alone would have saved most people from this latest flush.
Are you buying the dip here or waiting for that $3.70 confirmation?
#LIT #ChartAnalysis #BNBChain
Traders keep FOMO buying these pullbacks only to watch price seek lower support and wipe out their entries. They have no plan for when the demand zone fails.
$LIT is down 13% to $3.76 after reaching $5.53. Price has lost the short-term moving averages, turning $4.20 to $4.50 into resistance.
The demand zone between $3.50 and $3.76 is the first real support. Macro support sits all the way down at $2.80 if buyers do not show up. Watch $BTC and $BNB for clues on whether this bounce has any legs.
The actionable step is simple. Wait for a clean hold and bounce at $3.70 before even thinking about entering. That filter alone would have saved most people from this latest flush.
Are you buying the dip here or waiting for that $3.70 confirmation?
#LIT #ChartAnalysis #BNBChain
14
·
--
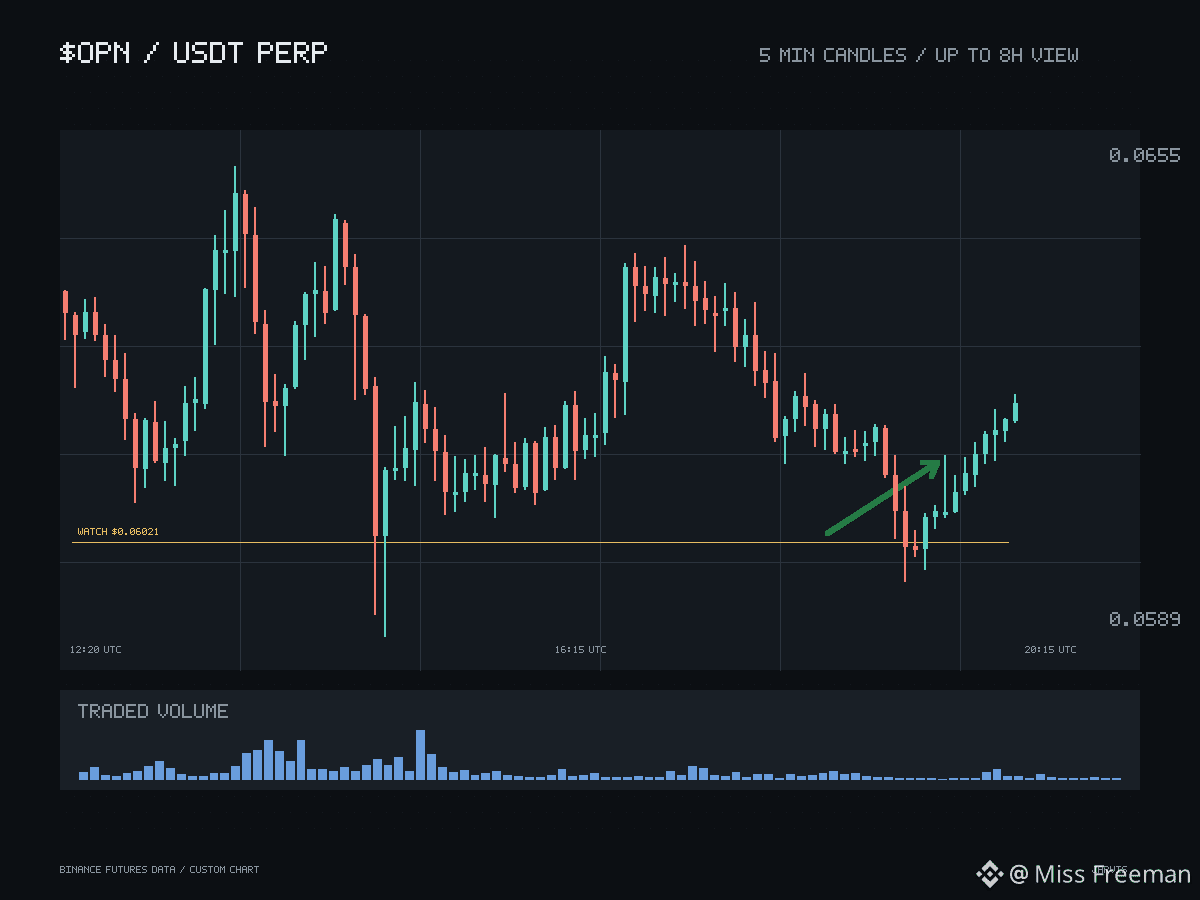
$OPN A strong day on puts the token on more watchlists than it was on yesterday. That is the easy part of the read. The harder part is that a single strong session proves price can travel; it does not yet prove who shows up when the move cools.
Three levels now organise the chart, and they do different jobs. The nearest is 0.05877, a local reaction point with a narrow remit. If price works back to it, the tape needs to produce a defended response — sellers absorbed, a close back above — rather than a clean wick through and drift. Price structure and volume are the strongest evidence available here, and neither settles that question before the test arrives.
Only after such a defence appears does 0.06021 earn attention as the next watch — strictly in sequence, never ahead of the reaction.
Lower down, 0.05782 works on a different layer entirely. Losing it would not merely fail one pullback; it removes the higher-high, higher-low structure the constructive case rests on. A slip through 0.05877 is not fatal, and a hold above 0.05782 is not proof of health. Those claims must stay separate.
Open interest and the current funding snapshot remain the counterweights; neither confirms strength the way price and volume do. Constructive, with positioning caution.
#Crypto #ChartAnalysis
$OPN A strong day on puts the token on more watchlists than it was on yesterday. That is the easy part of the read. The harder part is that a single strong session proves price can travel; it does not yet prove who shows up when the move cools.
Three levels now organise the chart, and they do different jobs. The nearest is 0.05877, a local reaction point with a narrow remit. If price works back to it, the tape needs to produce a defended response — sellers absorbed, a close back above — rather than a clean wick through and drift. Price structure and volume are the strongest evidence available here, and neither settles that question before the test arrives.
Only after such a defence appears does 0.06021 earn attention as the next watch — strictly in sequence, never ahead of the reaction.
Lower down, 0.05782 works on a different layer entirely. Losing it would not merely fail one pullback; it removes the higher-high, higher-low structure the constructive case rests on. A slip through 0.05877 is not fatal, and a hold above 0.05782 is not proof of health. Those claims must stay separate.
Open interest and the current funding snapshot remain the counterweights; neither confirms strength the way price and volume do. Constructive, with positioning caution.
#Crypto #ChartAnalysis
Three levels now organise the chart, and they do different jobs. The nearest is 0.05877, a local reaction point with a narrow remit. If price works back to it, the tape needs to produce a defended response — sellers absorbed, a close back above — rather than a clean wick through and drift. Price structure and volume are the strongest evidence available here, and neither settles that question before the test arrives.
Only after such a defence appears does 0.06021 earn attention as the next watch — strictly in sequence, never ahead of the reaction.
Lower down, 0.05782 works on a different layer entirely. Losing it would not merely fail one pullback; it removes the higher-high, higher-low structure the constructive case rests on. A slip through 0.05877 is not fatal, and a hold above 0.05782 is not proof of health. Those claims must stay separate.
Open interest and the current funding snapshot remain the counterweights; neither confirms strength the way price and volume do. Constructive, with positioning caution.
#Crypto #ChartAnalysis
51
·
--
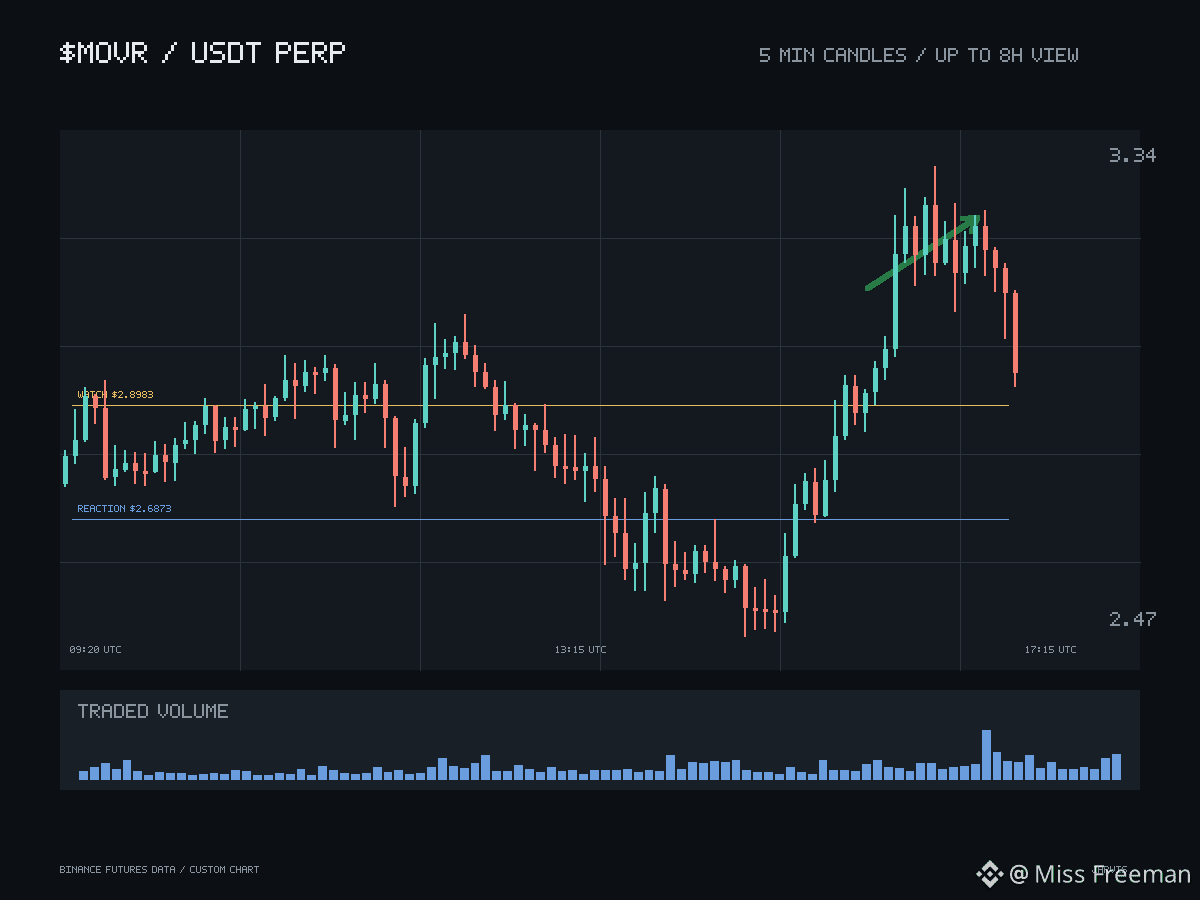
$MOVR Three levels on now carry the whole read, and they are not interchangeable. After the move, the temptation is to treat size as evidence. It is evidence of travel, nothing more.
Start from the bottom, because that is where the stakes actually live. 2.1606 is structural invalidation. Losing it does not fail one pullback; it cancels the continuation case outright, removing the higher-high, higher-low structure the constructive side rests on. A hold above it, by the same logic, is not proof of health.
Between here and there sits 2.6873, a local reaction point with a much narrower job. A first retest needs to become a defended response — sellers absorbed, price closed back above — rather than a wick through and drift. Price structure and volume are the strongest confirming evidence on this chart, and taker flow at the touch is worth watching, but none of it answers the question before the test arrives. Only after that defence shows does 2.8983 earn attention as the next watch, strictly in sequence.
The counterweights are open interest and the current funding snapshot; neither confirms strength the way price and volume do. Constructive, with positioning caution.
#Crypto #ChartAnalysis
$MOVR Three levels on now carry the whole read, and they are not interchangeable. After the move, the temptation is to treat size as evidence. It is evidence of travel, nothing more.
Start from the bottom, because that is where the stakes actually live. 2.1606 is structural invalidation. Losing it does not fail one pullback; it cancels the continuation case outright, removing the higher-high, higher-low structure the constructive side rests on. A hold above it, by the same logic, is not proof of health.
Between here and there sits 2.6873, a local reaction point with a much narrower job. A first retest needs to become a defended response — sellers absorbed, price closed back above — rather than a wick through and drift. Price structure and volume are the strongest confirming evidence on this chart, and taker flow at the touch is worth watching, but none of it answers the question before the test arrives. Only after that defence shows does 2.8983 earn attention as the next watch, strictly in sequence.
The counterweights are open interest and the current funding snapshot; neither confirms strength the way price and volume do. Constructive, with positioning caution.
#Crypto #ChartAnalysis
Start from the bottom, because that is where the stakes actually live. 2.1606 is structural invalidation. Losing it does not fail one pullback; it cancels the continuation case outright, removing the higher-high, higher-low structure the constructive side rests on. A hold above it, by the same logic, is not proof of health.
Between here and there sits 2.6873, a local reaction point with a much narrower job. A first retest needs to become a defended response — sellers absorbed, price closed back above — rather than a wick through and drift. Price structure and volume are the strongest confirming evidence on this chart, and taker flow at the touch is worth watching, but none of it answers the question before the test arrives. Only after that defence shows does 2.8983 earn attention as the next watch, strictly in sequence.
The counterweights are open interest and the current funding snapshot; neither confirms strength the way price and volume do. Constructive, with positioning caution.
#Crypto #ChartAnalysis
95
·
--
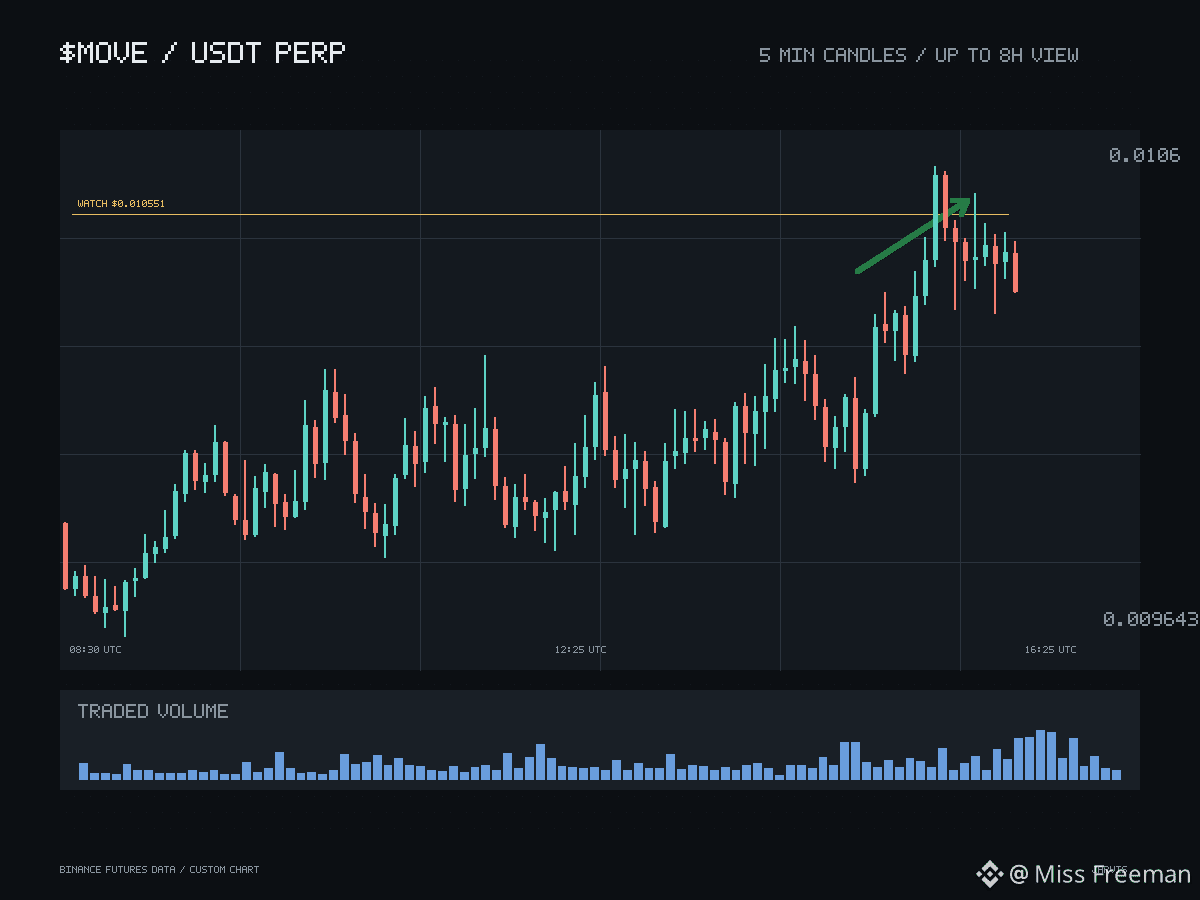
$MOVE A strong rally day on rewrites the surface quickly, and it is tempting to treat the size of the move as information about who is behind it. It is not. The rally confirms travel. The chart underneath now carries three jobs that need to stay distinct.
The closest is 0.009382, a local reaction point with a deliberately narrow remit. When price first returns to it, the tape needs to produce a defended response — sellers absorbed, a close back above — rather than a wick through and a slow bleed. Taker flow around that touch is worth watching, though like everything else it confirms only after the fact. Price structure and volume remain the strongest evidence available here, and neither can settle the question in advance.
If that defence genuinely appears, 0.010551 earns attention as the next watch — strictly after the reaction, never before it. A push that skips its own retest says little about intent.
Lower down, 0.008626 works on a different layer in kind, not just distance. Losing it does not merely fail one pullback; it cancels the higher-high, higher-low read this constructive case rests on. A slip through the reaction level is not fatal, and a hold above invalidation is not proof of health.
The counterweights sit on the derivatives side: open interest and the current funding snapshot, neither of which confirms strength the way price and volume do. Constructive, with positioning caution.
#Crypto #ChartAnalysis
$MOVE A strong rally day on rewrites the surface quickly, and it is tempting to treat the size of the move as information about who is behind it. It is not. The rally confirms travel. The chart underneath now carries three jobs that need to stay distinct.
The closest is 0.009382, a local reaction point with a deliberately narrow remit. When price first returns to it, the tape needs to produce a defended response — sellers absorbed, a close back above — rather than a wick through and a slow bleed. Taker flow around that touch is worth watching, though like everything else it confirms only after the fact. Price structure and volume remain the strongest evidence available here, and neither can settle the question in advance.
If that defence genuinely appears, 0.010551 earns attention as the next watch — strictly after the reaction, never before it. A push that skips its own retest says little about intent.
Lower down, 0.008626 works on a different layer in kind, not just distance. Losing it does not merely fail one pullback; it cancels the higher-high, higher-low read this constructive case rests on. A slip through the reaction level is not fatal, and a hold above invalidation is not proof of health.
The counterweights sit on the derivatives side: open interest and the current funding snapshot, neither of which confirms strength the way price and volume do. Constructive, with positioning caution.
#Crypto #ChartAnalysis
The closest is 0.009382, a local reaction point with a deliberately narrow remit. When price first returns to it, the tape needs to produce a defended response — sellers absorbed, a close back above — rather than a wick through and a slow bleed. Taker flow around that touch is worth watching, though like everything else it confirms only after the fact. Price structure and volume remain the strongest evidence available here, and neither can settle the question in advance.
If that defence genuinely appears, 0.010551 earns attention as the next watch — strictly after the reaction, never before it. A push that skips its own retest says little about intent.
Lower down, 0.008626 works on a different layer in kind, not just distance. Losing it does not merely fail one pullback; it cancels the higher-high, higher-low read this constructive case rests on. A slip through the reaction level is not fatal, and a hold above invalidation is not proof of health.
The counterweights sit on the derivatives side: open interest and the current funding snapshot, neither of which confirms strength the way price and volume do. Constructive, with positioning caution.
#Crypto #ChartAnalysis
31
·
--
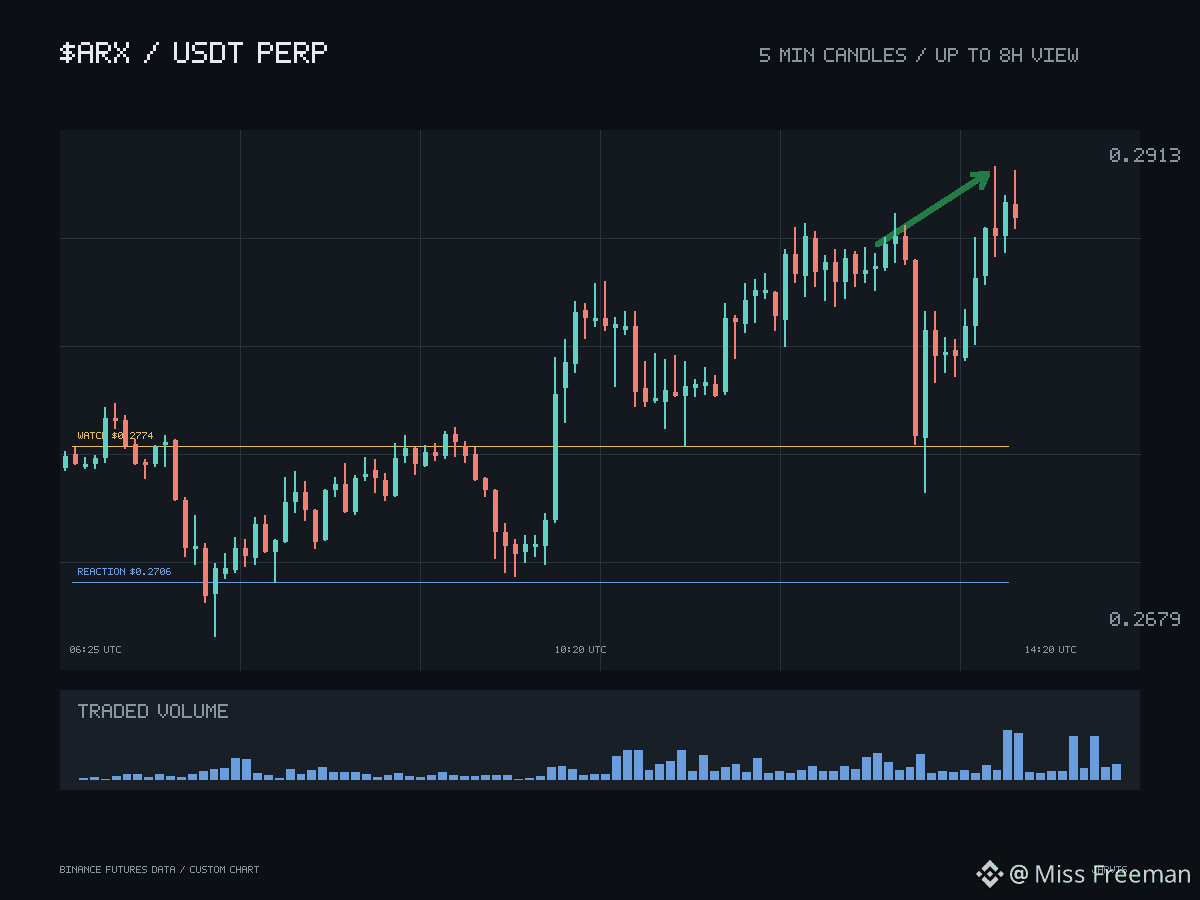
$ARX A sharp day rewrites the surface of a chart quickly. What it cannot rewrite is the question of who shows up when the move cools. has travelled, and the structure underneath it now carries three distinct jobs that should not be blurred together.
The first belongs to 0.2706. It is a local reaction point, nothing more ambitious. When price works back toward it, the tape either produces a defended response — sellers absorbed, a close back above — or a wick through and a slow drift. Price structure and volume are the strongest evidence available here, yet neither can settle that question before the test arrives. Only a genuine defence earns 0.2774 its place as the next watch — after the reaction, strictly never before it. A push that skips its own retest proves little about intent.
Below, 0.2489 works in a different register entirely. Losing it does not merely fail one retest; it removes the higher-high, higher-low read this constructive case rests on. Panic at the first level, or comfort above the second, collapses roles that must stay separate.
Open interest and the current funding snapshot remain the counterweights; neither confirms strength the way price and volume do. Constructive, with positioning caution.
#Crypto #ChartAnalysis
$ARX A sharp day rewrites the surface of a chart quickly. What it cannot rewrite is the question of who shows up when the move cools. has travelled, and the structure underneath it now carries three distinct jobs that should not be blurred together.
The first belongs to 0.2706. It is a local reaction point, nothing more ambitious. When price works back toward it, the tape either produces a defended response — sellers absorbed, a close back above — or a wick through and a slow drift. Price structure and volume are the strongest evidence available here, yet neither can settle that question before the test arrives. Only a genuine defence earns 0.2774 its place as the next watch — after the reaction, strictly never before it. A push that skips its own retest proves little about intent.
Below, 0.2489 works in a different register entirely. Losing it does not merely fail one retest; it removes the higher-high, higher-low read this constructive case rests on. Panic at the first level, or comfort above the second, collapses roles that must stay separate.
Open interest and the current funding snapshot remain the counterweights; neither confirms strength the way price and volume do. Constructive, with positioning caution.
#Crypto #ChartAnalysis
The first belongs to 0.2706. It is a local reaction point, nothing more ambitious. When price works back toward it, the tape either produces a defended response — sellers absorbed, a close back above — or a wick through and a slow drift. Price structure and volume are the strongest evidence available here, yet neither can settle that question before the test arrives. Only a genuine defence earns 0.2774 its place as the next watch — after the reaction, strictly never before it. A push that skips its own retest proves little about intent.
Below, 0.2489 works in a different register entirely. Losing it does not merely fail one retest; it removes the higher-high, higher-low read this constructive case rests on. Panic at the first level, or comfort above the second, collapses roles that must stay separate.
Open interest and the current funding snapshot remain the counterweights; neither confirms strength the way price and volume do. Constructive, with positioning caution.
#Crypto #ChartAnalysis
234
·
--
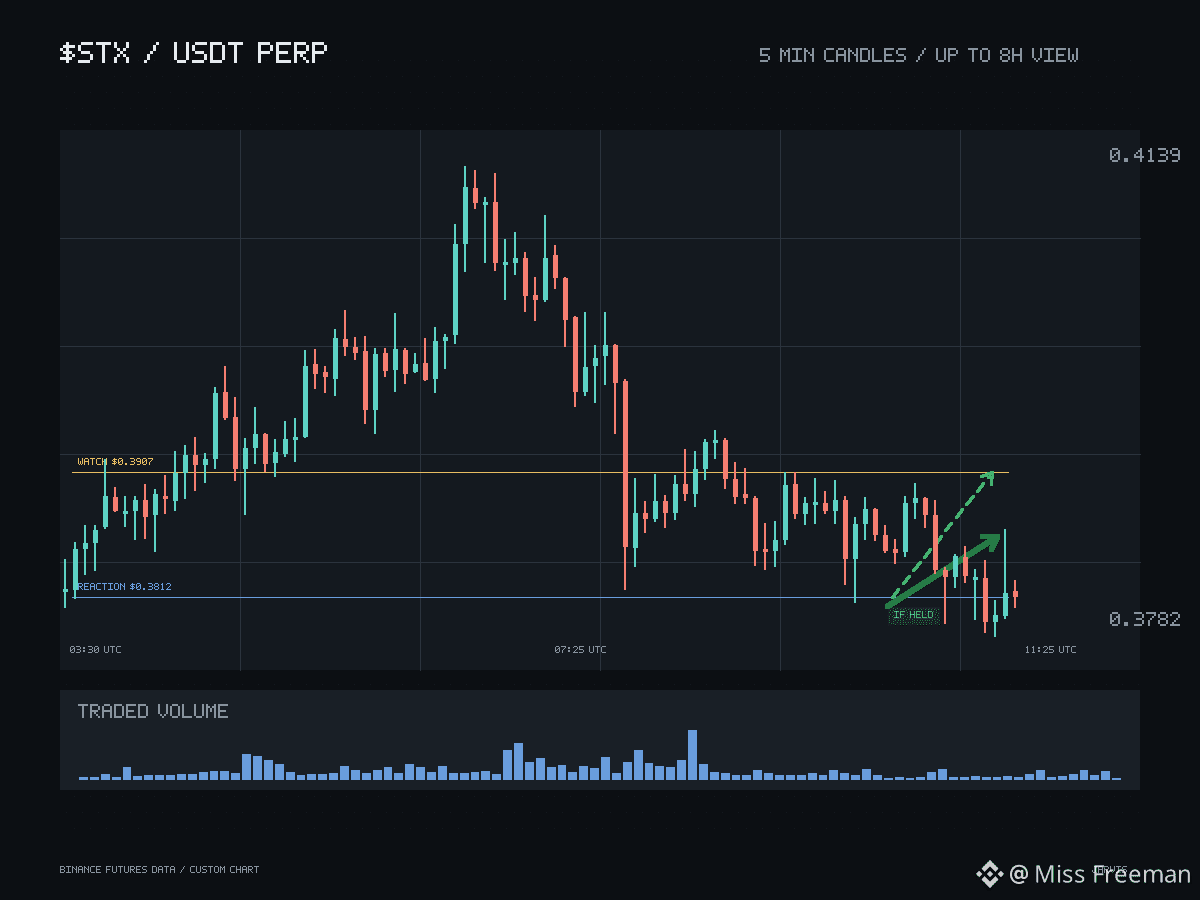
$STX An up day on proves travel, not intent. What the move has not yet shown is what happens the first time it gives some of itself back.
The level closest to that question is 0.3812. Its job is deliberately small: a local reaction point, not a verdict on the rally. A first touch there needs to become a defended response — sellers absorbed, price closed back above — rather than a wick straight through followed by drift. Price structure and volume are the strongest confirming evidence on this chart, and neither can settle that question before the test actually arrives. Only if the defence appears does 0.3907 earn attention as the next watch — strictly after the reaction, never ahead of it. Strength that skips its own retest says little about who plans to stay.
Lower down, 0.3726 does work of a different kind, not just a different distance. Losing it would not merely fail one pullback; it removes the continuation case entirely. A slip through 0.3812 is not fatal, and a hold above 0.3726 is not proof of health — those are separate claims, and merging them is where reads like this go wrong.
The counterweights sit on the derivatives side: open interest and the current funding snapshot. Neither confirms strength the way price and volume do. Constructive, with positioning caution, is the honest stance.
#Crypto #ChartAnalysis
$STX An up day on proves travel, not intent. What the move has not yet shown is what happens the first time it gives some of itself back.
The level closest to that question is 0.3812. Its job is deliberately small: a local reaction point, not a verdict on the rally. A first touch there needs to become a defended response — sellers absorbed, price closed back above — rather than a wick straight through followed by drift. Price structure and volume are the strongest confirming evidence on this chart, and neither can settle that question before the test actually arrives. Only if the defence appears does 0.3907 earn attention as the next watch — strictly after the reaction, never ahead of it. Strength that skips its own retest says little about who plans to stay.
Lower down, 0.3726 does work of a different kind, not just a different distance. Losing it would not merely fail one pullback; it removes the continuation case entirely. A slip through 0.3812 is not fatal, and a hold above 0.3726 is not proof of health — those are separate claims, and merging them is where reads like this go wrong.
The counterweights sit on the derivatives side: open interest and the current funding snapshot. Neither confirms strength the way price and volume do. Constructive, with positioning caution, is the honest stance.
#Crypto #ChartAnalysis
The level closest to that question is 0.3812. Its job is deliberately small: a local reaction point, not a verdict on the rally. A first touch there needs to become a defended response — sellers absorbed, price closed back above — rather than a wick straight through followed by drift. Price structure and volume are the strongest confirming evidence on this chart, and neither can settle that question before the test actually arrives. Only if the defence appears does 0.3907 earn attention as the next watch — strictly after the reaction, never ahead of it. Strength that skips its own retest says little about who plans to stay.
Lower down, 0.3726 does work of a different kind, not just a different distance. Losing it would not merely fail one pullback; it removes the continuation case entirely. A slip through 0.3812 is not fatal, and a hold above 0.3726 is not proof of health — those are separate claims, and merging them is where reads like this go wrong.
The counterweights sit on the derivatives side: open interest and the current funding snapshot. Neither confirms strength the way price and volume do. Constructive, with positioning caution, is the honest stance.
#Crypto #ChartAnalysis
63
·
--
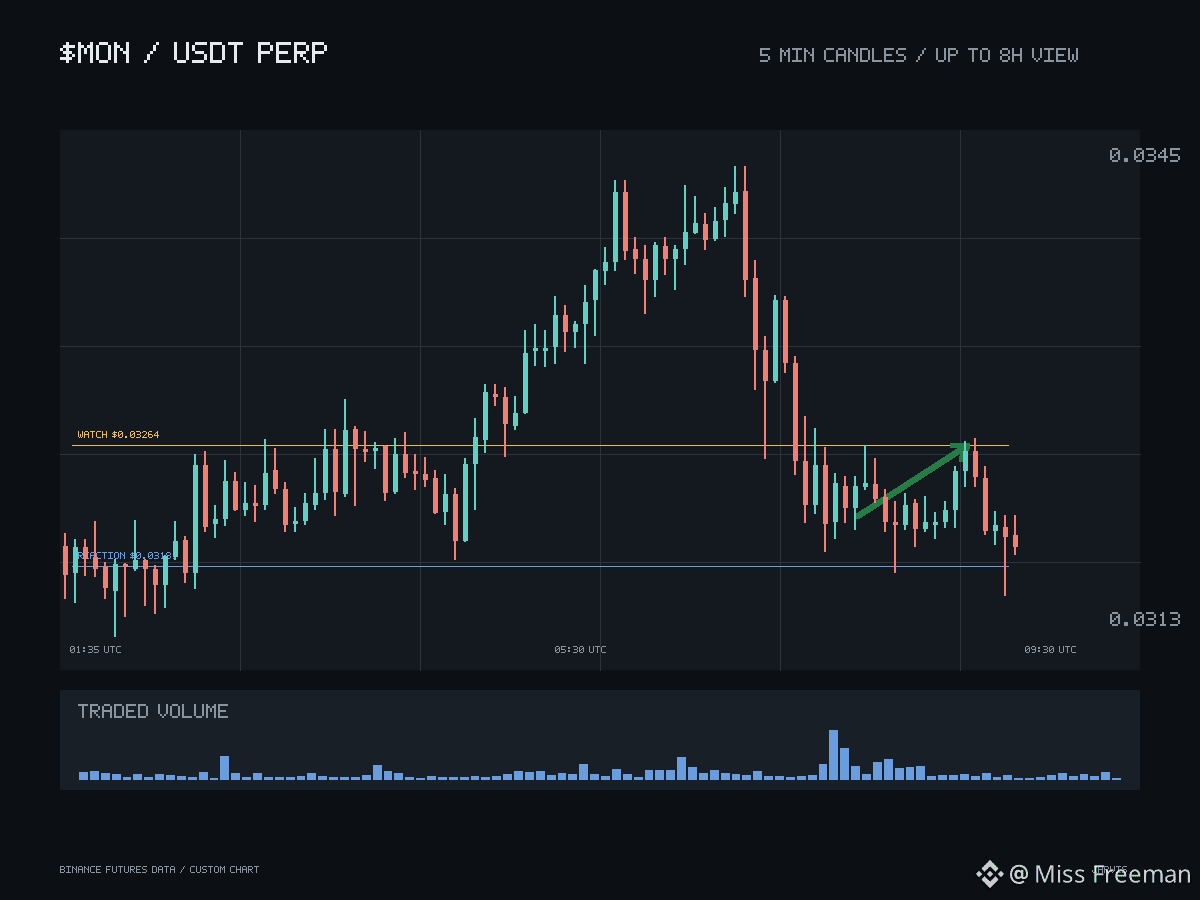
$MON What has shown is range — what it has not yet shown is who holds price when the rally pauses.
The level closest to that question is 0.03181. Its job is small and specific: a local reaction point. When price first comes back to it, the tape needs to produce a defended response — sellers absorbed, a close back above — rather than a clean wick through and a slow bleed. Price structure and volume are the strongest evidence available here, and neither answers that question before the test happens. If the defence does appear, 0.03264 earns attention as the next watch — after the reaction, never ahead of it. A push that skips its own retest proves little about intent.
Further down, 0.02975 plays a different role in kind. Losing it would not merely fail one pullback; it removes the higher-high, higher-low read the continuation case rests on. A slip through 0.03181 is not fatal. A hold above 0.02975 is not proof of health. Those are separate claims.
Open interest and the current funding snapshot are the counterweights — neither confirms strength the way price and volume do. Constructive, with positioning caution.
#Crypto #ChartAnalysis
$MON What has shown is range — what it has not yet shown is who holds price when the rally pauses.
The level closest to that question is 0.03181. Its job is small and specific: a local reaction point. When price first comes back to it, the tape needs to produce a defended response — sellers absorbed, a close back above — rather than a clean wick through and a slow bleed. Price structure and volume are the strongest evidence available here, and neither answers that question before the test happens. If the defence does appear, 0.03264 earns attention as the next watch — after the reaction, never ahead of it. A push that skips its own retest proves little about intent.
Further down, 0.02975 plays a different role in kind. Losing it would not merely fail one pullback; it removes the higher-high, higher-low read the continuation case rests on. A slip through 0.03181 is not fatal. A hold above 0.02975 is not proof of health. Those are separate claims.
Open interest and the current funding snapshot are the counterweights — neither confirms strength the way price and volume do. Constructive, with positioning caution.
#Crypto #ChartAnalysis
The level closest to that question is 0.03181. Its job is small and specific: a local reaction point. When price first comes back to it, the tape needs to produce a defended response — sellers absorbed, a close back above — rather than a clean wick through and a slow bleed. Price structure and volume are the strongest evidence available here, and neither answers that question before the test happens. If the defence does appear, 0.03264 earns attention as the next watch — after the reaction, never ahead of it. A push that skips its own retest proves little about intent.
Further down, 0.02975 plays a different role in kind. Losing it would not merely fail one pullback; it removes the higher-high, higher-low read the continuation case rests on. A slip through 0.03181 is not fatal. A hold above 0.02975 is not proof of health. Those are separate claims.
Open interest and the current funding snapshot are the counterweights — neither confirms strength the way price and volume do. Constructive, with positioning caution.
#Crypto #ChartAnalysis
81
·
--
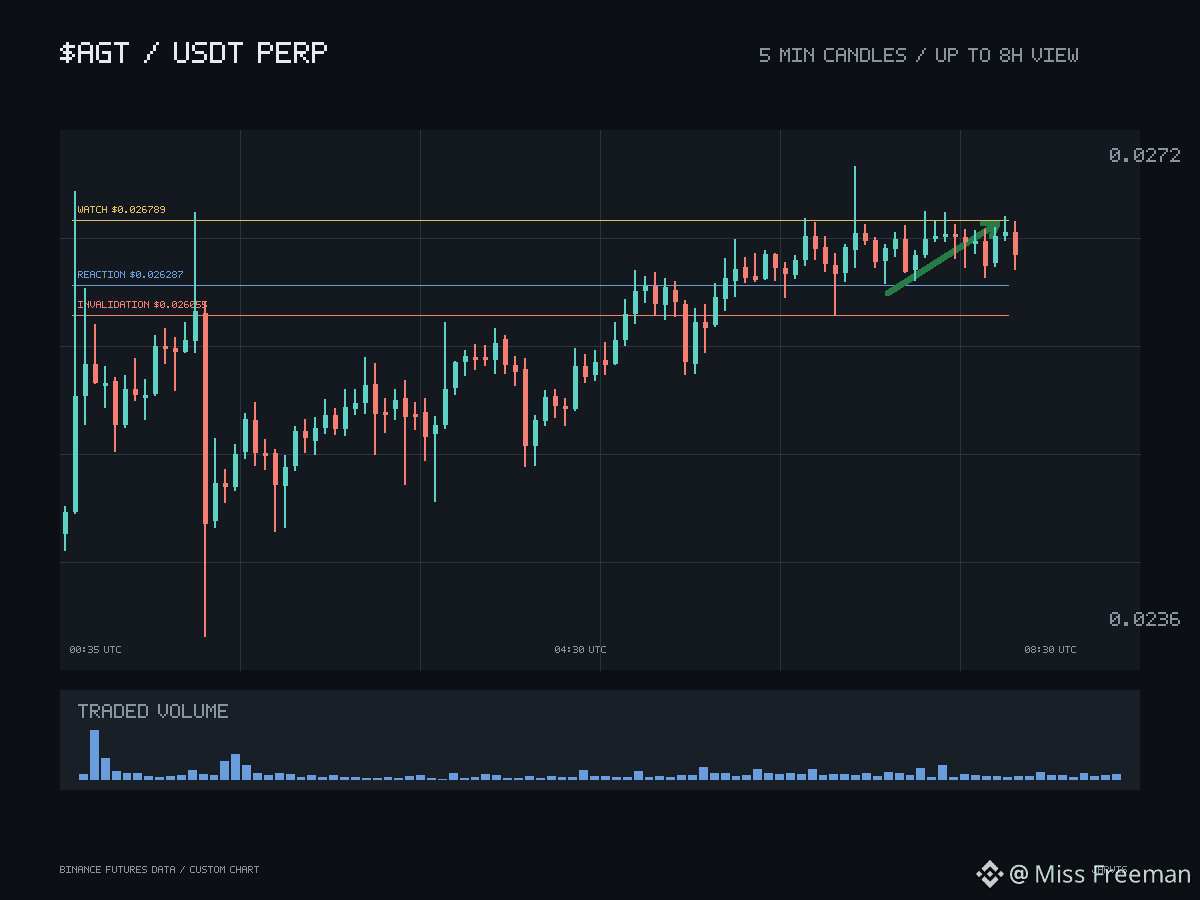
$AGT A sharp rally on answers the easy question — yes, price can travel — and leaves the harder one untouched: what sits underneath when this move first breathes back. The rally is a fact about the past session, not about intent.
The chart underneath is organised around three levels that do not share a job, and the whole read depends on keeping them apart. The nearest is 0.026287, a local reaction point with a deliberately narrow role. A first touch there needs to become a defended response — sellers absorbed, price closed back above — rather than a clean wick through and a drift. Price structure and volume are the strongest confirming evidence on this chart, and neither can settle that in advance.
Only if the defence genuinely appears does 0.026789 earn attention as the next watch — strictly after the reaction, never before it. A push that skips its own retest says little about who plans to stay.
Lower down, 0.026055 works on a different layer entirely. Losing it does not merely fail one retest; it removes the higher-high, higher-low read this constructive case rests on. Panic at the first level, or complacency above the second, collapses two roles that need to stay separate.
Open interest and the current funding snapshot are the counterweights; neither confirms strength the way price and volume do. Constructive, with positioning caution.
#Crypto #ChartAnalysis
$AGT A sharp rally on answers the easy question — yes, price can travel — and leaves the harder one untouched: what sits underneath when this move first breathes back. The rally is a fact about the past session, not about intent.
The chart underneath is organised around three levels that do not share a job, and the whole read depends on keeping them apart. The nearest is 0.026287, a local reaction point with a deliberately narrow role. A first touch there needs to become a defended response — sellers absorbed, price closed back above — rather than a clean wick through and a drift. Price structure and volume are the strongest confirming evidence on this chart, and neither can settle that in advance.
Only if the defence genuinely appears does 0.026789 earn attention as the next watch — strictly after the reaction, never before it. A push that skips its own retest says little about who plans to stay.
Lower down, 0.026055 works on a different layer entirely. Losing it does not merely fail one retest; it removes the higher-high, higher-low read this constructive case rests on. Panic at the first level, or complacency above the second, collapses two roles that need to stay separate.
Open interest and the current funding snapshot are the counterweights; neither confirms strength the way price and volume do. Constructive, with positioning caution.
#Crypto #ChartAnalysis
The chart underneath is organised around three levels that do not share a job, and the whole read depends on keeping them apart. The nearest is 0.026287, a local reaction point with a deliberately narrow role. A first touch there needs to become a defended response — sellers absorbed, price closed back above — rather than a clean wick through and a drift. Price structure and volume are the strongest confirming evidence on this chart, and neither can settle that in advance.
Only if the defence genuinely appears does 0.026789 earn attention as the next watch — strictly after the reaction, never before it. A push that skips its own retest says little about who plans to stay.
Lower down, 0.026055 works on a different layer entirely. Losing it does not merely fail one retest; it removes the higher-high, higher-low read this constructive case rests on. Panic at the first level, or complacency above the second, collapses two roles that need to stay separate.
Open interest and the current funding snapshot are the counterweights; neither confirms strength the way price and volume do. Constructive, with positioning caution.
#Crypto #ChartAnalysis
102

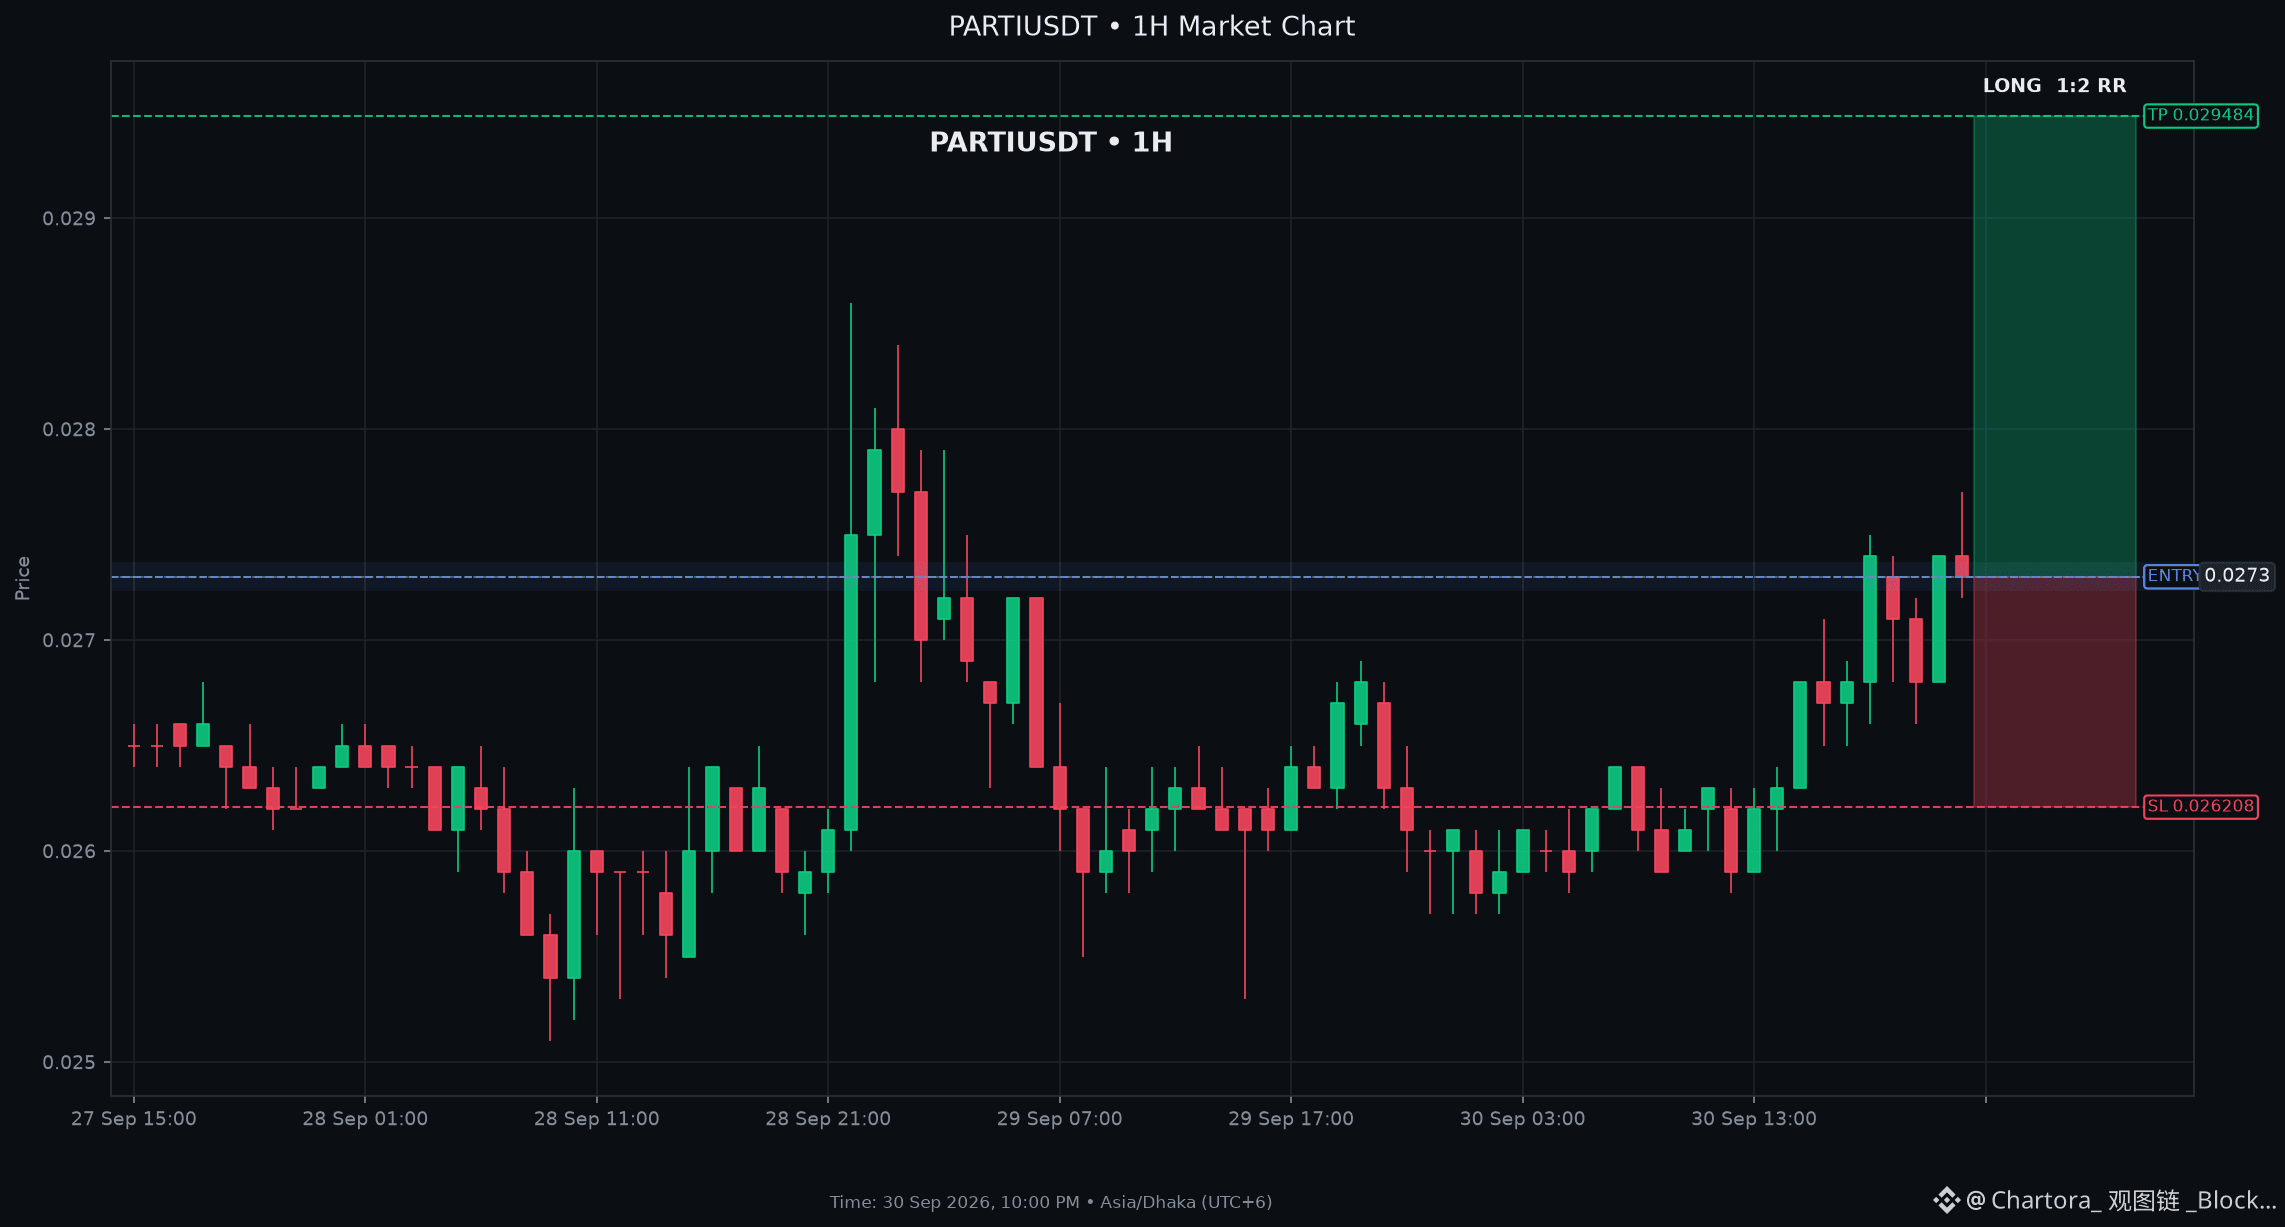
$PARTI: Prepares for Parabolic Phase: Key Technical Trigger Met
LONG SETUP PARTI
Entry: $0.02723 - $0.02737
Stop Loss: $0.02621
Take Profit: $0.02948 (2R)
Key Levels: Support $0.02680 | Resistance $0.02750
Technical Analysis for $PARTI: $PARTI fallback technical analysis: RSI is 60.4, showing bullish momentum without being deeply overbought, price is holding above the 21 EMA, supporting the bullish bias, MACD is above its signal line, confirming positive momentum, volume is expanding by 42.0%, and price is above the 50 EMA, keeping the short-term structure constructive. Together, these signals support a conditional LONG continuation setup. Buyers still need to defend the entry zone and follow through toward resistance.
#PARTI #LongSetup #ChartAnalysis
LONG $PARTI
$PARTI : Prepares for Parabolic Phase: Key Technical Trigger Met
LONG SETUP PARTI
Entry: $0.02723 - $0.02737
Stop Loss: $0.02621
Take Profit: $0.02948 (2R)
Key Levels: Support $0.02680 | Resistance $0.02750
Technical Analysis for $PARTI : $PARTI fallback technical analysis: RSI is 60.4, showing bullish momentum without being deeply overbought, price is holding above the 21 EMA, supporting the bullish bias, MACD is above its signal line, confirming positive momentum, volume is expanding by 42.0%, and price is above the 50 EMA, keeping the short-term structure constructive. Together, these signals support a conditional LONG continuation setup. Buyers still need to defend the entry zone and follow through toward resistance.
#PARTI #LongSetup #ChartAnalysis
LONG $PARTI
LONG SETUP PARTI
Entry: $0.02723 - $0.02737
Stop Loss: $0.02621
Take Profit: $0.02948 (2R)
Key Levels: Support $0.02680 | Resistance $0.02750
Technical Analysis for $PARTI : $PARTI fallback technical analysis: RSI is 60.4, showing bullish momentum without being deeply overbought, price is holding above the 21 EMA, supporting the bullish bias, MACD is above its signal line, confirming positive momentum, volume is expanding by 42.0%, and price is above the 50 EMA, keeping the short-term structure constructive. Together, these signals support a conditional LONG continuation setup. Buyers still need to defend the entry zone and follow through toward resistance.
#PARTI #LongSetup #ChartAnalysis
LONG $PARTI
9
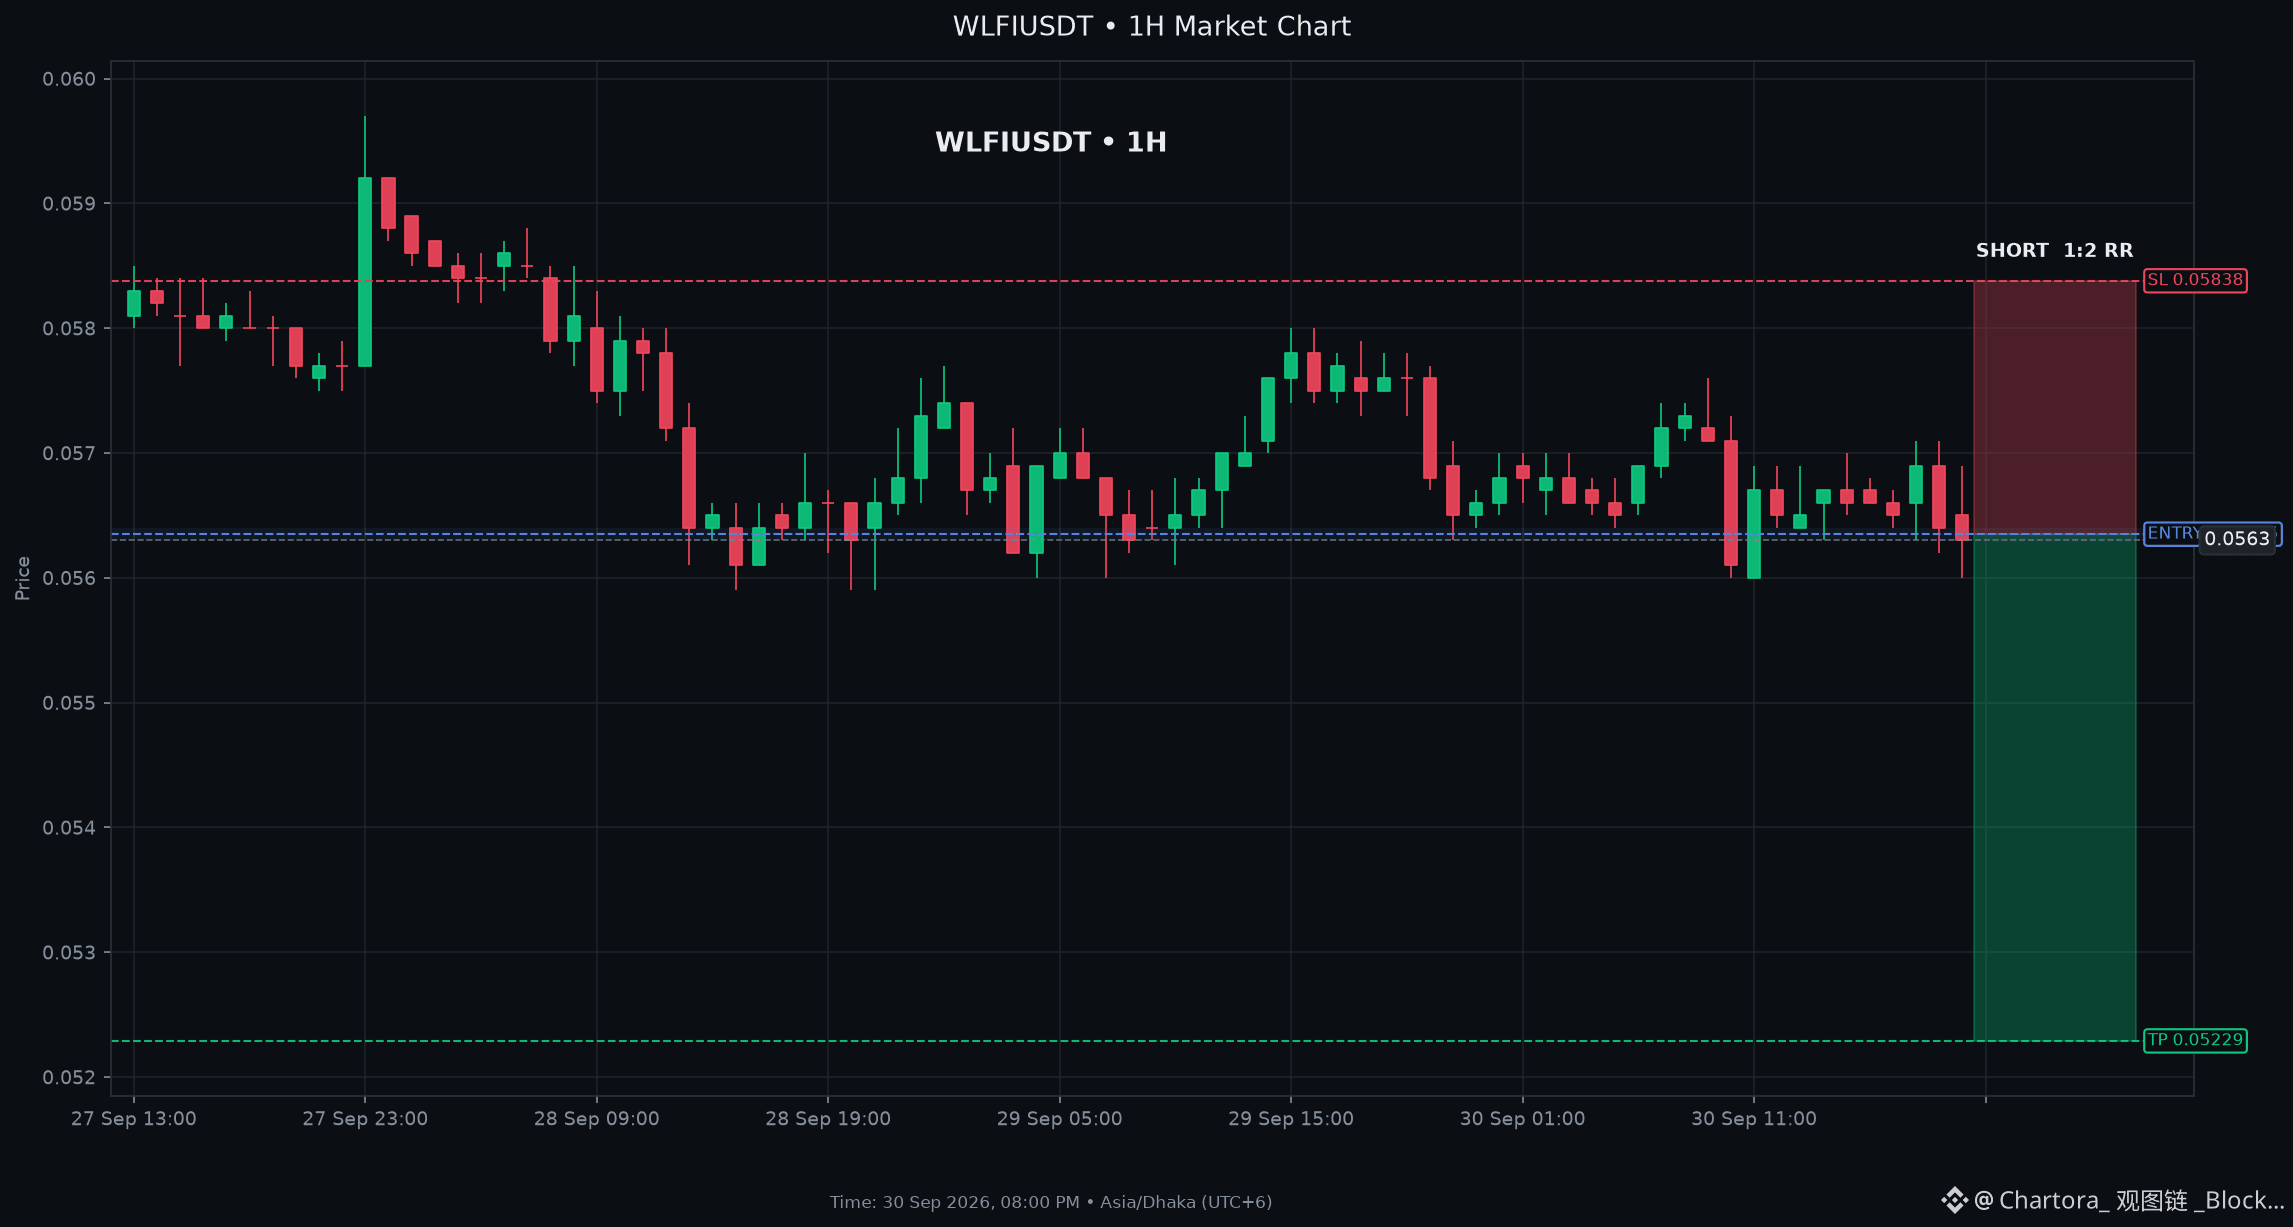
$WLFI: Open Interest Drops Rapidly: Long Squeeze Underway
SHORT SETUP WLFI
Entry: $0.05630 - $0.05640
Stop Loss: $0.05838
Take Profit: $0.05229 (2R)
Key Levels: Support $0.05630 | Resistance $0.05700
Technical Analysis for $WLFI: Price is anchored at the 1hour support of 0.0563 and sits below all EMA levels (EMA9 0.05656, EMA21 0.05668, EMA50 0.05689, EMA200 0.05719). MACD is negative with a shrinking histogram, while Stochastic K at 18.75 signals oversold conditions. RSI at 43.1 shows modest downside pressure and ADX at 18.3 indicates a weak trend. Orderbook data shows a slight askside imbalance.
Market Context: Bitcoin is in a bullish trend on both 4hour and daily timeframes, yet the overall crypto market is mixed, with 40.6 % of assets green and 59.4 % red.
#WLFI #ShortSetup #ChartAnalysis
SHORT $WLFI
$WLFI : Open Interest Drops Rapidly: Long Squeeze Underway
SHORT SETUP WLFI
Entry: $0.05630 - $0.05640
Stop Loss: $0.05838
Take Profit: $0.05229 (2R)
Key Levels: Support $0.05630 | Resistance $0.05700
Technical Analysis for $WLFI : Price is anchored at the 1hour support of 0.0563 and sits below all EMA levels (EMA9 0.05656, EMA21 0.05668, EMA50 0.05689, EMA200 0.05719). MACD is negative with a shrinking histogram, while Stochastic K at 18.75 signals oversold conditions. RSI at 43.1 shows modest downside pressure and ADX at 18.3 indicates a weak trend. Orderbook data shows a slight askside imbalance.
Market Context: Bitcoin is in a bullish trend on both 4hour and daily timeframes, yet the overall crypto market is mixed, with 40.6 % of assets green and 59.4 % red.
#WLFI #ShortSetup #ChartAnalysis
SHORT $WLFI
SHORT SETUP WLFI
Entry: $0.05630 - $0.05640
Stop Loss: $0.05838
Take Profit: $0.05229 (2R)
Key Levels: Support $0.05630 | Resistance $0.05700
Technical Analysis for $WLFI : Price is anchored at the 1hour support of 0.0563 and sits below all EMA levels (EMA9 0.05656, EMA21 0.05668, EMA50 0.05689, EMA200 0.05719). MACD is negative with a shrinking histogram, while Stochastic K at 18.75 signals oversold conditions. RSI at 43.1 shows modest downside pressure and ADX at 18.3 indicates a weak trend. Orderbook data shows a slight askside imbalance.
Market Context: Bitcoin is in a bullish trend on both 4hour and daily timeframes, yet the overall crypto market is mixed, with 40.6 % of assets green and 59.4 % red.
#WLFI #ShortSetup #ChartAnalysis
SHORT $WLFI
15
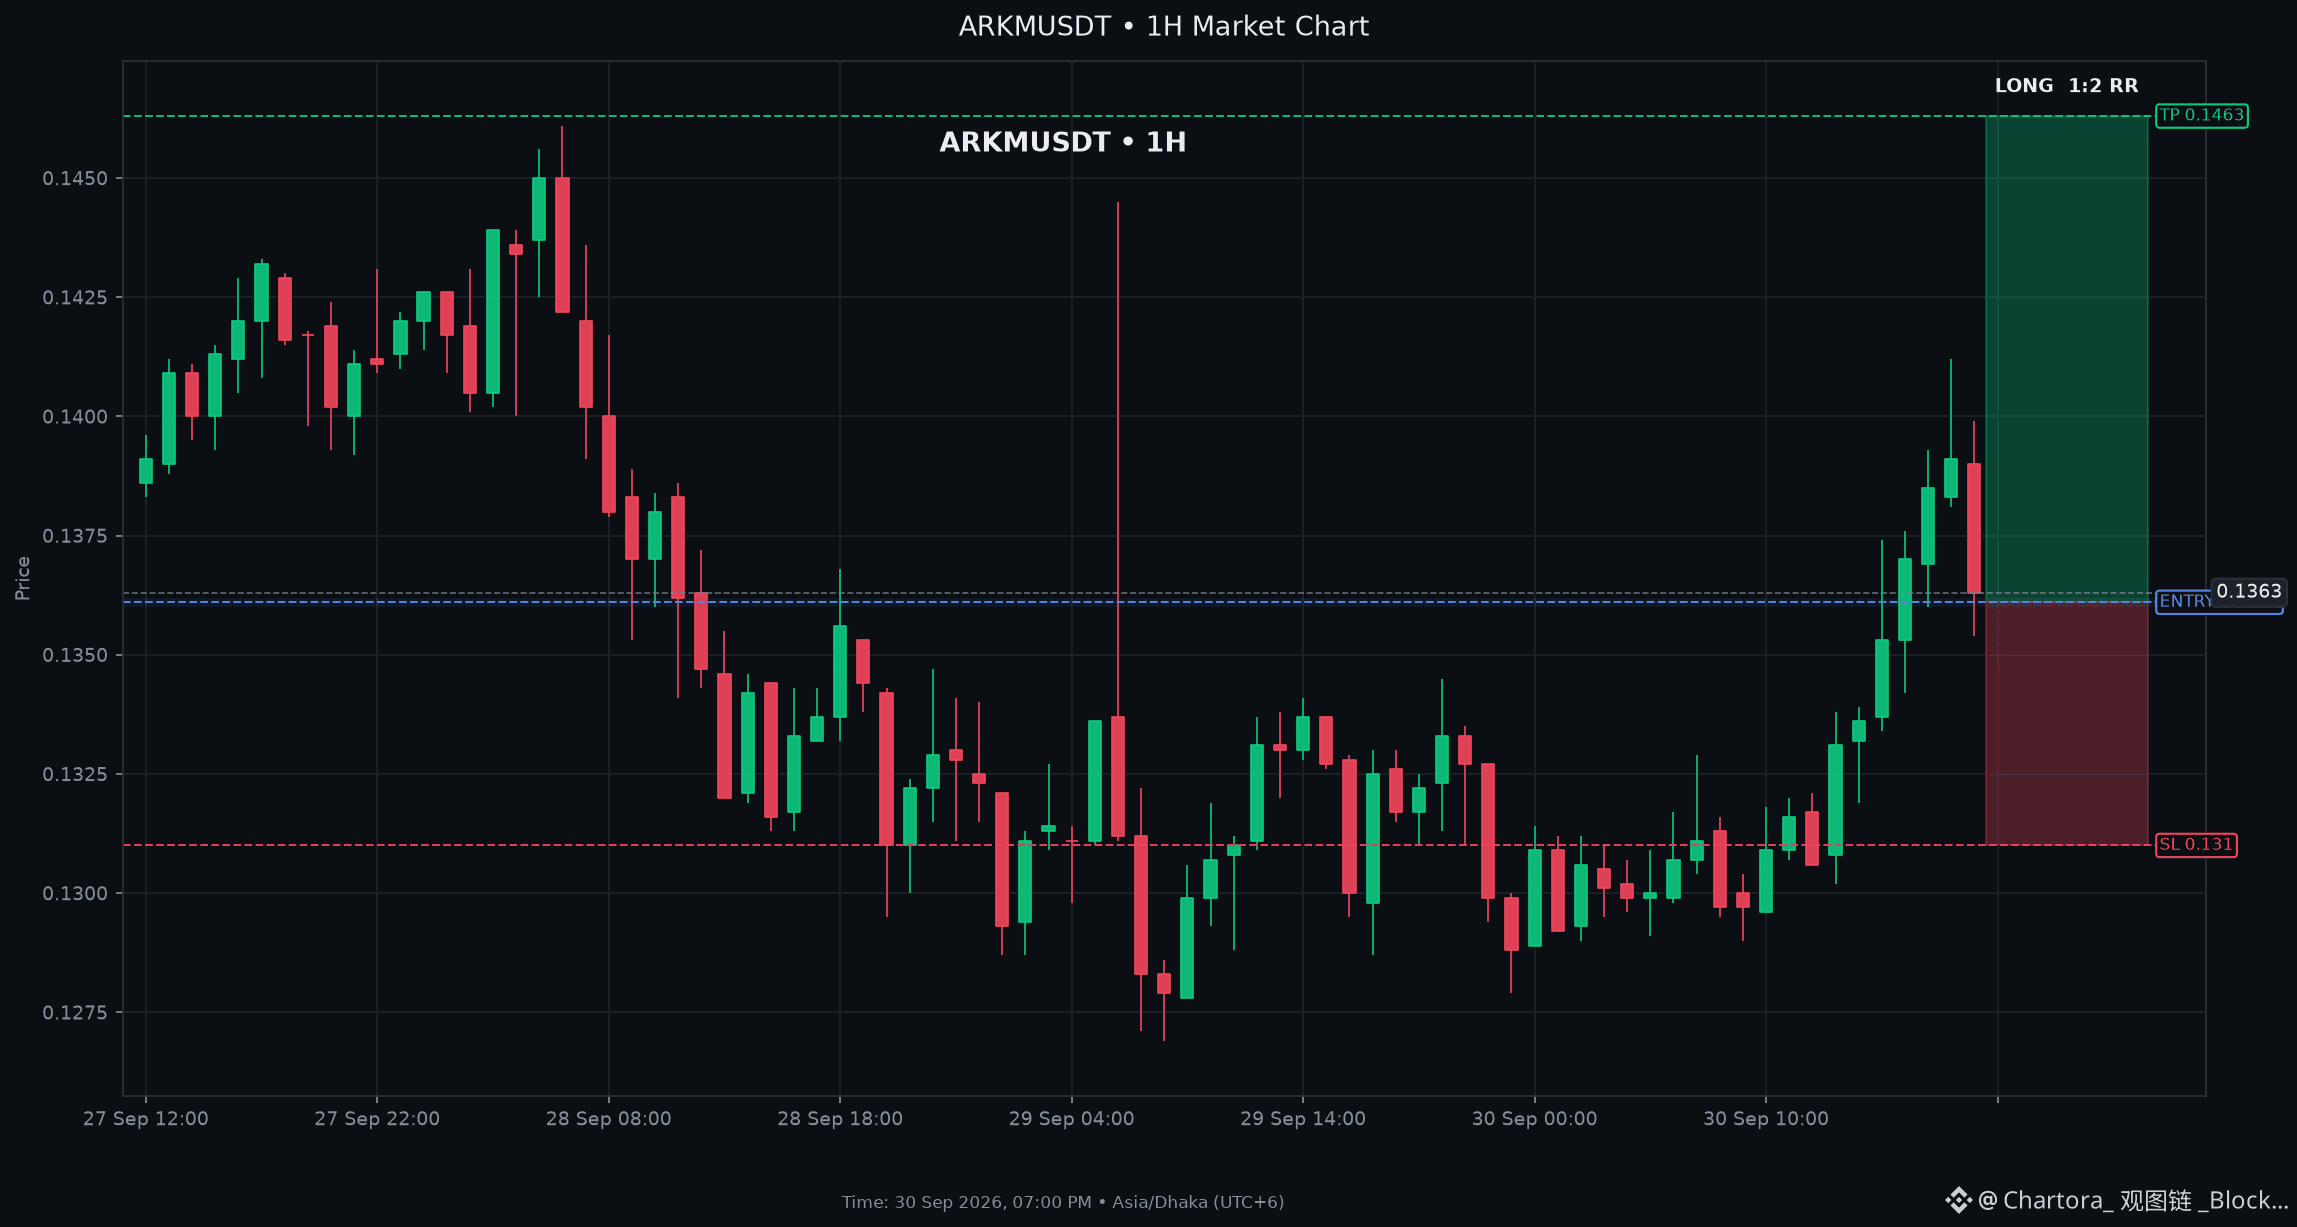
$ARKM: Smart Money Flow Increases into $ARKM Ahead of Catalysts
LONG SETUP ARKM
Entry: $0.13600 - $0.13620
Stop Loss: $0.13100
Take Profit: $0.14630 (2R)
Key Levels: Support $0.13130 | Resistance $0.13680
Technical Analysis for $ARKM: Price sits above the EMA9 (0.13548), EMA21 (0.13357), EMA50 (0.13319) and EMA200 (0.13048), confirming a bullish alignment. MACD is positive (0.0015) with a clear histogram (+0.00086) and the signal line below the MACD line, indicating upward momentum. RSI at 59.3 and Stochastic K around 60 suggest the asset is not yet overbought. Volume has surged over 270%, adding conviction. The 1hour swing range places support at 0.1313 and resistance at 0.1368, with the current price near the upper edge, offering a tight entry band.
Market Context: BTC is in a bullish trend on both 4hour and daily charts, supporting overall market optimism. The broader market shows a slight green bias (56.5% green vs 43.5% red).
#ARKM #LongSetup #ChartAnalysis
LONG $ARKM
$ARKM : Smart Money Flow Increases into $ARKM Ahead of Catalysts
LONG SETUP ARKM
Entry: $0.13600 - $0.13620
Stop Loss: $0.13100
Take Profit: $0.14630 (2R)
Key Levels: Support $0.13130 | Resistance $0.13680
Technical Analysis for $ARKM : Price sits above the EMA9 (0.13548), EMA21 (0.13357), EMA50 (0.13319) and EMA200 (0.13048), confirming a bullish alignment. MACD is positive (0.0015) with a clear histogram (+0.00086) and the signal line below the MACD line, indicating upward momentum. RSI at 59.3 and Stochastic K around 60 suggest the asset is not yet overbought. Volume has surged over 270%, adding conviction. The 1hour swing range places support at 0.1313 and resistance at 0.1368, with the current price near the upper edge, offering a tight entry band.
Market Context: BTC is in a bullish trend on both 4hour and daily charts, supporting overall market optimism. The broader market shows a slight green bias (56.5% green vs 43.5% red).
#ARKM #LongSetup #ChartAnalysis
LONG $ARKM
LONG SETUP ARKM
Entry: $0.13600 - $0.13620
Stop Loss: $0.13100
Take Profit: $0.14630 (2R)
Key Levels: Support $0.13130 | Resistance $0.13680
Technical Analysis for $ARKM : Price sits above the EMA9 (0.13548), EMA21 (0.13357), EMA50 (0.13319) and EMA200 (0.13048), confirming a bullish alignment. MACD is positive (0.0015) with a clear histogram (+0.00086) and the signal line below the MACD line, indicating upward momentum. RSI at 59.3 and Stochastic K around 60 suggest the asset is not yet overbought. Volume has surged over 270%, adding conviction. The 1hour swing range places support at 0.1313 and resistance at 0.1368, with the current price near the upper edge, offering a tight entry band.
Market Context: BTC is in a bullish trend on both 4hour and daily charts, supporting overall market optimism. The broader market shows a slight green bias (56.5% green vs 43.5% red).
#ARKM #LongSetup #ChartAnalysis
LONG $ARKM
27
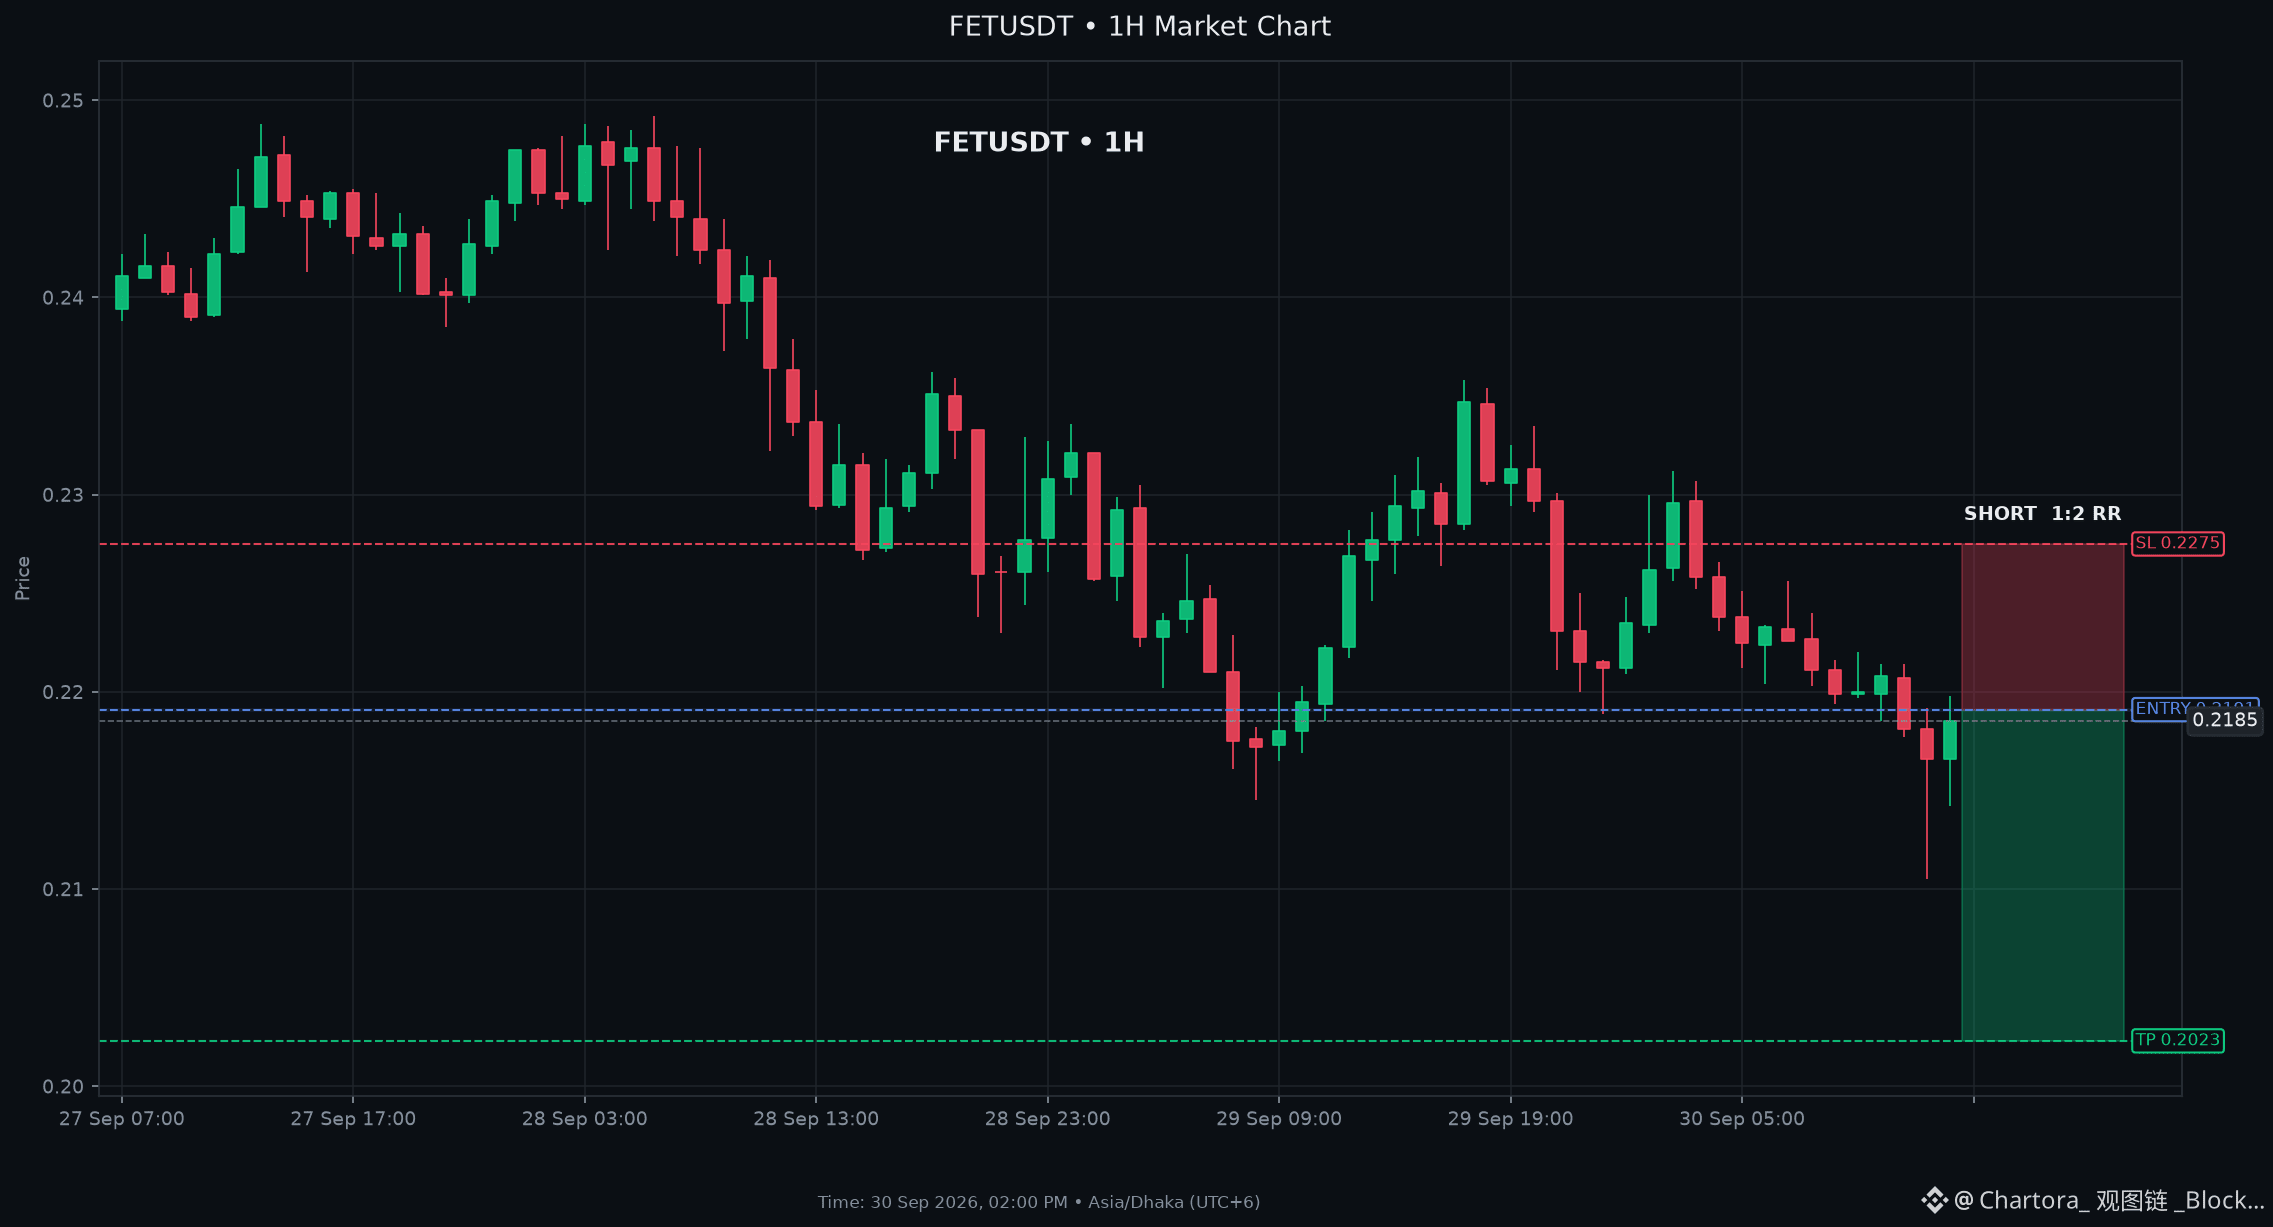
$FET: Moving Average Death Cross Signals Downward Trend for $FET
SHORT SETUP FET
Entry: $0.21900 - $0.21920
Stop Loss: $0.22750
Take Profit: $0.20230 (2R)
Key Levels: Support $0.21890 | Resistance $0.22560
Technical Analysis for $FET: Price is trading below EMA9 (0.21994), EMA21 (0.22234), EMA50 (0.22623) and EMA200 (0.22137), signalling bearish bias. MACD histogram is negative and RSI sits at 40.5, indicating weakening momentum. Stochastic K/D are under 50 (38.6/23.7). Orderbook shows a -24% imbalance (more sell pressure) with best ask at 0.22. The 1hour support at 0.2189 has been breached, reinforcing a short outlook.
Market Context: BTC is down 0.4% on the 24h chart, while overall market breadth remains broadly positive (65% green).
#FET #ShortSetup #ChartAnalysis
SHORT $FET
$FET : Moving Average Death Cross Signals Downward Trend for $FET
SHORT SETUP FET
Entry: $0.21900 - $0.21920
Stop Loss: $0.22750
Take Profit: $0.20230 (2R)
Key Levels: Support $0.21890 | Resistance $0.22560
Technical Analysis for $FET : Price is trading below EMA9 (0.21994), EMA21 (0.22234), EMA50 (0.22623) and EMA200 (0.22137), signalling bearish bias. MACD histogram is negative and RSI sits at 40.5, indicating weakening momentum. Stochastic K/D are under 50 (38.6/23.7). Orderbook shows a -24% imbalance (more sell pressure) with best ask at 0.22. The 1hour support at 0.2189 has been breached, reinforcing a short outlook.
Market Context: BTC is down 0.4% on the 24h chart, while overall market breadth remains broadly positive (65% green).
#FET #ShortSetup #ChartAnalysis
SHORT $FET
SHORT SETUP FET
Entry: $0.21900 - $0.21920
Stop Loss: $0.22750
Take Profit: $0.20230 (2R)
Key Levels: Support $0.21890 | Resistance $0.22560
Technical Analysis for $FET : Price is trading below EMA9 (0.21994), EMA21 (0.22234), EMA50 (0.22623) and EMA200 (0.22137), signalling bearish bias. MACD histogram is negative and RSI sits at 40.5, indicating weakening momentum. Stochastic K/D are under 50 (38.6/23.7). Orderbook shows a -24% imbalance (more sell pressure) with best ask at 0.22. The 1hour support at 0.2189 has been breached, reinforcing a short outlook.
Market Context: BTC is down 0.4% on the 24h chart, while overall market breadth remains broadly positive (65% green).
#FET #ShortSetup #ChartAnalysis
SHORT $FET
15
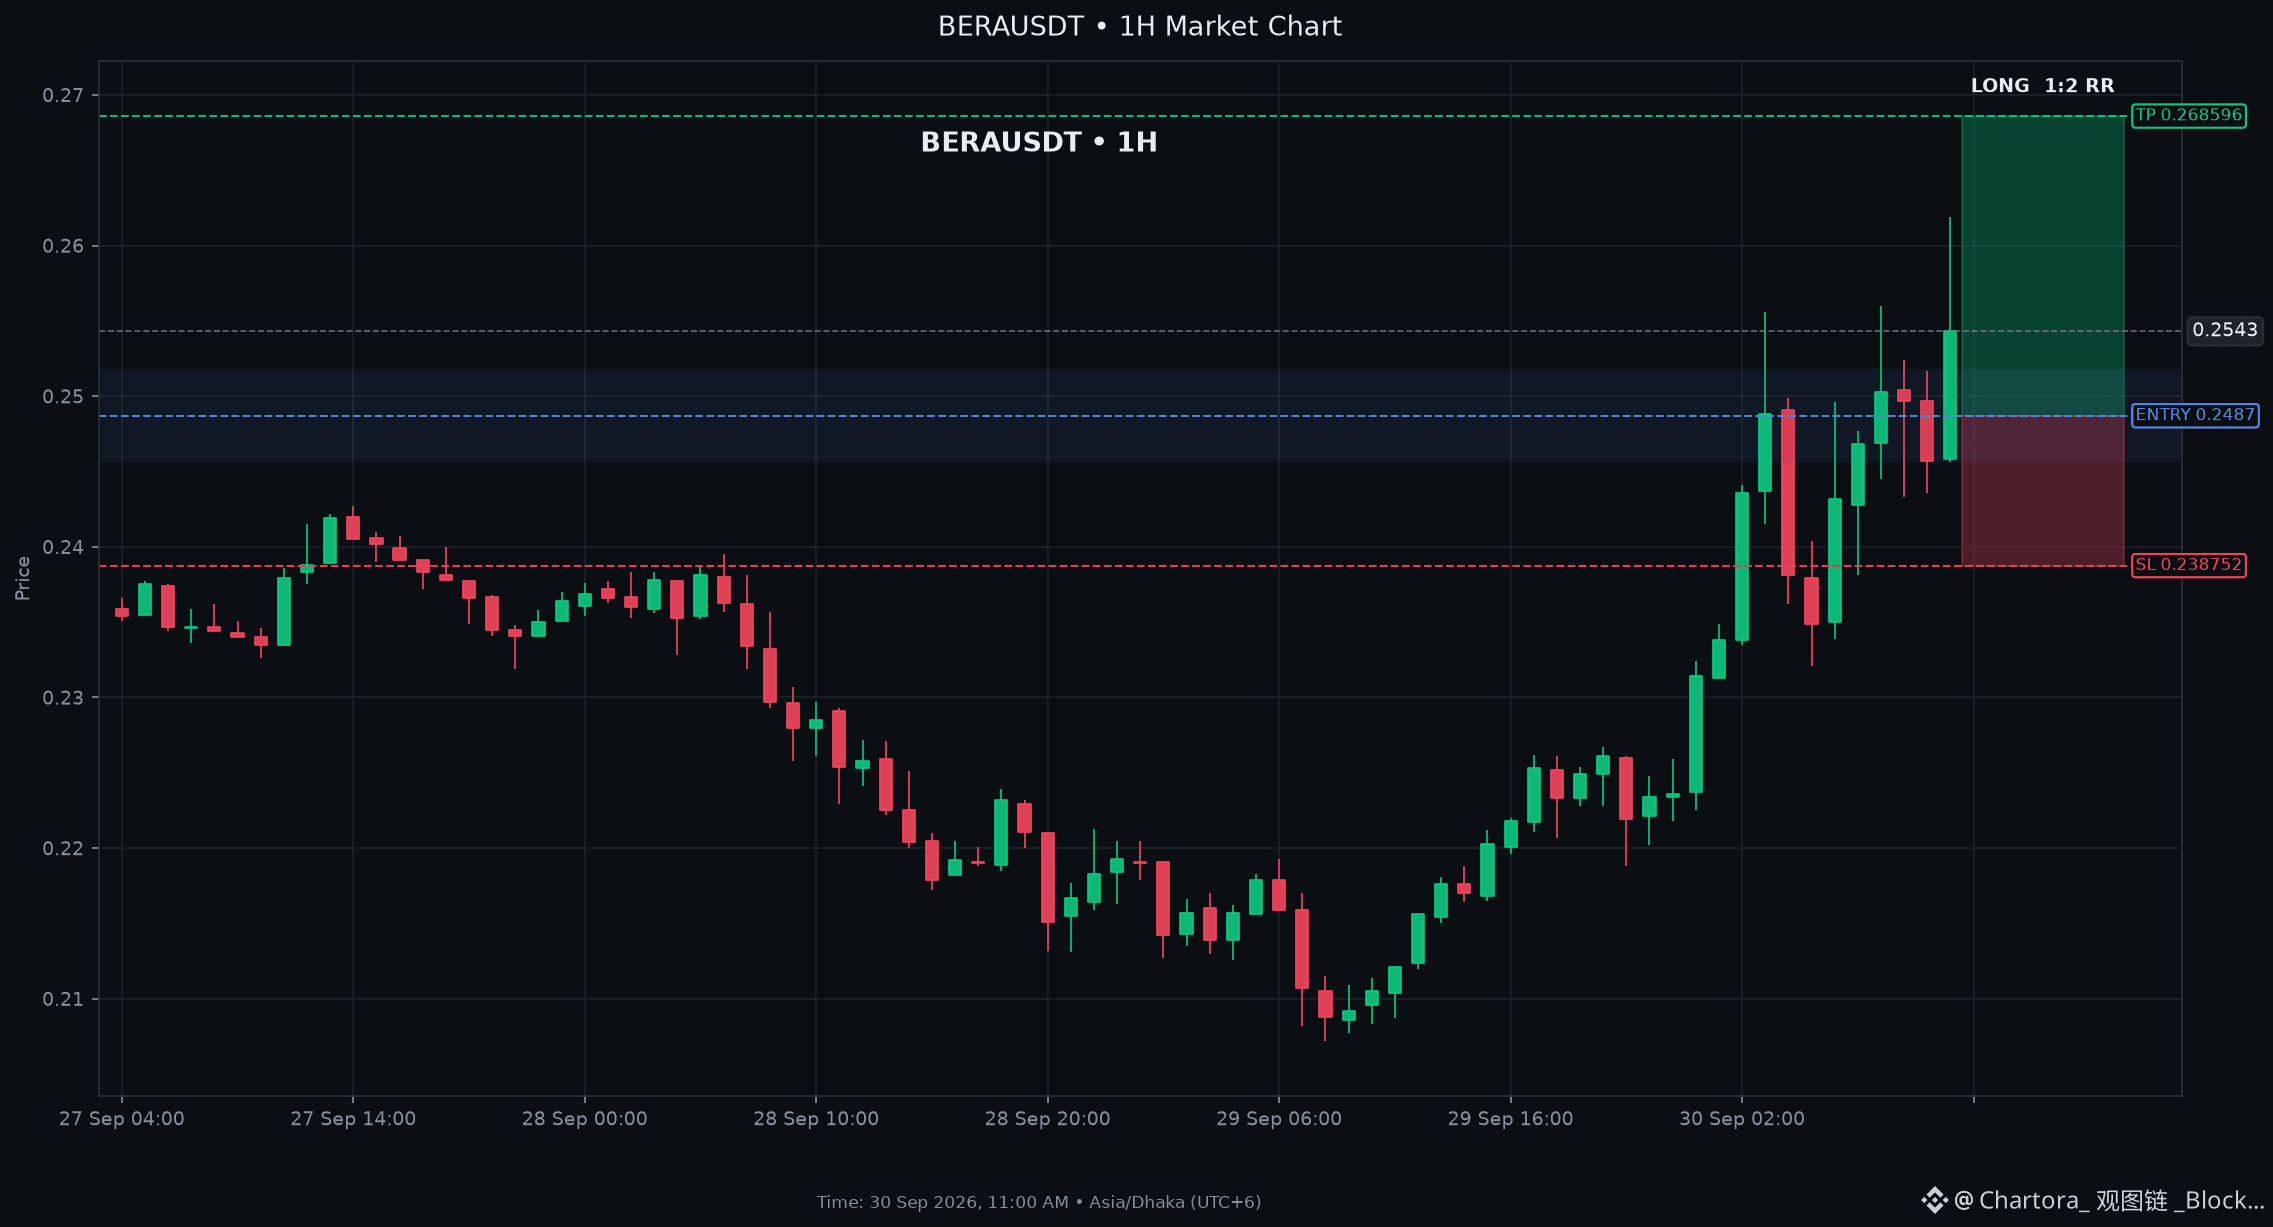
$BERA: Critical Resistance Test: $BERA Preparing to Surge Higher
LONG SETUP BERA
Entry: $0.24560 - $0.25180
Stop Loss: $0.23875
Take Profit: $0.26860 (2R)
Key Levels: Support $0.23280 | Resistance $0.25560
Technical Analysis for $BERA: Price (0.2543) sits above EMA9 (0.2454), EMA21 (0.2373), EMA50 (0.2308) and EMA200 (0.2258), confirming bullish bias. MACD line (0.00778) is above its signal (0.00610) with a positive histogram, while ADX at 38.7 signals a strong trend. Volume surged 85% and orderbook shows a 29% bidside imbalance, adding buying pressure. RSI is 68.5 and Stochastic K/D are above 80, indicating nearoverbought conditions but not yet a clear reversal.
Market Context: BTC is down 0.92% on the 24h, showing bearish pressure, while the broader market is mixed with 59.2% green assets. The bullish setup for BERAUSDT stands despite the overall crypto dip.
#BERA #LongSetup #ChartAnalysis
LONG $BERA
$BERA : Critical Resistance Test: $BERA Preparing to Surge Higher
LONG SETUP BERA
Entry: $0.24560 - $0.25180
Stop Loss: $0.23875
Take Profit: $0.26860 (2R)
Key Levels: Support $0.23280 | Resistance $0.25560
Technical Analysis for $BERA : Price (0.2543) sits above EMA9 (0.2454), EMA21 (0.2373), EMA50 (0.2308) and EMA200 (0.2258), confirming bullish bias. MACD line (0.00778) is above its signal (0.00610) with a positive histogram, while ADX at 38.7 signals a strong trend. Volume surged 85% and orderbook shows a 29% bidside imbalance, adding buying pressure. RSI is 68.5 and Stochastic K/D are above 80, indicating nearoverbought conditions but not yet a clear reversal.
Market Context: BTC is down 0.92% on the 24h, showing bearish pressure, while the broader market is mixed with 59.2% green assets. The bullish setup for BERAUSDT stands despite the overall crypto dip.
#BERA #LongSetup #ChartAnalysis
LONG $BERA
LONG SETUP BERA
Entry: $0.24560 - $0.25180
Stop Loss: $0.23875
Take Profit: $0.26860 (2R)
Key Levels: Support $0.23280 | Resistance $0.25560
Technical Analysis for $BERA : Price (0.2543) sits above EMA9 (0.2454), EMA21 (0.2373), EMA50 (0.2308) and EMA200 (0.2258), confirming bullish bias. MACD line (0.00778) is above its signal (0.00610) with a positive histogram, while ADX at 38.7 signals a strong trend. Volume surged 85% and orderbook shows a 29% bidside imbalance, adding buying pressure. RSI is 68.5 and Stochastic K/D are above 80, indicating nearoverbought conditions but not yet a clear reversal.
Market Context: BTC is down 0.92% on the 24h, showing bearish pressure, while the broader market is mixed with 59.2% green assets. The bullish setup for BERAUSDT stands despite the overall crypto dip.
#BERA #LongSetup #ChartAnalysis
LONG $BERA
24
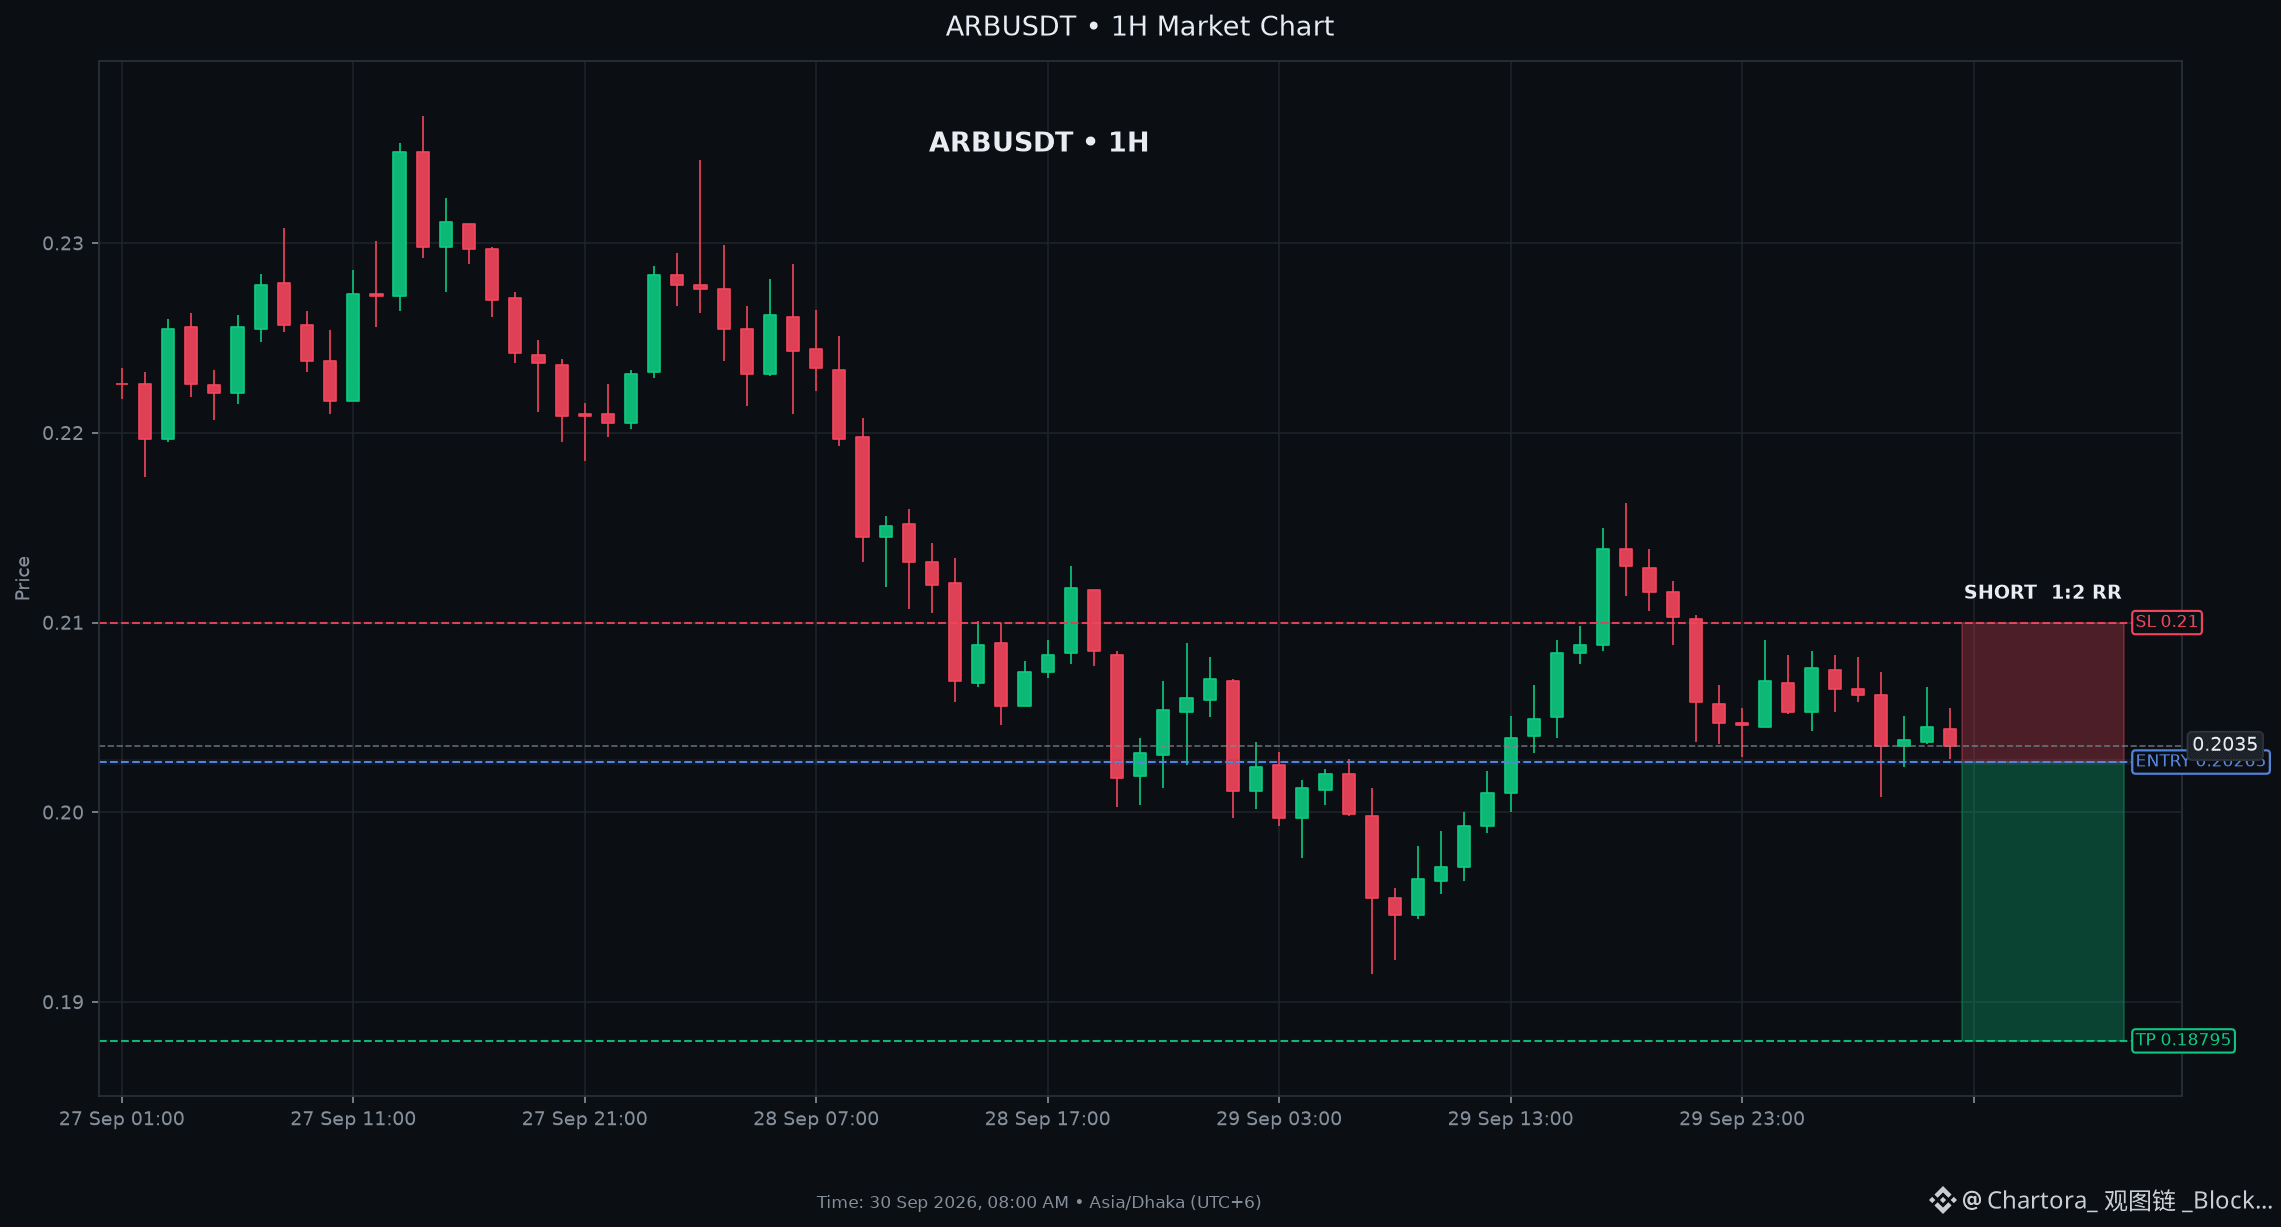
$ARB: Panic Selling Risk Increases as $ARB Tests Critical Floor
SHORT SETUP ARB
Entry: $0.20250 - $0.20280
Stop Loss: $0.21000
Take Profit: $0.18795 (2R)
Key Levels: Support $0.20080 | Resistance $0.20280
Technical Analysis for $ARB: ARBUSDT is trading below all key EMAs (9, 21, 50, 200) and the MACD histogram remains negative, indicating bearish momentum. RSI sits near 45 and the stochastic is in the oversold zone (K20), but the price is still above the 1hour resistance (0.2028). The 1hour swing structure shows a clear high at ~0.2035 and a lower support at 0.2008, suggesting a shortbiased pullback. Orderbook data shows a bidside imbalance, but the prevailing technical picture favors a downside move.
Market Context: The broader market is broadly positive (74.8% green) and BTC is in a bullish daily trend, yet ARB remains in a downtrend relative to its moving averages. This backdrop supports a short trade targeting a pullback toward the 0.2008 support level.
#ARB #ShortSetup #ChartAnalysis
SHORT $ARB
$ARB : Panic Selling Risk Increases as $ARB Tests Critical Floor
SHORT SETUP ARB
Entry: $0.20250 - $0.20280
Stop Loss: $0.21000
Take Profit: $0.18795 (2R)
Key Levels: Support $0.20080 | Resistance $0.20280
Technical Analysis for $ARB : ARBUSDT is trading below all key EMAs (9, 21, 50, 200) and the MACD histogram remains negative, indicating bearish momentum. RSI sits near 45 and the stochastic is in the oversold zone (K20), but the price is still above the 1hour resistance (0.2028). The 1hour swing structure shows a clear high at ~0.2035 and a lower support at 0.2008, suggesting a shortbiased pullback. Orderbook data shows a bidside imbalance, but the prevailing technical picture favors a downside move.
Market Context: The broader market is broadly positive (74.8% green) and BTC is in a bullish daily trend, yet ARB remains in a downtrend relative to its moving averages. This backdrop supports a short trade targeting a pullback toward the 0.2008 support level.
#ARB #ShortSetup #ChartAnalysis
SHORT $ARB
SHORT SETUP ARB
Entry: $0.20250 - $0.20280
Stop Loss: $0.21000
Take Profit: $0.18795 (2R)
Key Levels: Support $0.20080 | Resistance $0.20280
Technical Analysis for $ARB : ARBUSDT is trading below all key EMAs (9, 21, 50, 200) and the MACD histogram remains negative, indicating bearish momentum. RSI sits near 45 and the stochastic is in the oversold zone (K20), but the price is still above the 1hour resistance (0.2028). The 1hour swing structure shows a clear high at ~0.2035 and a lower support at 0.2008, suggesting a shortbiased pullback. Orderbook data shows a bidside imbalance, but the prevailing technical picture favors a downside move.
Market Context: The broader market is broadly positive (74.8% green) and BTC is in a bullish daily trend, yet ARB remains in a downtrend relative to its moving averages. This backdrop supports a short trade targeting a pullback toward the 0.2008 support level.
#ARB #ShortSetup #ChartAnalysis
SHORT $ARB
26
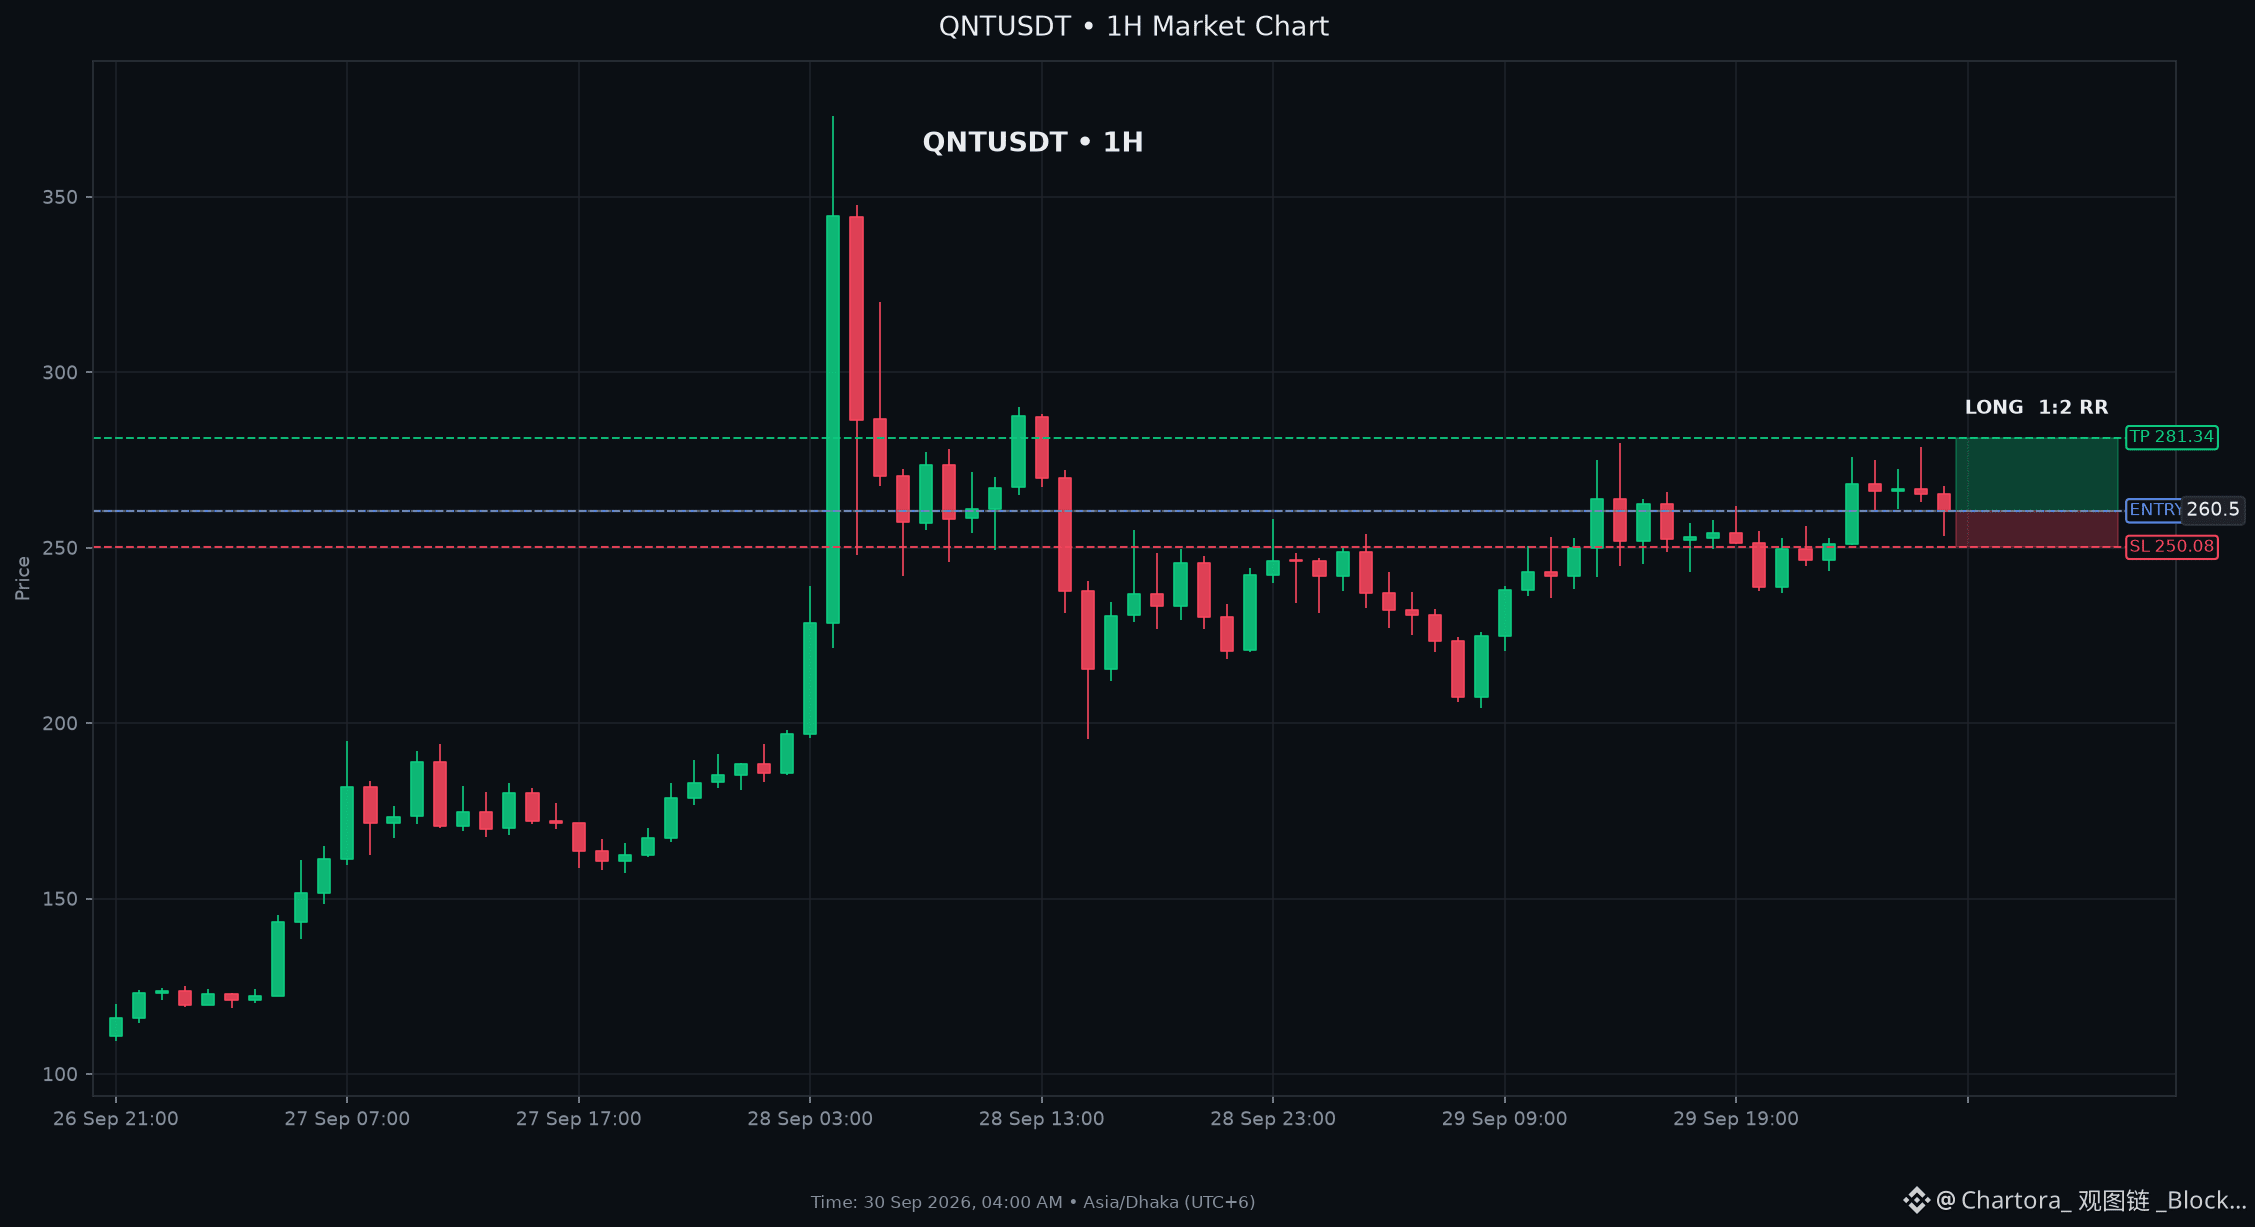
$QNT: Bullish Momentum Accelerates as $QNT Liquidity Sweep Completes
LONG SETUP QNT
Entry: $259.849 - $261.151
Stop Loss: $250.080
Take Profit: $281.340 (2R)
Key Levels: Support $243.000 | Resistance $275.930
Technical Analysis for $QNT: $QNT fallback technical analysis: RSI is 55.4, showing bullish momentum without being deeply overbought, price is holding above the 21 EMA, supporting the bullish bias, MACD is above its signal line, confirming positive momentum, volume is contracting by 27.2%, and price is above the 50 EMA, keeping the short-term structure constructive. Together, these signals support a conditional LONG continuation setup. Buyers still need to defend the entry zone and follow through toward resistance.
#QNT #LongSetup #ChartAnalysis
LONG $QNT
$QNT : Bullish Momentum Accelerates as $QNT Liquidity Sweep Completes
LONG SETUP QNT
Entry: $259.849 - $261.151
Stop Loss: $250.080
Take Profit: $281.340 (2R)
Key Levels: Support $243.000 | Resistance $275.930
Technical Analysis for $QNT : $QNT fallback technical analysis: RSI is 55.4, showing bullish momentum without being deeply overbought, price is holding above the 21 EMA, supporting the bullish bias, MACD is above its signal line, confirming positive momentum, volume is contracting by 27.2%, and price is above the 50 EMA, keeping the short-term structure constructive. Together, these signals support a conditional LONG continuation setup. Buyers still need to defend the entry zone and follow through toward resistance.
#QNT #LongSetup #ChartAnalysis
LONG $QNT
LONG SETUP QNT
Entry: $259.849 - $261.151
Stop Loss: $250.080
Take Profit: $281.340 (2R)
Key Levels: Support $243.000 | Resistance $275.930
Technical Analysis for $QNT : $QNT fallback technical analysis: RSI is 55.4, showing bullish momentum without being deeply overbought, price is holding above the 21 EMA, supporting the bullish bias, MACD is above its signal line, confirming positive momentum, volume is contracting by 27.2%, and price is above the 50 EMA, keeping the short-term structure constructive. Together, these signals support a conditional LONG continuation setup. Buyers still need to defend the entry zone and follow through toward resistance.
#QNT #LongSetup #ChartAnalysis
LONG $QNT
93
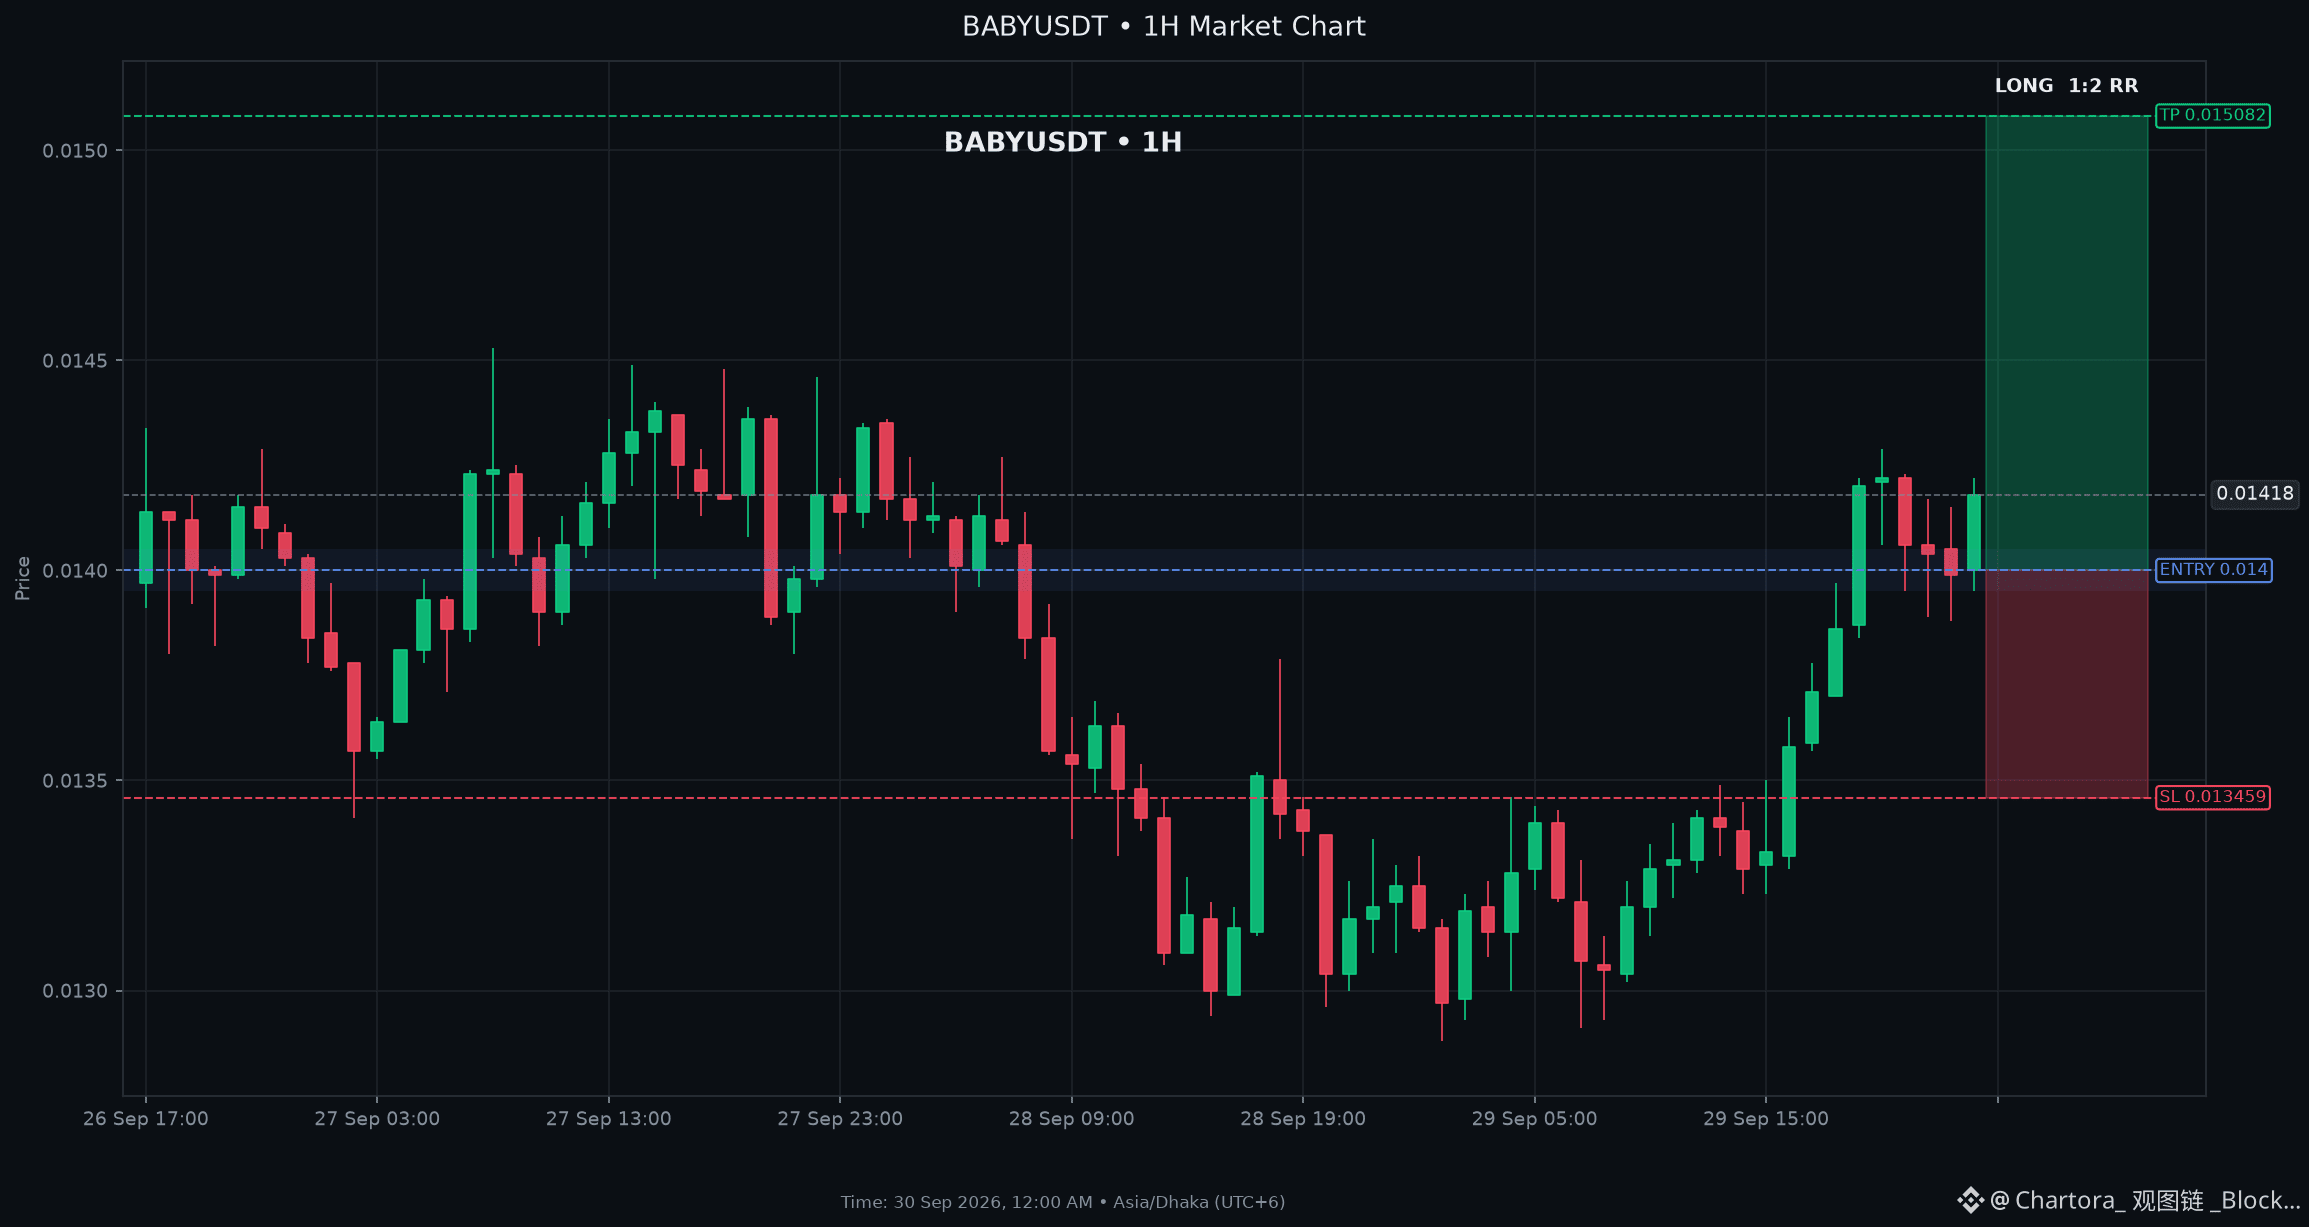
$BABY: Bullish Divergence Flashed on $BABY Daily Chart Structure
LONG SETUP BABY
Entry: $0.01395 - $0.01405
Stop Loss: $0.01346
Take Profit: $0.01508 (2R)
Key Levels: Support $0.01390 | Resistance $0.01427
Technical Analysis for $BABY: Price sits above all EMA levels (92150200) and the MACD histogram is positive, indicating bullish momentum. RSI at 66 shows strength without being overbought, while Stochastic %K is near 90, suggesting a possible shortterm pullback to the 1H/4H support zone around 0.0139. Orderbook imbalance (+5.6% bid pressure) adds a slight bullish bias.
Market Context: BTC is in a bullish daily trend and the broader market is broadly positive (68.7% green). This supportive backdrop aligns with a cautious long bias on BABYUSDT.
#BABY #LongSetup #ChartAnalysis
LONG $BABY
$BABY : Bullish Divergence Flashed on $BABY Daily Chart Structure
LONG SETUP BABY
Entry: $0.01395 - $0.01405
Stop Loss: $0.01346
Take Profit: $0.01508 (2R)
Key Levels: Support $0.01390 | Resistance $0.01427
Technical Analysis for $BABY : Price sits above all EMA levels (92150200) and the MACD histogram is positive, indicating bullish momentum. RSI at 66 shows strength without being overbought, while Stochastic %K is near 90, suggesting a possible shortterm pullback to the 1H/4H support zone around 0.0139. Orderbook imbalance (+5.6% bid pressure) adds a slight bullish bias.
Market Context: BTC is in a bullish daily trend and the broader market is broadly positive (68.7% green). This supportive backdrop aligns with a cautious long bias on BABYUSDT.
#BABY #LongSetup #ChartAnalysis
LONG $BABY
LONG SETUP BABY
Entry: $0.01395 - $0.01405
Stop Loss: $0.01346
Take Profit: $0.01508 (2R)
Key Levels: Support $0.01390 | Resistance $0.01427
Technical Analysis for $BABY : Price sits above all EMA levels (92150200) and the MACD histogram is positive, indicating bullish momentum. RSI at 66 shows strength without being overbought, while Stochastic %K is near 90, suggesting a possible shortterm pullback to the 1H/4H support zone around 0.0139. Orderbook imbalance (+5.6% bid pressure) adds a slight bullish bias.
Market Context: BTC is in a bullish daily trend and the broader market is broadly positive (68.7% green). This supportive backdrop aligns with a cautious long bias on BABYUSDT.
#BABY #LongSetup #ChartAnalysis
LONG $BABY
7
Connectez-vous pour découvrir plus de contenu
Rejoignez la communauté mondiale des adeptes de cryptomonnaies sur Binance Square
⚡️ Suviez les dernières informations importantes sur les cryptomonnaies.
💬 Jugé digne de confiance par la plus grande plateforme d’échange de cryptomonnaies au monde.
👍 Découvrez les connaissances que partagent les créateurs vérifiés.
Adresse e-mail/Nº de téléphone
Sujets d’actualité
1
#G7PlansToReleaseUpTo100MBarrelsOilDiesel
0 vues
5 mentions
2
#ICBASuesOCCOverCryptoBankCharters
0 vues
5 mentions
3
#USStocksCloseHigherOnWeakJobsData
15 vues
6 mentions
4
#NFPWatch
10.9M vues
19,411 mentions
5
#BlastToGraduallyShutDownItsL2Network
0 vues
1 mentions
6
#BitcoinFundingRateTriplesTo10%
188,774 vues
1,296 mentions
7
#BitcoinSurpasses$86KUp2.99%
62,380 vues
120 mentions
8
#ZcashFalls21%FromSeptemberPeak
99,780 vues
903 mentions
9
#USSeptemberPayrollsAdd29KUnemploymentRises4.2%
78,459 vues
556 mentions
10
#XRPPostsFirstThreeGreenMonthsInQ3
68,457 vues
751 mentions