
NEWS OF CRIPTO
4 Publicaciones

NEWS OF CRIPTO
Denunciar
Bloquear usuario
Exploring the decentralized landscape. Unlocking possibilities, redefining ownership
Abrir operación
7.1 meses
0 Siguiendo
0 Seguidores
3 Me gusta
Publicaciones
Cartera
$SOL
{spot}(SOLUSDT)
$ETH
{spot}(ETHUSDT)
$USDC
{spot}(USDCUSDT)
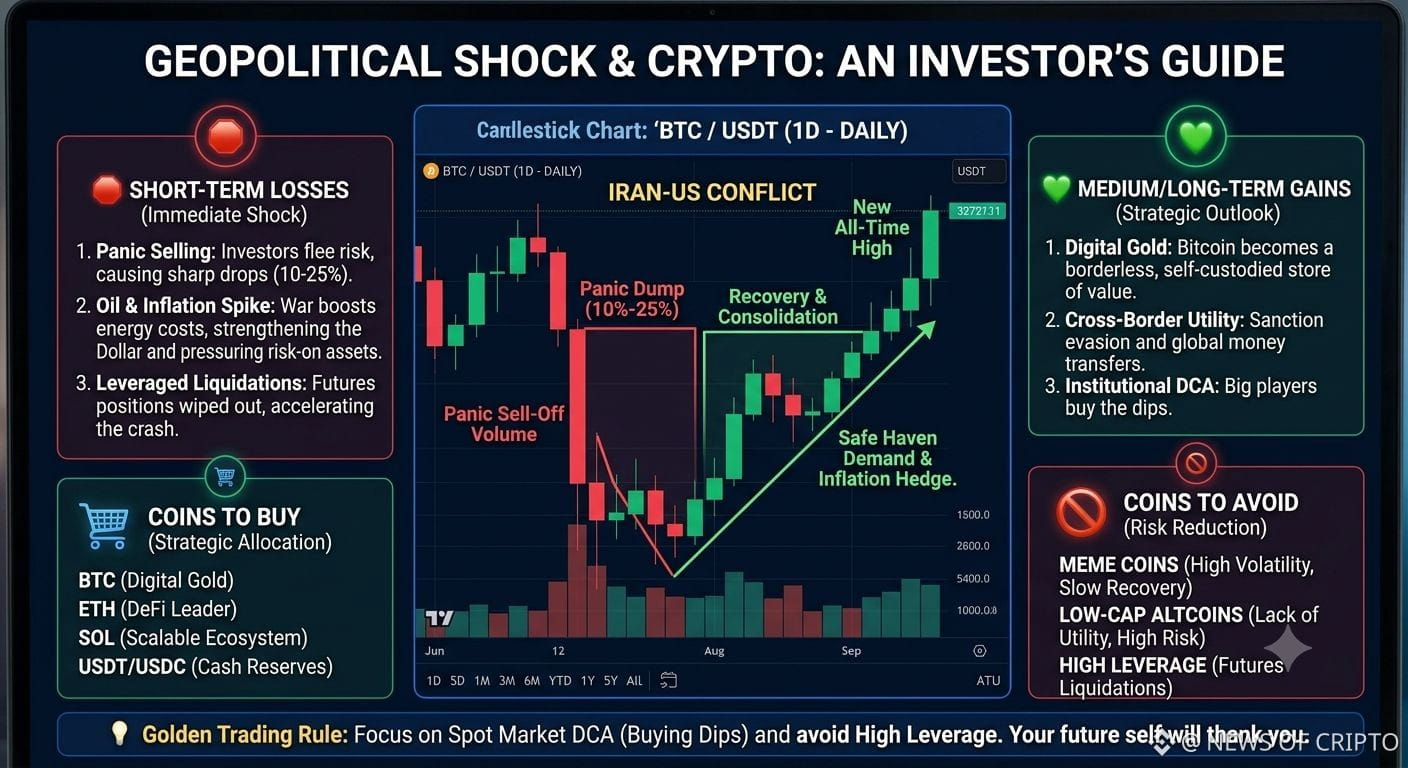
Corto Plazo (Pérdidas): Las noticias de guerra desencadenan pánico y ventas inmediatas, hacen subir los precios del petróleo crudo y provocan liquidaciones en cascada en posiciones de futuros con alto apalancamiento.
Largo Plazo (Ganancias): La depreciación de la moneda (impresión de dinero) y la demanda de "Oro Digital" históricamente han llevado a fuertes recuperaciones del mercado y grandes alzas de precios, especialmente para Bitcoin.
🛒 Monedas para Comprar (Acumular en Caídas)
Durante caídas del mercado por crisis geopolíticas, ciñete estrictamente a activos sólidos y de alta convicción, fundamentales:
Categoría de la Moneda / MotivoEstrategiaBitcoin (BTC)Oro Digital – El activo más seguro; lidera las recuperaciones del mercado.DCA (Promedio de Coste en Dólares) en grandes caídasEthereum (ETH)Líder DeFi – Infraestructura central del ecosistema cripto.Acumula gradualmente durante caídas del mercadoSolana (SOL)Capa 1 de Alto Beta – Red rápida con alta liquidez; rebota con fuerza ideal para crecimiento de capital a mediano plazoUSDT / USDCReservas en Efectivo – Mantiene la liquidez lista ante caídas repentinas del mercado.Mantén 20%–30% de la cartera en stablecoins
🚫 Monedas para Vender / Evitar
Monedas Meme (PEPE, BONK, SHIB, etc.): Altamente especulativas; pueden desplomarse 50%–80% durante un pánico geopolítico. Asegura ganancias o corta pérdidas temprano.
Altcoins de baja capitalización / débiles: Tokens sin utilidad real o sin respaldo sólido corren el riesgo de no recuperarse nunca de caídas severas.
Posiciones de Futuros con Alto Apalancamiento: Cierra posiciones largas de inmediato durante titulares activos de conflicto para evitar liquidaciones.
💡 Regla de Oro: Nunca vayas "All-In" de una sola vez ante la incertidumbre de la guerra. Divide tu capital en 3 a 4 partes y compra por fases durante caídas importantes del 10%–15% en el mercado spot solamente.
#cryptouniverseofficial #CRYPTONEEW
$SOL
$ETH
$USDC
Corto Plazo (Pérdidas): Las noticias de guerra desencadenan pánico y ventas inmediatas, hacen subir los precios del petróleo crudo y provocan liquidaciones en cascada en posiciones de futuros con alto apalancamiento.
Largo Plazo (Ganancias): La depreciación de la moneda (impresión de dinero) y la demanda de "Oro Digital" históricamente han llevado a fuertes recuperaciones del mercado y grandes alzas de precios, especialmente para Bitcoin.
🛒 Monedas para Comprar (Acumular en Caídas)
Durante caídas del mercado por crisis geopolíticas, ciñete estrictamente a activos sólidos y de alta convicción, fundamentales:
Categoría de la Moneda / MotivoEstrategiaBitcoin (BTC)Oro Digital – El activo más seguro; lidera las recuperaciones del mercado.DCA (Promedio de Coste en Dólares) en grandes caídasEthereum (ETH)Líder DeFi – Infraestructura central del ecosistema cripto.Acumula gradualmente durante caídas del mercadoSolana (SOL)Capa 1 de Alto Beta – Red rápida con alta liquidez; rebota con fuerza ideal para crecimiento de capital a mediano plazoUSDT / USDCReservas en Efectivo – Mantiene la liquidez lista ante caídas repentinas del mercado.Mantén 20%–30% de la cartera en stablecoins
🚫 Monedas para Vender / Evitar
Monedas Meme (PEPE, BONK, SHIB, etc.): Altamente especulativas; pueden desplomarse 50%–80% durante un pánico geopolítico. Asegura ganancias o corta pérdidas temprano.
Altcoins de baja capitalización / débiles: Tokens sin utilidad real o sin respaldo sólido corren el riesgo de no recuperarse nunca de caídas severas.
Posiciones de Futuros con Alto Apalancamiento: Cierra posiciones largas de inmediato durante titulares activos de conflicto para evitar liquidaciones.
💡 Regla de Oro: Nunca vayas "All-In" de una sola vez ante la incertidumbre de la guerra. Divide tu capital en 3 a 4 partes y compra por fases durante caídas importantes del 10%–15% en el mercado spot solamente.
#cryptouniverseofficial #CRYPTONEEW
$ETH
$USDC
Corto Plazo (Pérdidas): Las noticias de guerra desencadenan pánico y ventas inmediatas, hacen subir los precios del petróleo crudo y provocan liquidaciones en cascada en posiciones de futuros con alto apalancamiento.
Largo Plazo (Ganancias): La depreciación de la moneda (impresión de dinero) y la demanda de "Oro Digital" históricamente han llevado a fuertes recuperaciones del mercado y grandes alzas de precios, especialmente para Bitcoin.
🛒 Monedas para Comprar (Acumular en Caídas)
Durante caídas del mercado por crisis geopolíticas, ciñete estrictamente a activos sólidos y de alta convicción, fundamentales:
Categoría de la Moneda / MotivoEstrategiaBitcoin (BTC)Oro Digital – El activo más seguro; lidera las recuperaciones del mercado.DCA (Promedio de Coste en Dólares) en grandes caídasEthereum (ETH)Líder DeFi – Infraestructura central del ecosistema cripto.Acumula gradualmente durante caídas del mercadoSolana (SOL)Capa 1 de Alto Beta – Red rápida con alta liquidez; rebota con fuerza ideal para crecimiento de capital a mediano plazoUSDT / USDCReservas en Efectivo – Mantiene la liquidez lista ante caídas repentinas del mercado.Mantén 20%–30% de la cartera en stablecoins
🚫 Monedas para Vender / Evitar
Monedas Meme (PEPE, BONK, SHIB, etc.): Altamente especulativas; pueden desplomarse 50%–80% durante un pánico geopolítico. Asegura ganancias o corta pérdidas temprano.
Altcoins de baja capitalización / débiles: Tokens sin utilidad real o sin respaldo sólido corren el riesgo de no recuperarse nunca de caídas severas.
Posiciones de Futuros con Alto Apalancamiento: Cierra posiciones largas de inmediato durante titulares activos de conflicto para evitar liquidaciones.
💡 Regla de Oro: Nunca vayas "All-In" de una sola vez ante la incertidumbre de la guerra. Divide tu capital en 3 a 4 partes y compra por fases durante caídas importantes del 10%–15% en el mercado spot solamente.
#cryptouniverseofficial #CRYPTONEEW
105
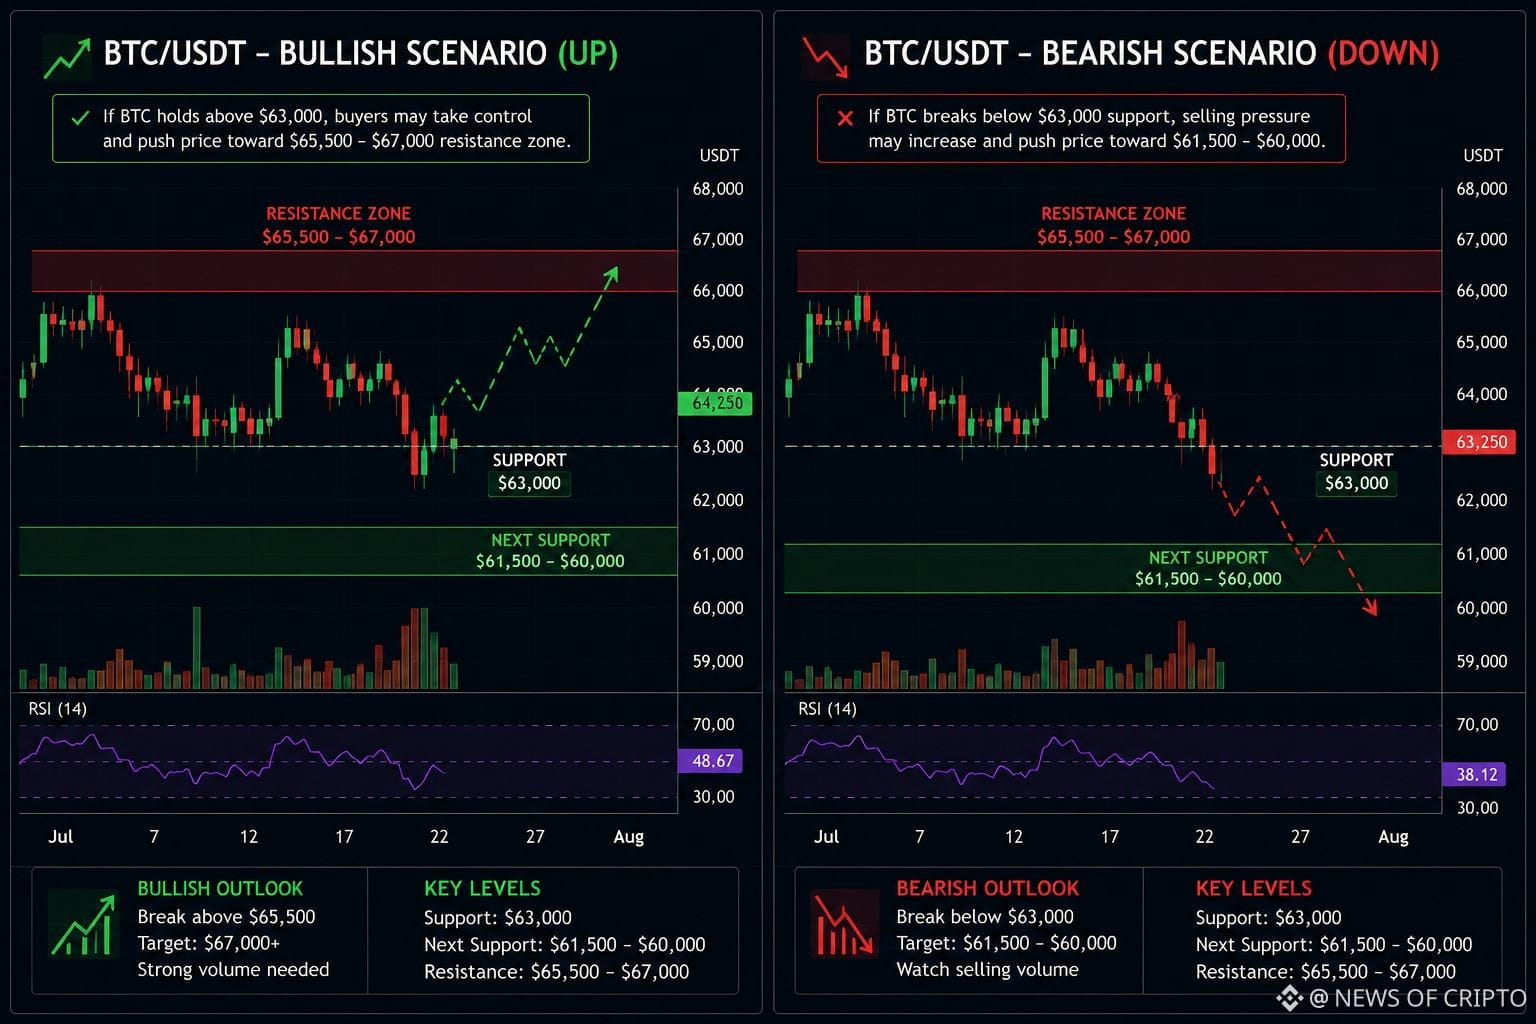
El gráfico sugiere que Bitcoin actualmente se encuentra en una tendencia bajista a corto plazo, con el precio operando cerca del importante nivel de soporte de $63,000. Las salidas recientes de ETF y el aumento de la presión vendedora han debilitado el impulso alcista, por lo que esta zona de soporte es crucial para el siguiente movimiento.
Si Bitcoin se mantiene por encima de $63,000, los compradores podrían recuperar el control y empujar el precio hacia la zona de resistencia de $65,500–$67,000. Una ruptura por encima de esta resistencia, respaldada por un fuerte volumen de operaciones, podría indicar un cambio de nuevo hacia una tendencia alcista y potencialmente abrir la puerta a nuevas ganancias.
Sin embargo, si se rompe el soporte de $63,000, es probable que aumente el impulso bajista. En ese caso, Bitcoin podría caer hacia el área de soporte de $61,500–$60,000, donde los compradores podrían intentar defender nuevamente el precio.
El patrón de velas muestra que los vendedores son actualmente más fuertes que los compradores, aunque la pequeña vela alcista indica que aún existe cierto interés comprador cerca del soporte. Esto significa que el mercado está esperando una ruptura o una caída clara antes de elegir su próxima dirección.
El volumen de operaciones y los flujos de ETF institucionales deben monitorearse de cerca. Aumentar el volumen de compra cerca del soporte fortalecería el escenario alcista, mientras que las salidas continuas de ETF y el elevado volumen de ventas favorecerían el escenario bajista.
📌 Niveles clave
Soporte: $63,000 Siguiente soporte: $61,500–$60,000 Resistencia: $65,500–$67,000
📈 Perspectiva del mercado
Corto plazo: 📉 Bajista Mediano plazo: 🟡 Neutral Largo plazo: 🚀 Alcista si BTC recupera $65,500 con fuerte volumen y regresan las entradas de ETF.$BTC
{spot}(BTCUSDT)
El gráfico sugiere que Bitcoin actualmente se encuentra en una tendencia bajista a corto plazo, con el precio operando cerca del importante nivel de soporte de $63,000. Las salidas recientes de ETF y el aumento de la presión vendedora han debilitado el impulso alcista, por lo que esta zona de soporte es crucial para el siguiente movimiento.
Si Bitcoin se mantiene por encima de $63,000, los compradores podrían recuperar el control y empujar el precio hacia la zona de resistencia de $65,500–$67,000. Una ruptura por encima de esta resistencia, respaldada por un fuerte volumen de operaciones, podría indicar un cambio de nuevo hacia una tendencia alcista y potencialmente abrir la puerta a nuevas ganancias.
Sin embargo, si se rompe el soporte de $63,000, es probable que aumente el impulso bajista. En ese caso, Bitcoin podría caer hacia el área de soporte de $61,500–$60,000, donde los compradores podrían intentar defender nuevamente el precio.
El patrón de velas muestra que los vendedores son actualmente más fuertes que los compradores, aunque la pequeña vela alcista indica que aún existe cierto interés comprador cerca del soporte. Esto significa que el mercado está esperando una ruptura o una caída clara antes de elegir su próxima dirección.
El volumen de operaciones y los flujos de ETF institucionales deben monitorearse de cerca. Aumentar el volumen de compra cerca del soporte fortalecería el escenario alcista, mientras que las salidas continuas de ETF y el elevado volumen de ventas favorecerían el escenario bajista.
📌 Niveles clave
Soporte: $63,000 Siguiente soporte: $61,500–$60,000 Resistencia: $65,500–$67,000
📈 Perspectiva del mercado
Corto plazo: 📉 Bajista Mediano plazo: 🟡 Neutral Largo plazo: 🚀 Alcista si BTC recupera $65,500 con fuerte volumen y regresan las entradas de ETF.$BTC
Si Bitcoin se mantiene por encima de $63,000, los compradores podrían recuperar el control y empujar el precio hacia la zona de resistencia de $65,500–$67,000. Una ruptura por encima de esta resistencia, respaldada por un fuerte volumen de operaciones, podría indicar un cambio de nuevo hacia una tendencia alcista y potencialmente abrir la puerta a nuevas ganancias.
Sin embargo, si se rompe el soporte de $63,000, es probable que aumente el impulso bajista. En ese caso, Bitcoin podría caer hacia el área de soporte de $61,500–$60,000, donde los compradores podrían intentar defender nuevamente el precio.
El patrón de velas muestra que los vendedores son actualmente más fuertes que los compradores, aunque la pequeña vela alcista indica que aún existe cierto interés comprador cerca del soporte. Esto significa que el mercado está esperando una ruptura o una caída clara antes de elegir su próxima dirección.
El volumen de operaciones y los flujos de ETF institucionales deben monitorearse de cerca. Aumentar el volumen de compra cerca del soporte fortalecería el escenario alcista, mientras que las salidas continuas de ETF y el elevado volumen de ventas favorecerían el escenario bajista.
📌 Niveles clave
Soporte: $63,000 Siguiente soporte: $61,500–$60,000 Resistencia: $65,500–$67,000
📈 Perspectiva del mercado
Corto plazo: 📉 Bajista Mediano plazo: 🟡 Neutral Largo plazo: 🚀 Alcista si BTC recupera $65,500 con fuerte volumen y regresan las entradas de ETF.$BTC
1
45
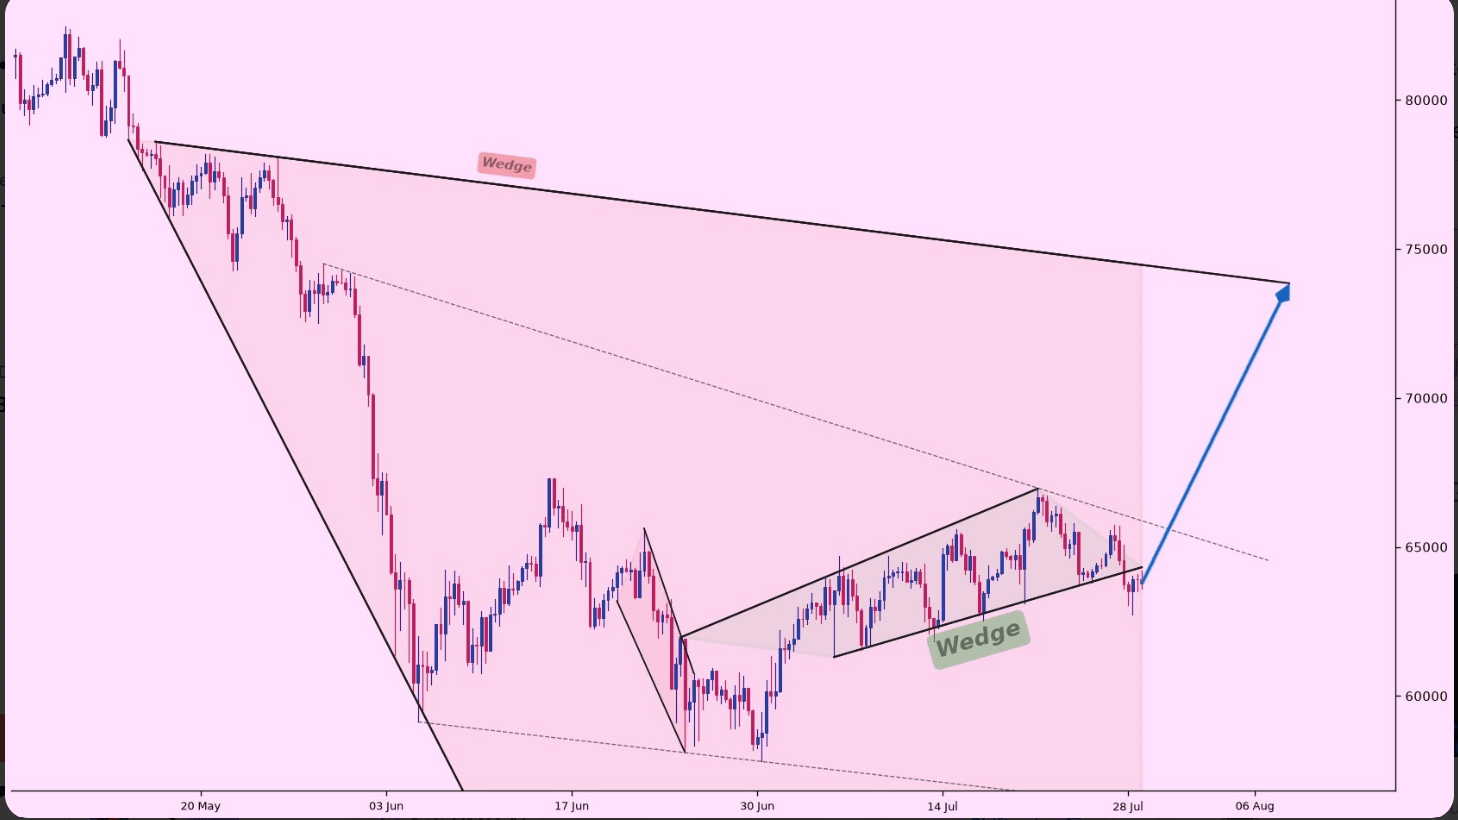
El precio está presionando dentro de una clave estructura 4H, y la reacción alrededor de esta zona puede decidir si los compradores pueden defender el movimiento o si los vendedores toman el control. No hace falta perseguir la primera vela: deja que el nivel confirme. 👀
$BTC
{spot}(BTCUSDT)
🎯 Niveles clave a vigilar:
Disparo alcista: recuperar la zona de resistencia más cercana para cambiar el impulso.
Objetivo a la baja: soporte actual / suelo del wedge si la presión se expande.
Los alcistas necesitan una reacción limpia por encima del soporte. Si se rompe la estructura inferior, la presión puede expandirse rápido y el siguiente bolsillo de liquidez se convierte en el objetivo. ⚡
Primero observa un intento de rebote, pero la reversión real solo comienza después de que el precio recupere la resistencia. Hasta entonces, el gráfico pertenece al lado más fuerte.
--
--
🚀 Dale al BOTÓN ME GUSTA si este análisis te ayuda.
#BTC #BITCOIN #BitcoinAnalysis" #crypto
El precio está presionando dentro de una clave estructura 4H, y la reacción alrededor de esta zona puede decidir si los compradores pueden defender el movimiento o si los vendedores toman el control. No hace falta perseguir la primera vela: deja que el nivel confirme. 👀
$BTC
🎯 Niveles clave a vigilar:
Disparo alcista: recuperar la zona de resistencia más cercana para cambiar el impulso.
Objetivo a la baja: soporte actual / suelo del wedge si la presión se expande.
Los alcistas necesitan una reacción limpia por encima del soporte. Si se rompe la estructura inferior, la presión puede expandirse rápido y el siguiente bolsillo de liquidez se convierte en el objetivo. ⚡
Primero observa un intento de rebote, pero la reversión real solo comienza después de que el precio recupere la resistencia. Hasta entonces, el gráfico pertenece al lado más fuerte.
--
--
🚀 Dale al BOTÓN ME GUSTA si este análisis te ayuda.
#BTC #BITCOIN #BitcoinAnalysis" #crypto
$BTC
🎯 Niveles clave a vigilar:
Disparo alcista: recuperar la zona de resistencia más cercana para cambiar el impulso.
Objetivo a la baja: soporte actual / suelo del wedge si la presión se expande.
Los alcistas necesitan una reacción limpia por encima del soporte. Si se rompe la estructura inferior, la presión puede expandirse rápido y el siguiente bolsillo de liquidez se convierte en el objetivo. ⚡
Primero observa un intento de rebote, pero la reversión real solo comienza después de que el precio recupere la resistencia. Hasta entonces, el gráfico pertenece al lado más fuerte.
--
--
🚀 Dale al BOTÓN ME GUSTA si este análisis te ayuda.
#BTC #BITCOIN #BitcoinAnalysis" #crypto
1
75
Con verificación
$ASTER
{spot}(ASTERUSDT)
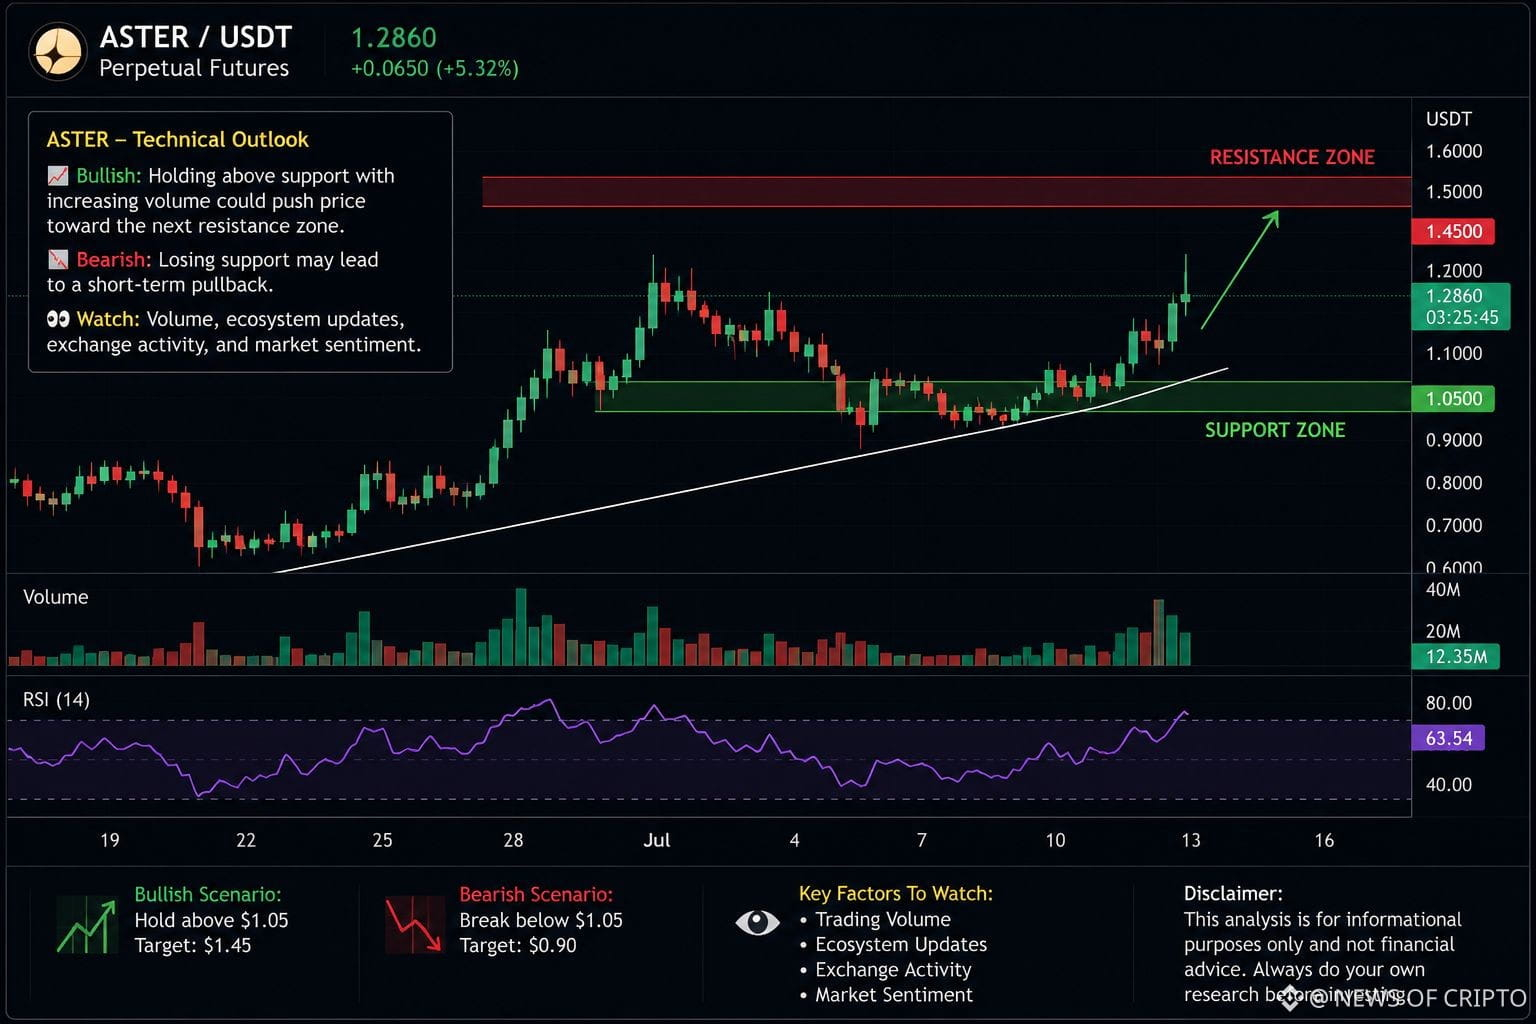
ASTER es un token de un exchange descentralizado de futuros perpetuos diseñado para respaldar el trading on-chain con funciones como gobernanza, incentivos de staking y mecanismos de reparto de comisiones. El proyecto ha atraído atención por su compatibilidad multi-cadena y su enfoque en ofrecer una experiencia de trading más cercana a los exchanges centralizados, manteniéndose a la vez descentralizado.
Perspectiva técnica:
📈 Alcista: Si ASTER se mantiene por encima de su nivel clave de soporte y aumenta el volumen de compra, podría continuar su impulso alcista hacia la siguiente zona de resistencia. 📉 Bajista: La incapacidad de sostener el soporte podría llevar a un retroceso a corto plazo antes de que vuelvan los compradores. 👀 Observa: El volumen de operaciones, las actualizaciones del ecosistema, la actividad en el exchange y el sentimiento general del mercado cripto siguen siendo los factores clave que influyen en el siguiente movimiento de ASTER.
#ASTER
#CryptoNews
#CryptoTrading
#Altcoins
#Blockchai n
$ASTER
ASTER es un token de un exchange descentralizado de futuros perpetuos diseñado para respaldar el trading on-chain con funciones como gobernanza, incentivos de staking y mecanismos de reparto de comisiones. El proyecto ha atraído atención por su compatibilidad multi-cadena y su enfoque en ofrecer una experiencia de trading más cercana a los exchanges centralizados, manteniéndose a la vez descentralizado.
Perspectiva técnica:
📈 Alcista: Si ASTER se mantiene por encima de su nivel clave de soporte y aumenta el volumen de compra, podría continuar su impulso alcista hacia la siguiente zona de resistencia. 📉 Bajista: La incapacidad de sostener el soporte podría llevar a un retroceso a corto plazo antes de que vuelvan los compradores. 👀 Observa: El volumen de operaciones, las actualizaciones del ecosistema, la actividad en el exchange y el sentimiento general del mercado cripto siguen siendo los factores clave que influyen en el siguiente movimiento de ASTER.
#ASTER
#CryptoNews
#CryptoTrading
#Altcoins
#Blockchai n
ASTER es un token de un exchange descentralizado de futuros perpetuos diseñado para respaldar el trading on-chain con funciones como gobernanza, incentivos de staking y mecanismos de reparto de comisiones. El proyecto ha atraído atención por su compatibilidad multi-cadena y su enfoque en ofrecer una experiencia de trading más cercana a los exchanges centralizados, manteniéndose a la vez descentralizado.
Perspectiva técnica:
📈 Alcista: Si ASTER se mantiene por encima de su nivel clave de soporte y aumenta el volumen de compra, podría continuar su impulso alcista hacia la siguiente zona de resistencia. 📉 Bajista: La incapacidad de sostener el soporte podría llevar a un retroceso a corto plazo antes de que vuelvan los compradores. 👀 Observa: El volumen de operaciones, las actualizaciones del ecosistema, la actividad en el exchange y el sentimiento general del mercado cripto siguen siendo los factores clave que influyen en el siguiente movimiento de ASTER.
#ASTER
#CryptoNews
#CryptoTrading
#Altcoins
#Blockchai n
1
168
Inicia sesión para explorar más contenidos
Únete a usuarios de criptomonedas de todo el mundo en Binance Square
⚡️ Obtén la información más reciente y útil sobre criptomonedas.
💬 Confía en el mayor exchange de criptomonedas del mundo.
👍 Descubre opiniones reales de creadores verificados.
Correo electrónico/número de teléfono
Temas en tendencia
FedRateWatch
1.1M visualizaciones
5,184 participa(n) en el debate
Comparte y gana recompensas de tráfico en nuestra campaña de hashtag en tendencia
✨Tema: FOMC septiembre, ¿cuál será el próximo movimiento de la Fed?
👉Cómo unirte:
Publica una publicación breve o un artículo con el hashtag #FedRateWatch
Crea contenido basado en los siguientes enfoques:
- El CPI subyacente de agosto aumentó 0.3% mes a mes, y las probabilidades de una subida de 25 pb esta semana ahora están cerca del 90%. ¿Anticipas una subida de tasas esta semana? ¿Es algo puntual o el inicio de un ciclo de subidas más largo?
- Si la subida ocurre, ¿cómo se desarrolla para BTC, acciones tecnológicas y oro? ¿Alcista o bajista?
- ¿Cómo planeas operar a continuación? Comparte tu operación/tenencias de BTC, acciones u oro con nuestro widget para compartir operaciones.
⏰Periodo de la campaña:
- 2026-09-15 11:00 - 2026-09-17 3:00 UTC
🎁Recompensa:
- Las publicaciones que cumplan con las pautas anteriores y tengan más de 100 palabras serán revisadas y podrían recibir un impulso aleatorio de tráfico de 500 a 3,000 visitas. Recibirás una notificación de tu secretario/a de feed si tu publicación es seleccionada.
- Obtén la oportunidad de que tu artículo aparezca destacado en Binance Square Official
¿Necesitas ideas para tu publicación? Visita la página del tema #FedRateWatch o la Square Guide on How to Post for Better Reach.
Binance Square Official
·573 «Me gusta»
·1.4M visualizaciones
ZcashRises6%
194 visualizaciones
15 participa(n) en el debate
XRPSinks10%
14 visualizaciones
10 participa(n) en el debate