

Bitcoinworld
69.1k Publicaciones

Bitcoinworld
 Verificado+ de Square
Denunciar
Bloquear usuario
BitcoinWorld is a leading media publication bringing the latest happenings in the Blockchain and Crypto Space.

#BinanceTurns7

Excellence Award (Market Buzz)

Creator of the Year
2 Siguiendo
100.7K+ Seguidores
287.4K+ Me gusta
4 Insignias
Publicaciones
Todo
Vídeos
Directo
·
--
Artículo
ChainIT presenta su arquitectura de comercio completo agéntico Web3 durante la semana de TOKEN2049 en SingapurBitcoinWorld
ChainIT presenta su arquitectura de comercio completo agéntico Web3 durante la semana de TOKEN2049 en Singapur
El libro blanco «La verdad de las transacciones» explica cómo los agentes de IA pueden realizar transacciones mediante una autoridad verificada, el cumplimiento normativo en tiempo de ejecución y una ejecución controlada en billeteras Web3, monedas estables y canales de pago tradicionales.
SCOTTSDALE, Arizona, 6 de octubre de 2026 /PRNewswire/ — ChainIT Inc. presentó hoy su arquitectura para el comercio completo agéntico Web3, en el marco de la semana de TOKEN2049 en Singapur, y destacó el libro blanco ejecutivo «La verdad de las transacciones de ChainIT: monedas estables, billeteras Web3 y comercio multicanal». La publicación describe cómo las transacciones iniciadas por IA pueden vincular una identidad verificada y una autoridad delegada con el cumplimiento normativo en tiempo de ejecución, una ejecución controlada y resultados comerciales verificables.
ChainIT presenta su arquitectura de comercio completo agéntico Web3 durante la semana de TOKEN2049 en Singapur
BitcoinWorld
ChainIT presenta su arquitectura de comercio completo agéntico Web3 durante la semana de TOKEN2049 en Singapur
El libro blanco «La verdad de las transacciones» explica cómo los agentes de IA pueden realizar transacciones mediante una autoridad verificada, el cumplimiento normativo en tiempo de ejecución y una ejecución controlada en billeteras Web3, monedas estables y canales de pago tradicionales.
SCOTTSDALE, Arizona, 6 de octubre de 2026 /PRNewswire/ — ChainIT Inc. presentó hoy su arquitectura para el comercio completo agéntico Web3, en el marco de la semana de TOKEN2049 en Singapur, y destacó el libro blanco ejecutivo «La verdad de las transacciones de ChainIT: monedas estables, billeteras Web3 y comercio multicanal». La publicación describe cómo las transacciones iniciadas por IA pueden vincular una identidad verificada y una autoridad delegada con el cumplimiento normativo en tiempo de ejecución, una ejecución controlada y resultados comerciales verificables.
ChainIT presenta su arquitectura de comercio completo agéntico Web3 durante la semana de TOKEN2049 en Singapur
El libro blanco «La verdad de las transacciones» explica cómo los agentes de IA pueden realizar transacciones mediante una autoridad verificada, el cumplimiento normativo en tiempo de ejecución y una ejecución controlada en billeteras Web3, monedas estables y canales de pago tradicionales.
SCOTTSDALE, Arizona, 6 de octubre de 2026 /PRNewswire/ — ChainIT Inc. presentó hoy su arquitectura para el comercio completo agéntico Web3, en el marco de la semana de TOKEN2049 en Singapur, y destacó el libro blanco ejecutivo «La verdad de las transacciones de ChainIT: monedas estables, billeteras Web3 y comercio multicanal». La publicación describe cómo las transacciones iniciadas por IA pueden vincular una identidad verificada y una autoridad delegada con el cumplimiento normativo en tiempo de ejecución, una ejecución controlada y resultados comerciales verificables.
1
200
·
--
Artículo
Umia recauda 6 millones de dólares para crear la plataforma en cadena de constitución de proyectos nativos de tokens, con la participación ...BitcoinWorld
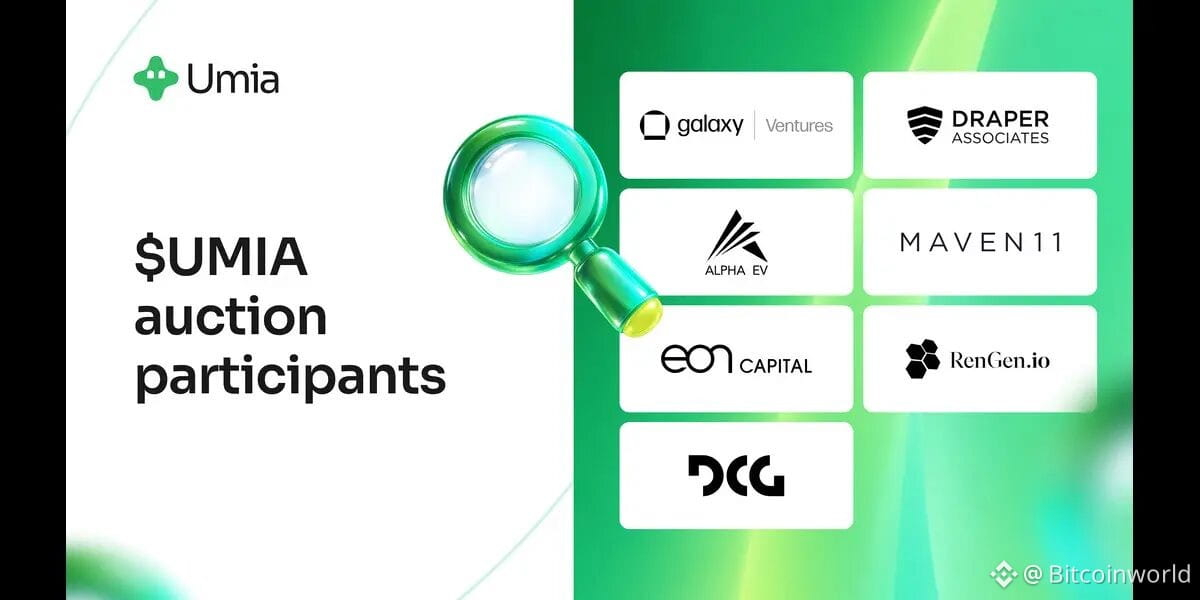
Umia recauda 6 millones de dólares para crear la plataforma en cadena de constitución de proyectos nativos de tokens, con la participación de Galaxy Ventures, DCG y Draper Associates
La mayoría de los tokens no tienen ningún vínculo formal con la empresa que los respalda: su propiedad intelectual, sus ingresos y su tesorería suelen estar en una entidad separada. Umia integra los tres en una misma estructura jurídica junto con el token, y las decisiones de tesorería se toman mediante mercados de decisión en cadena.
NUEVA YORK, 5 de octubre de 2026 /PRNewswire/ — Umia (umia.finance), la plataforma en cadena para lanzar, financiar y gobernar proyectos, anunció hoy que ha recaudado 6 millones de dólares mediante la subasta de $UMIA, el primer token lanzado a través de su propio sistema. Diez fondos y cerca de 700 participantes individuales tomaron parte en la venta de siete días, que se llevó a cabo en Base del 26 de agosto al 2 de septiembre y comenzó con una ronda anticipada de tres días para fondos previamente evaluados y miembros de la comunidad verificados mediante zkTLS. La ronda pública alcanzó su límite siete minutos después de abrirse, el 29 de agosto, y la venta cerró con una recaudación superior en más de 3 veces a su mínimo de 2 millones de dólares. Galaxy Ventures, DCG, Draper Associates, RenGen, Alpha EV, Maven 11 y Eon Capital estuvieron entre los fondos participantes. Todos pujaron en las mismas condiciones que los demás participantes, sin descuentos.
Umia recauda 6 millones de dólares para crear la plataforma en cadena de constitución de proyectos nativos de tokens, con la participación ...
BitcoinWorld
Umia recauda 6 millones de dólares para crear la plataforma en cadena de constitución de proyectos nativos de tokens, con la participación de Galaxy Ventures, DCG y Draper Associates
La mayoría de los tokens no tienen ningún vínculo formal con la empresa que los respalda: su propiedad intelectual, sus ingresos y su tesorería suelen estar en una entidad separada. Umia integra los tres en una misma estructura jurídica junto con el token, y las decisiones de tesorería se toman mediante mercados de decisión en cadena.
NUEVA YORK, 5 de octubre de 2026 /PRNewswire/ — Umia (umia.finance), la plataforma en cadena para lanzar, financiar y gobernar proyectos, anunció hoy que ha recaudado 6 millones de dólares mediante la subasta de $UMIA, el primer token lanzado a través de su propio sistema. Diez fondos y cerca de 700 participantes individuales tomaron parte en la venta de siete días, que se llevó a cabo en Base del 26 de agosto al 2 de septiembre y comenzó con una ronda anticipada de tres días para fondos previamente evaluados y miembros de la comunidad verificados mediante zkTLS. La ronda pública alcanzó su límite siete minutos después de abrirse, el 29 de agosto, y la venta cerró con una recaudación superior en más de 3 veces a su mínimo de 2 millones de dólares. Galaxy Ventures, DCG, Draper Associates, RenGen, Alpha EV, Maven 11 y Eon Capital estuvieron entre los fondos participantes. Todos pujaron en las mismas condiciones que los demás participantes, sin descuentos.
Umia recauda 6 millones de dólares para crear la plataforma en cadena de constitución de proyectos nativos de tokens, con la participación de Galaxy Ventures, DCG y Draper Associates
La mayoría de los tokens no tienen ningún vínculo formal con la empresa que los respalda: su propiedad intelectual, sus ingresos y su tesorería suelen estar en una entidad separada. Umia integra los tres en una misma estructura jurídica junto con el token, y las decisiones de tesorería se toman mediante mercados de decisión en cadena.
NUEVA YORK, 5 de octubre de 2026 /PRNewswire/ — Umia (umia.finance), la plataforma en cadena para lanzar, financiar y gobernar proyectos, anunció hoy que ha recaudado 6 millones de dólares mediante la subasta de $UMIA, el primer token lanzado a través de su propio sistema. Diez fondos y cerca de 700 participantes individuales tomaron parte en la venta de siete días, que se llevó a cabo en Base del 26 de agosto al 2 de septiembre y comenzó con una ronda anticipada de tres días para fondos previamente evaluados y miembros de la comunidad verificados mediante zkTLS. La ronda pública alcanzó su límite siete minutos después de abrirse, el 29 de agosto, y la venta cerró con una recaudación superior en más de 3 veces a su mínimo de 2 millones de dólares. Galaxy Ventures, DCG, Draper Associates, RenGen, Alpha EV, Maven 11 y Eon Capital estuvieron entre los fondos participantes. Todos pujaron en las mismas condiciones que los demás participantes, sin descuentos.
1
5
131
·
--
Artículo
Preparar la criptografía mundial para la era de la IA: Eigen Labs y Shielded Labs, organización de Zcash...BitcoinWorld
Eigen Labs y Shielded Labs, organización de Zcash, preparan la criptografía mundial para la era de la IA y lanzan HashSmash, una competencia abierta y multijugador para poner a prueba hasta dónde puede llegar la IA en el avance de ataques contra funciones hash de uso generalizado
Cualquiera puede dirigir agentes de IA contra SHA-256, SHA-3, BLAKE3 y Poseidon en Yukon, y todos los resultados se publican y son revisados por criptógrafos. La competencia abierta, organizada en Yukon, pondrá a prueba hasta dónde puede llegar la IA en el avance de ataques contra las funciones hash que sustentan la criptografía en todo internet.
Preparar la criptografía mundial para la era de la IA: Eigen Labs y Shielded Labs, organización de Zcash...
BitcoinWorld
Eigen Labs y Shielded Labs, organización de Zcash, preparan la criptografía mundial para la era de la IA y lanzan HashSmash, una competencia abierta y multijugador para poner a prueba hasta dónde puede llegar la IA en el avance de ataques contra funciones hash de uso generalizado
Cualquiera puede dirigir agentes de IA contra SHA-256, SHA-3, BLAKE3 y Poseidon en Yukon, y todos los resultados se publican y son revisados por criptógrafos. La competencia abierta, organizada en Yukon, pondrá a prueba hasta dónde puede llegar la IA en el avance de ataques contra las funciones hash que sustentan la criptografía en todo internet.
Eigen Labs y Shielded Labs, organización de Zcash, preparan la criptografía mundial para la era de la IA y lanzan HashSmash, una competencia abierta y multijugador para poner a prueba hasta dónde puede llegar la IA en el avance de ataques contra funciones hash de uso generalizado
Cualquiera puede dirigir agentes de IA contra SHA-256, SHA-3, BLAKE3 y Poseidon en Yukon, y todos los resultados se publican y son revisados por criptógrafos. La competencia abierta, organizada en Yukon, pondrá a prueba hasta dónde puede llegar la IA en el avance de ataques contra las funciones hash que sustentan la criptografía en todo internet.
462
·
--
Artículo
Reap y Collinson International sellan una alianza histórica para llevar las experiencias aeroportuarias de Priority Pass...BitcoinWorld
Reap y Collinson International sellan una alianza histórica para llevar las experiencias aeroportuarias de Priority Pass al ecosistema de las criptomonedas y las monedas estables
La colaboración conecta a los clientes de activos digitales con beneficios de viaje prémium y brinda a los titulares de tarjetas que cumplan los requisitos acceso a la red global de Priority Pass, que cuenta con más de 1.900 salas VIP en aeropuertos y experiencias de viaje.
SINGAPUR, 5 de octubre de 2026 /PRNewswire/ — Reap, una empresa global de tecnología financiera que facilita la conectividad y el acceso financieros a empresas de todo el mundo mediante una infraestructura habilitada para monedas estables, ha establecido una alianza estratégica con Collinson International, líder global en la oferta de experiencias aeroportuarias, soluciones de fidelización y participación de clientes, y propietaria y operadora de Priority Pass.
Reap y Collinson International sellan una alianza histórica para llevar las experiencias aeroportuarias de Priority Pass...
BitcoinWorld
Reap y Collinson International sellan una alianza histórica para llevar las experiencias aeroportuarias de Priority Pass al ecosistema de las criptomonedas y las monedas estables
La colaboración conecta a los clientes de activos digitales con beneficios de viaje prémium y brinda a los titulares de tarjetas que cumplan los requisitos acceso a la red global de Priority Pass, que cuenta con más de 1.900 salas VIP en aeropuertos y experiencias de viaje.
SINGAPUR, 5 de octubre de 2026 /PRNewswire/ — Reap, una empresa global de tecnología financiera que facilita la conectividad y el acceso financieros a empresas de todo el mundo mediante una infraestructura habilitada para monedas estables, ha establecido una alianza estratégica con Collinson International, líder global en la oferta de experiencias aeroportuarias, soluciones de fidelización y participación de clientes, y propietaria y operadora de Priority Pass.
Reap y Collinson International sellan una alianza histórica para llevar las experiencias aeroportuarias de Priority Pass al ecosistema de las criptomonedas y las monedas estables
La colaboración conecta a los clientes de activos digitales con beneficios de viaje prémium y brinda a los titulares de tarjetas que cumplan los requisitos acceso a la red global de Priority Pass, que cuenta con más de 1.900 salas VIP en aeropuertos y experiencias de viaje.
SINGAPUR, 5 de octubre de 2026 /PRNewswire/ — Reap, una empresa global de tecnología financiera que facilita la conectividad y el acceso financieros a empresas de todo el mundo mediante una infraestructura habilitada para monedas estables, ha establecido una alianza estratégica con Collinson International, líder global en la oferta de experiencias aeroportuarias, soluciones de fidelización y participación de clientes, y propietaria y operadora de Priority Pass.
1
232
·
--
Artículo
Los pagos con tarjetas de Visa vinculadas a stablecoins aumentan casi un 200 % interanualBitcoinWorld
Los pagos con tarjetas de Visa vinculadas a stablecoins aumentan casi un 200 % interanual
Visa informó el 1 de octubre que el volumen de pagos de sus programas de tarjetas vinculadas a stablecoins creció casi un 200 % interanual, y que ya hay más de 160 programas para consumidores y empresas en funcionamiento en su red. La compañía no reveló el valor total en dólares que respalda esa cifra de crecimiento, y la información distingue el volumen de pagos con tarjetas de la actividad de liquidación con stablecoins de Visa, que mide otra parte de la red.
El volumen de pagos con tarjetas de Visa vinculadas a stablecoins aumentó casi un 200 % interanual, con más de 160 programas en funcionamiento. Los programas de tarjetas comerciales y empresariales generaron cerca del 17 % de ese volumen en lo que va del ejercicio fiscal 2026, y Visa indicó que la actividad de liquidación con stablecoins superó recientemente un ritmo anualizado de 20.000 millones de dólares.
Los pagos con tarjetas de Visa vinculadas a stablecoins aumentan casi un 200 % interanual
BitcoinWorld
Los pagos con tarjetas de Visa vinculadas a stablecoins aumentan casi un 200 % interanual
Visa informó el 1 de octubre que el volumen de pagos de sus programas de tarjetas vinculadas a stablecoins creció casi un 200 % interanual, y que ya hay más de 160 programas para consumidores y empresas en funcionamiento en su red. La compañía no reveló el valor total en dólares que respalda esa cifra de crecimiento, y la información distingue el volumen de pagos con tarjetas de la actividad de liquidación con stablecoins de Visa, que mide otra parte de la red.
El volumen de pagos con tarjetas de Visa vinculadas a stablecoins aumentó casi un 200 % interanual, con más de 160 programas en funcionamiento. Los programas de tarjetas comerciales y empresariales generaron cerca del 17 % de ese volumen en lo que va del ejercicio fiscal 2026, y Visa indicó que la actividad de liquidación con stablecoins superó recientemente un ritmo anualizado de 20.000 millones de dólares.
Los pagos con tarjetas de Visa vinculadas a stablecoins aumentan casi un 200 % interanual
Visa informó el 1 de octubre que el volumen de pagos de sus programas de tarjetas vinculadas a stablecoins creció casi un 200 % interanual, y que ya hay más de 160 programas para consumidores y empresas en funcionamiento en su red. La compañía no reveló el valor total en dólares que respalda esa cifra de crecimiento, y la información distingue el volumen de pagos con tarjetas de la actividad de liquidación con stablecoins de Visa, que mide otra parte de la red.
El volumen de pagos con tarjetas de Visa vinculadas a stablecoins aumentó casi un 200 % interanual, con más de 160 programas en funcionamiento. Los programas de tarjetas comerciales y empresariales generaron cerca del 17 % de ese volumen en lo que va del ejercicio fiscal 2026, y Visa indicó que la actividad de liquidación con stablecoins superó recientemente un ritmo anualizado de 20.000 millones de dólares.
192
·
--
Artículo
Payward y Singapore Gulf Bank se asocian para ofrecer liquidación 24/7 a mercados institucionales de activos digitales M...BitcoinWorld
Payward y Singapore Gulf Bank se asocian para ofrecer liquidación 24/7 a mercados institucionales de activos digitales
Payward ha integrado SGB Net, la red de compensación en tiempo real de Singapore Gulf Bank, lo que permite a los clientes institucionales en Asia y la región del Golfo liquidar de forma instantánea en cualquier momento. SGB también incorporará a Kraken Prime como una fuente adicional de liquidez en activos digitales.
SYDNEY, 5 de octubre de 2026 /PRNewswire/ — Payward, la plataforma unificada de infraestructura financiera detrás de Kraken, y Singapore Gulf Bank (SGB), un banco digital con licencia completa regulado por el Banco Central de Bahréin, anunciaron hoy una asociación estratégica para ofrecer una liquidación siempre activa (always-on) a los mercados institucionales de activos digitales disponibles únicamente para jurisdicciones específicas.
Payward y Singapore Gulf Bank se asocian para ofrecer liquidación 24/7 a mercados institucionales de activos digitales M...
BitcoinWorld
Payward y Singapore Gulf Bank se asocian para ofrecer liquidación 24/7 a mercados institucionales de activos digitales
Payward ha integrado SGB Net, la red de compensación en tiempo real de Singapore Gulf Bank, lo que permite a los clientes institucionales en Asia y la región del Golfo liquidar de forma instantánea en cualquier momento. SGB también incorporará a Kraken Prime como una fuente adicional de liquidez en activos digitales.
SYDNEY, 5 de octubre de 2026 /PRNewswire/ — Payward, la plataforma unificada de infraestructura financiera detrás de Kraken, y Singapore Gulf Bank (SGB), un banco digital con licencia completa regulado por el Banco Central de Bahréin, anunciaron hoy una asociación estratégica para ofrecer una liquidación siempre activa (always-on) a los mercados institucionales de activos digitales disponibles únicamente para jurisdicciones específicas.
Payward y Singapore Gulf Bank se asocian para ofrecer liquidación 24/7 a mercados institucionales de activos digitales
Payward ha integrado SGB Net, la red de compensación en tiempo real de Singapore Gulf Bank, lo que permite a los clientes institucionales en Asia y la región del Golfo liquidar de forma instantánea en cualquier momento. SGB también incorporará a Kraken Prime como una fuente adicional de liquidez en activos digitales.
SYDNEY, 5 de octubre de 2026 /PRNewswire/ — Payward, la plataforma unificada de infraestructura financiera detrás de Kraken, y Singapore Gulf Bank (SGB), un banco digital con licencia completa regulado por el Banco Central de Bahréin, anunciaron hoy una asociación estratégica para ofrecer una liquidación siempre activa (always-on) a los mercados institucionales de activos digitales disponibles únicamente para jurisdicciones específicas.
103
·
--
Artículo
Más y más organizará la Cumbre de Finanzas Agentic con Etoro, Pantera Capital y Chainlink durante TOKE...BitcoinWorld
Más y más organizará la Cumbre de Finanzas Agentic con etoro, Pantera Capital y Chainlink durante TOKEN2049 Singapur
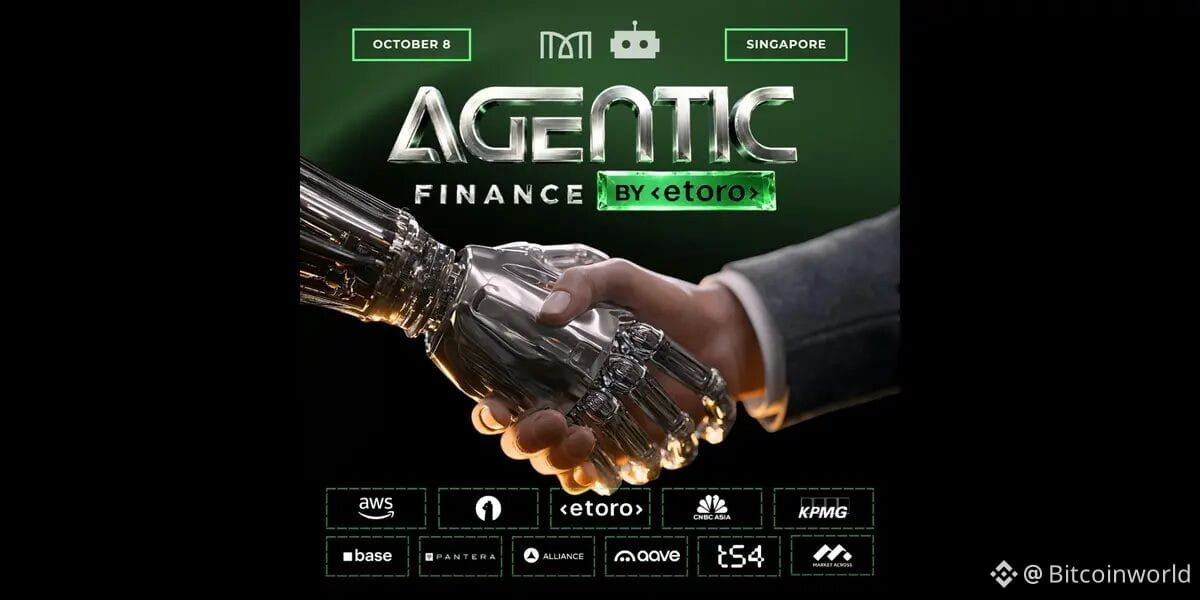
La cumbre solo por invitación el 8 de octubre reúne a 400 ejecutivos de bancos, bolsas, redes de pagos y fondos en Suntec City para analizar cómo los agentes de IA están entrando en el trading, los pagos y el cumplimiento.
Singapur, 5 de octubre de 2026 — More & More organizará la Cumbre de Finanzas Agentic el 8 de octubre de 2026 en el Suntec Singapore Convention and Exhibition Centre, un evento secundario oficial de TOKEN2049 Singapur. etoro es el socio principal de la cumbre.
Más y más organizará la Cumbre de Finanzas Agentic con Etoro, Pantera Capital y Chainlink durante TOKE...
BitcoinWorld
Más y más organizará la Cumbre de Finanzas Agentic con etoro, Pantera Capital y Chainlink durante TOKEN2049 Singapur
La cumbre solo por invitación el 8 de octubre reúne a 400 ejecutivos de bancos, bolsas, redes de pagos y fondos en Suntec City para analizar cómo los agentes de IA están entrando en el trading, los pagos y el cumplimiento.
Singapur, 5 de octubre de 2026 — More & More organizará la Cumbre de Finanzas Agentic el 8 de octubre de 2026 en el Suntec Singapore Convention and Exhibition Centre, un evento secundario oficial de TOKEN2049 Singapur. etoro es el socio principal de la cumbre.
Más y más organizará la Cumbre de Finanzas Agentic con etoro, Pantera Capital y Chainlink durante TOKEN2049 Singapur
La cumbre solo por invitación el 8 de octubre reúne a 400 ejecutivos de bancos, bolsas, redes de pagos y fondos en Suntec City para analizar cómo los agentes de IA están entrando en el trading, los pagos y el cumplimiento.
Singapur, 5 de octubre de 2026 — More & More organizará la Cumbre de Finanzas Agentic el 8 de octubre de 2026 en el Suntec Singapore Convention and Exhibition Centre, un evento secundario oficial de TOKEN2049 Singapur. etoro es el socio principal de la cumbre.
210
·
--
Artículo
El volumen cripto de Corea del Sur cae 19,56% en una semanaBitcoinWorld
El volumen cripto de Corea del Sur cae 19,56% en una semana
El volumen de operaciones combinado de las cinco mayores bolsas de criptomonedas de Corea del Sur cayó a unos 20,5 billones de wones, o aproximadamente 15,1 mil millones de dólares, en la semana que terminó el 2 de octubre, lo que representa una disminución del 19,56% frente a la semana anterior, según Crypto.news, citando datos de Digital Asset. La caída eliminó alrededor de 5 billones de wones, o aproximadamente 3,7 mil millones de dólares, de la actividad en el periodo de siete días que finalizó a las 2 p. m. hora estándar de Corea del Sur el 2 de octubre.
Las cinco principales bolsas de Corea del Sur negociaron aproximadamente 20,5 billones de wones en la semana hasta el 2 de octubre, una caída del 19,56% semana contra semana. El retroceso semanal siguió a datos gubernamentales que mostraron que el volumen promedio diario de intercambio en el país cayó un 44% en la primera mitad de 2026 y que el beneficio operativo se redujo un 78%.
El volumen cripto de Corea del Sur cae 19,56% en una semana
BitcoinWorld
El volumen cripto de Corea del Sur cae 19,56% en una semana
El volumen de operaciones combinado de las cinco mayores bolsas de criptomonedas de Corea del Sur cayó a unos 20,5 billones de wones, o aproximadamente 15,1 mil millones de dólares, en la semana que terminó el 2 de octubre, lo que representa una disminución del 19,56% frente a la semana anterior, según Crypto.news, citando datos de Digital Asset. La caída eliminó alrededor de 5 billones de wones, o aproximadamente 3,7 mil millones de dólares, de la actividad en el periodo de siete días que finalizó a las 2 p. m. hora estándar de Corea del Sur el 2 de octubre.
Las cinco principales bolsas de Corea del Sur negociaron aproximadamente 20,5 billones de wones en la semana hasta el 2 de octubre, una caída del 19,56% semana contra semana. El retroceso semanal siguió a datos gubernamentales que mostraron que el volumen promedio diario de intercambio en el país cayó un 44% en la primera mitad de 2026 y que el beneficio operativo se redujo un 78%.
El volumen cripto de Corea del Sur cae 19,56% en una semana
El volumen de operaciones combinado de las cinco mayores bolsas de criptomonedas de Corea del Sur cayó a unos 20,5 billones de wones, o aproximadamente 15,1 mil millones de dólares, en la semana que terminó el 2 de octubre, lo que representa una disminución del 19,56% frente a la semana anterior, según Crypto.news, citando datos de Digital Asset. La caída eliminó alrededor de 5 billones de wones, o aproximadamente 3,7 mil millones de dólares, de la actividad en el periodo de siete días que finalizó a las 2 p. m. hora estándar de Corea del Sur el 2 de octubre.
Las cinco principales bolsas de Corea del Sur negociaron aproximadamente 20,5 billones de wones en la semana hasta el 2 de octubre, una caída del 19,56% semana contra semana. El retroceso semanal siguió a datos gubernamentales que mostraron que el volumen promedio diario de intercambio en el país cayó un 44% en la primera mitad de 2026 y que el beneficio operativo se redujo un 78%.
271
·
--
Con verificación
Artículo
OpenPayd Apunta a una Cotización en Nasdaq Para Finales de Año Bajo el Ticker OPBitcoinWorld
OpenPayd apunta a una cotización en Nasdaq para finales de año bajo el ticker OP
OpenPayd, la empresa de infraestructura de pagos con stablecoins con sede en Londres, espera completar su fusión con Titan Acquisition Corp. y cotizar en Nasdaq bajo el ticker OP para finales de 2026, según Crypto.news. La transacción, anunciada por aproximadamente 1.100 millones de dólares, otorgaría a la empresa combinada una valoración patrimonial pro forma implícita de hasta 1.145 millones de dólares.
OpenPayd planea cerrar su fusión con Titan Acquisition Corp. y cotizar en Nasdaq bajo OP para finales de 2026, valorando a la empresa combinada en hasta 1.145 millones de dólares. La firma de pagos con stablecoins busca lanzar servicios en EE. UU. para abril de 2027 utilizando 43 licencias de transmisor de dinero adquiridas en septiembre.
OpenPayd Apunta a una Cotización en Nasdaq Para Finales de Año Bajo el Ticker OP
BitcoinWorld
OpenPayd apunta a una cotización en Nasdaq para finales de año bajo el ticker OP
OpenPayd, la empresa de infraestructura de pagos con stablecoins con sede en Londres, espera completar su fusión con Titan Acquisition Corp. y cotizar en Nasdaq bajo el ticker OP para finales de 2026, según Crypto.news. La transacción, anunciada por aproximadamente 1.100 millones de dólares, otorgaría a la empresa combinada una valoración patrimonial pro forma implícita de hasta 1.145 millones de dólares.
OpenPayd planea cerrar su fusión con Titan Acquisition Corp. y cotizar en Nasdaq bajo OP para finales de 2026, valorando a la empresa combinada en hasta 1.145 millones de dólares. La firma de pagos con stablecoins busca lanzar servicios en EE. UU. para abril de 2027 utilizando 43 licencias de transmisor de dinero adquiridas en septiembre.
OpenPayd apunta a una cotización en Nasdaq para finales de año bajo el ticker OP
OpenPayd, la empresa de infraestructura de pagos con stablecoins con sede en Londres, espera completar su fusión con Titan Acquisition Corp. y cotizar en Nasdaq bajo el ticker OP para finales de 2026, según Crypto.news. La transacción, anunciada por aproximadamente 1.100 millones de dólares, otorgaría a la empresa combinada una valoración patrimonial pro forma implícita de hasta 1.145 millones de dólares.
OpenPayd planea cerrar su fusión con Titan Acquisition Corp. y cotizar en Nasdaq bajo OP para finales de 2026, valorando a la empresa combinada en hasta 1.145 millones de dólares. La firma de pagos con stablecoins busca lanzar servicios en EE. UU. para abril de 2027 utilizando 43 licencias de transmisor de dinero adquiridas en septiembre.
1
3
959
·
--

Artículo
Chainalysis AI rastrea el hack de Bitget de 387M dólares hasta Corea del NorteBitcoinWorld
Chainalysis rastrea con IA el hack de Bitget de 387 millones de dólares y lo vincula con Corea del Norte
La firma de análisis de blockchain Chainalysis atribuyó el hack de 387 millones de dólares a actores vinculados con Corea del Norte, empujando el total de robos de criptomonedas de ese país en 2026 a superar los 1.000 millones de dólares, según un informe publicado el miércoles y cubierto por Decrypt. La brecha del 24 de septiembre vio cómo salieron 387 millones de dólares de Bitget en 23 transferencias en cuatro blockchains en un plazo de tres horas. Chainalysis dijo que utilizó IA interna para acelerar el rastreo, comprimiendo lo que estimó como más de 20 horas de conciliación manual de puentes en menos de 10 minutos.
Chainalysis AI rastrea el hack de Bitget de 387M dólares hasta Corea del Norte
BitcoinWorld
Chainalysis rastrea con IA el hack de Bitget de 387 millones de dólares y lo vincula con Corea del Norte
La firma de análisis de blockchain Chainalysis atribuyó el hack de 387 millones de dólares a actores vinculados con Corea del Norte, empujando el total de robos de criptomonedas de ese país en 2026 a superar los 1.000 millones de dólares, según un informe publicado el miércoles y cubierto por Decrypt. La brecha del 24 de septiembre vio cómo salieron 387 millones de dólares de Bitget en 23 transferencias en cuatro blockchains en un plazo de tres horas. Chainalysis dijo que utilizó IA interna para acelerar el rastreo, comprimiendo lo que estimó como más de 20 horas de conciliación manual de puentes en menos de 10 minutos.
Chainalysis rastrea con IA el hack de Bitget de 387 millones de dólares y lo vincula con Corea del Norte
La firma de análisis de blockchain Chainalysis atribuyó el hack de 387 millones de dólares a actores vinculados con Corea del Norte, empujando el total de robos de criptomonedas de ese país en 2026 a superar los 1.000 millones de dólares, según un informe publicado el miércoles y cubierto por Decrypt. La brecha del 24 de septiembre vio cómo salieron 387 millones de dólares de Bitget en 23 transferencias en cuatro blockchains en un plazo de tres horas. Chainalysis dijo que utilizó IA interna para acelerar el rastreo, comprimiendo lo que estimó como más de 20 horas de conciliación manual de puentes en menos de 10 minutos.
1
2
316
·
--

Artículo
Encuesta de Lloyds: el 71% de los líderes financieros del Reino Unido espera un cambio por tokenizaciónBitcoinWorld
Encuesta de Lloyds: el 71% de los líderes financieros del Reino Unido espera un cambio por tokenización
Casi tres cuartas partes de los responsables sénior de la toma de decisiones en las principales instituciones financieras del Reino Unido creen que la tokenización transformará los servicios financieros, según una encuesta anual de Lloyds Banking Group publicada el 2 de octubre de 2026. El sondeo a 100 ejecutivos de bancos, aseguradoras, gestoras de activos y patrocinadores financieros halló que el 71% espera que la representación de activos basada en blockchain, como efectivo, bonos y fondos, altere la forma en que opera el sector, como informó Cointelegraph.
Encuesta de Lloyds: el 71% de los líderes financieros del Reino Unido espera un cambio por tokenización
BitcoinWorld
Encuesta de Lloyds: el 71% de los líderes financieros del Reino Unido espera un cambio por tokenización
Casi tres cuartas partes de los responsables sénior de la toma de decisiones en las principales instituciones financieras del Reino Unido creen que la tokenización transformará los servicios financieros, según una encuesta anual de Lloyds Banking Group publicada el 2 de octubre de 2026. El sondeo a 100 ejecutivos de bancos, aseguradoras, gestoras de activos y patrocinadores financieros halló que el 71% espera que la representación de activos basada en blockchain, como efectivo, bonos y fondos, altere la forma en que opera el sector, como informó Cointelegraph.
Encuesta de Lloyds: el 71% de los líderes financieros del Reino Unido espera un cambio por tokenización
Casi tres cuartas partes de los responsables sénior de la toma de decisiones en las principales instituciones financieras del Reino Unido creen que la tokenización transformará los servicios financieros, según una encuesta anual de Lloyds Banking Group publicada el 2 de octubre de 2026. El sondeo a 100 ejecutivos de bancos, aseguradoras, gestoras de activos y patrocinadores financieros halló que el 71% espera que la representación de activos basada en blockchain, como efectivo, bonos y fondos, altere la forma en que opera el sector, como informó Cointelegraph.
274
·
--
Artículo
Bitcoin se desploma por debajo de $84K mientras las liquidaciones se acercan a $600MBitcoinWorld
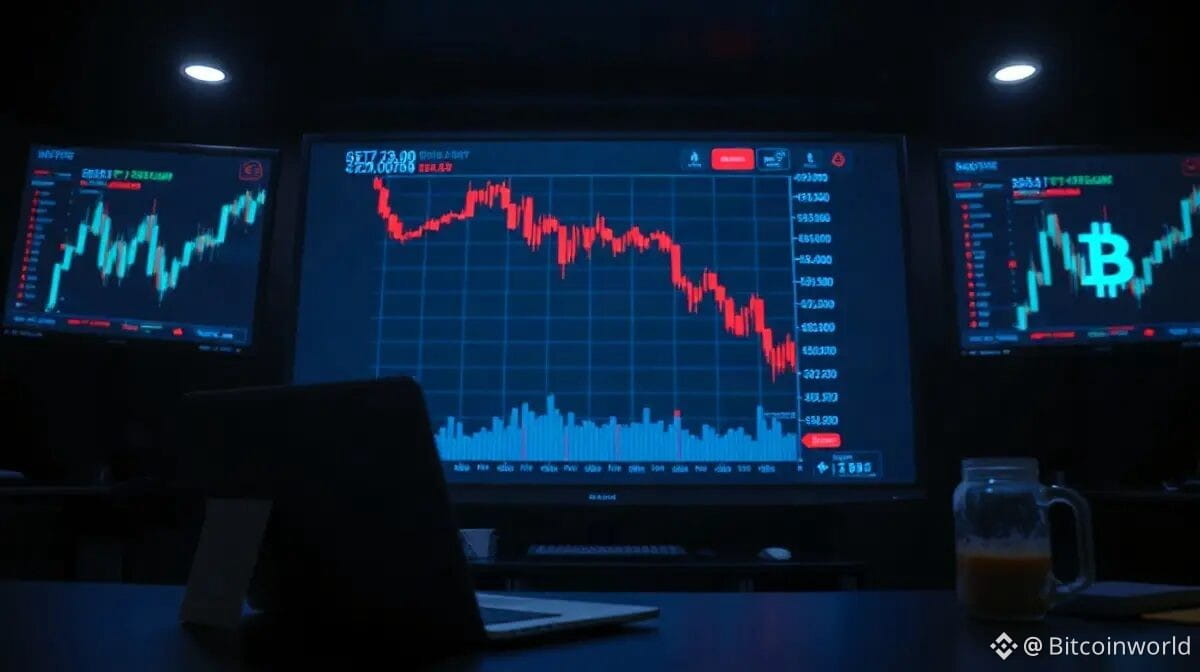
Bitcoin se desploma por debajo de $84K mientras las liquidaciones se acercan a $600M
Bitcoin cayó por debajo de 84.000 dólares el 2 de octubre de 2026, horas después de haber tocado brevemente los 87.000 dólares por primera vez en aproximadamente diez días, según Cryptopotato. La rápida inversión desencadenó una ola de ventas forzadas que empujó las liquidaciones totales de criptomonedas por encima de los 570 millones de dólares en 24 horas, con 186 millones de dólares liquidados en una sola hora.
Bitcoin se desplomó por debajo de los 84.000 dólares el 2 de octubre después de un intento fallido de recuperación por encima de los 87.000 dólares, lo que llevó a más de 570 millones de dólares en liquidaciones de criptomonedas. Las posiciones largas representaron el 99% de los 186 millones de dólares liquidados en la última hora, según datos de CoinGlass citados por Cryptopotato.
Bitcoin se desploma por debajo de $84K mientras las liquidaciones se acercan a $600M
BitcoinWorld
Bitcoin se desploma por debajo de $84K mientras las liquidaciones se acercan a $600M
Bitcoin cayó por debajo de 84.000 dólares el 2 de octubre de 2026, horas después de haber tocado brevemente los 87.000 dólares por primera vez en aproximadamente diez días, según Cryptopotato. La rápida inversión desencadenó una ola de ventas forzadas que empujó las liquidaciones totales de criptomonedas por encima de los 570 millones de dólares en 24 horas, con 186 millones de dólares liquidados en una sola hora.
Bitcoin se desplomó por debajo de los 84.000 dólares el 2 de octubre después de un intento fallido de recuperación por encima de los 87.000 dólares, lo que llevó a más de 570 millones de dólares en liquidaciones de criptomonedas. Las posiciones largas representaron el 99% de los 186 millones de dólares liquidados en la última hora, según datos de CoinGlass citados por Cryptopotato.
Bitcoin se desploma por debajo de $84K mientras las liquidaciones se acercan a $600M
Bitcoin cayó por debajo de 84.000 dólares el 2 de octubre de 2026, horas después de haber tocado brevemente los 87.000 dólares por primera vez en aproximadamente diez días, según Cryptopotato. La rápida inversión desencadenó una ola de ventas forzadas que empujó las liquidaciones totales de criptomonedas por encima de los 570 millones de dólares en 24 horas, con 186 millones de dólares liquidados en una sola hora.
Bitcoin se desplomó por debajo de los 84.000 dólares el 2 de octubre después de un intento fallido de recuperación por encima de los 87.000 dólares, lo que llevó a más de 570 millones de dólares en liquidaciones de criptomonedas. Las posiciones largas representaron el 99% de los 186 millones de dólares liquidados en la última hora, según datos de CoinGlass citados por Cryptopotato.
1
270
·
--
Artículo
Blast cerrará Layer 2 mientras los costos superan los ingresos y fija como fecha límite el 26 de octubreBitcoinWorld
Blast cerrará Layer 2 cuando los costos superen los ingresos y fija como fecha límite el 26 de octubre
Blast cerrará su red Ethereum Layer 2 después de determinar que el costo de ejecutar la cadena supera lo que obtiene, dijo el proyecto en un anuncio del 2 de octubre en X. Los usuarios tienen hasta el 26 de octubre de 2026 para retirar a través de la interfaz normal de Blast, según Crypto.news.
Blast está llegando al final de su Ethereum Layer 2 debido a que los costos de mantenimiento de la red superaron los ingresos que generaron las operaciones de su Layer 2. Los usuarios deben retirar mediante la interfaz estándar antes del 26 de octubre de 2026; después, los activos solo podrán recuperarse interactuando directamente con los contratos puente de Blast en la red principal de Ethereum.
Blast cerrará Layer 2 mientras los costos superan los ingresos y fija como fecha límite el 26 de octubre
BitcoinWorld
Blast cerrará Layer 2 cuando los costos superen los ingresos y fija como fecha límite el 26 de octubre
Blast cerrará su red Ethereum Layer 2 después de determinar que el costo de ejecutar la cadena supera lo que obtiene, dijo el proyecto en un anuncio del 2 de octubre en X. Los usuarios tienen hasta el 26 de octubre de 2026 para retirar a través de la interfaz normal de Blast, según Crypto.news.
Blast está llegando al final de su Ethereum Layer 2 debido a que los costos de mantenimiento de la red superaron los ingresos que generaron las operaciones de su Layer 2. Los usuarios deben retirar mediante la interfaz estándar antes del 26 de octubre de 2026; después, los activos solo podrán recuperarse interactuando directamente con los contratos puente de Blast en la red principal de Ethereum.
Blast cerrará Layer 2 cuando los costos superen los ingresos y fija como fecha límite el 26 de octubre
Blast cerrará su red Ethereum Layer 2 después de determinar que el costo de ejecutar la cadena supera lo que obtiene, dijo el proyecto en un anuncio del 2 de octubre en X. Los usuarios tienen hasta el 26 de octubre de 2026 para retirar a través de la interfaz normal de Blast, según Crypto.news.
Blast está llegando al final de su Ethereum Layer 2 debido a que los costos de mantenimiento de la red superaron los ingresos que generaron las operaciones de su Layer 2. Los usuarios deben retirar mediante la interfaz estándar antes del 26 de octubre de 2026; después, los activos solo podrán recuperarse interactuando directamente con los contratos puente de Blast en la red principal de Ethereum.
224
·
--
Artículo
La empresa matriz de Kraken, Payward, conversa con BNY sobre una asociación criptoBitcoinWorld
La empresa matriz de Kraken, Payward, conversa con BNY sobre una asociación cripto
Payward, la empresa matriz del exchange de criptomonedas Kraken, ha iniciado conversaciones con BNY sobre una posible asociación que abarcaría seis líneas de negocio, incluida la custodia de criptoactivos, la negociación y los pagos, según Crypto.news. Dos personas familiarizadas con las discusiones, que hablaron de forma anónima porque las negociaciones son privadas, dijeron que no hay ninguna garantía de que se llegue a un acuerdo.
Payward y BNY analizan una posible asociación que cubriría productos de cripto, custodia, gestión patrimonial, negociación, pagos e infraestructura financiera. Las conversaciones se informaron por primera vez por Crypto.news el 2 de octubre de 2026, mientras que PANews informó sobre las mismas conversaciones el 3 de octubre. Las negociaciones siguen en curso y no se ha confirmado ningún acuerdo.
La empresa matriz de Kraken, Payward, conversa con BNY sobre una asociación cripto
BitcoinWorld
La empresa matriz de Kraken, Payward, conversa con BNY sobre una asociación cripto
Payward, la empresa matriz del exchange de criptomonedas Kraken, ha iniciado conversaciones con BNY sobre una posible asociación que abarcaría seis líneas de negocio, incluida la custodia de criptoactivos, la negociación y los pagos, según Crypto.news. Dos personas familiarizadas con las discusiones, que hablaron de forma anónima porque las negociaciones son privadas, dijeron que no hay ninguna garantía de que se llegue a un acuerdo.
Payward y BNY analizan una posible asociación que cubriría productos de cripto, custodia, gestión patrimonial, negociación, pagos e infraestructura financiera. Las conversaciones se informaron por primera vez por Crypto.news el 2 de octubre de 2026, mientras que PANews informó sobre las mismas conversaciones el 3 de octubre. Las negociaciones siguen en curso y no se ha confirmado ningún acuerdo.
La empresa matriz de Kraken, Payward, conversa con BNY sobre una asociación cripto
Payward, la empresa matriz del exchange de criptomonedas Kraken, ha iniciado conversaciones con BNY sobre una posible asociación que abarcaría seis líneas de negocio, incluida la custodia de criptoactivos, la negociación y los pagos, según Crypto.news. Dos personas familiarizadas con las discusiones, que hablaron de forma anónima porque las negociaciones son privadas, dijeron que no hay ninguna garantía de que se llegue a un acuerdo.
Payward y BNY analizan una posible asociación que cubriría productos de cripto, custodia, gestión patrimonial, negociación, pagos e infraestructura financiera. Las conversaciones se informaron por primera vez por Crypto.news el 2 de octubre de 2026, mientras que PANews informó sobre las mismas conversaciones el 3 de octubre. Las negociaciones siguen en curso y no se ha confirmado ningún acuerdo.
166
·
--
Artículo
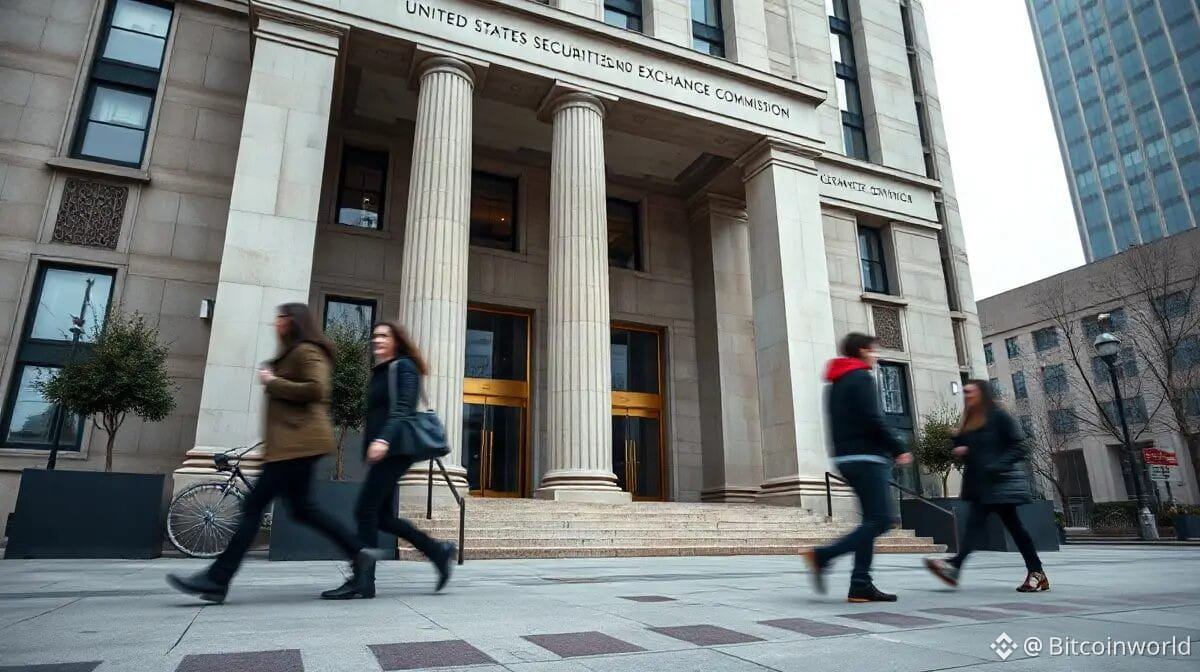
La SEC propone normas de custodia de cripto para asesores y fondosBitcoinWorld
La SEC propone normas de custodia de cripto para asesores y fondos
La Comisión de Bolsa y Valores de EE. UU. (SEC) ha propuesto nuevas normas que regulan cómo los asesores de inversión registrados y los fondos regulados custodian criptoactivos, un esfuerzo que el presidente Paul Atkins dijo que reemplazaría “la zona gris de la incertidumbre creada por las normas de custodia elaboradas para una era pasada”, según Cryptopotato. La propuesta, emitida en virtud de la Ley de Asesores de Inversión de 1940 y la Ley de Sociedades de Inversión de 1940, está diseñada para aclarar qué disposiciones cumplen el estándar de “custodio calificado”, que durante mucho tiempo ha impedido que muchas firmas ofrezcan estrategias de activos digitales en absoluto.
La SEC propone normas de custodia de cripto para asesores y fondos
BitcoinWorld
La SEC propone normas de custodia de cripto para asesores y fondos
La Comisión de Bolsa y Valores de EE. UU. (SEC) ha propuesto nuevas normas que regulan cómo los asesores de inversión registrados y los fondos regulados custodian criptoactivos, un esfuerzo que el presidente Paul Atkins dijo que reemplazaría “la zona gris de la incertidumbre creada por las normas de custodia elaboradas para una era pasada”, según Cryptopotato. La propuesta, emitida en virtud de la Ley de Asesores de Inversión de 1940 y la Ley de Sociedades de Inversión de 1940, está diseñada para aclarar qué disposiciones cumplen el estándar de “custodio calificado”, que durante mucho tiempo ha impedido que muchas firmas ofrezcan estrategias de activos digitales en absoluto.
La SEC propone normas de custodia de cripto para asesores y fondos
La Comisión de Bolsa y Valores de EE. UU. (SEC) ha propuesto nuevas normas que regulan cómo los asesores de inversión registrados y los fondos regulados custodian criptoactivos, un esfuerzo que el presidente Paul Atkins dijo que reemplazaría “la zona gris de la incertidumbre creada por las normas de custodia elaboradas para una era pasada”, según Cryptopotato. La propuesta, emitida en virtud de la Ley de Asesores de Inversión de 1940 y la Ley de Sociedades de Inversión de 1940, está diseñada para aclarar qué disposiciones cumplen el estándar de “custodio calificado”, que durante mucho tiempo ha impedido que muchas firmas ofrezcan estrategias de activos digitales en absoluto.
3
179
·
--
Artículo
La alineación más grande de Token Week ya está aquí: Arthur Hayes, Raoul Pal, como protagonistas de CoinFerenceX el mejor ...BitcoinWorld
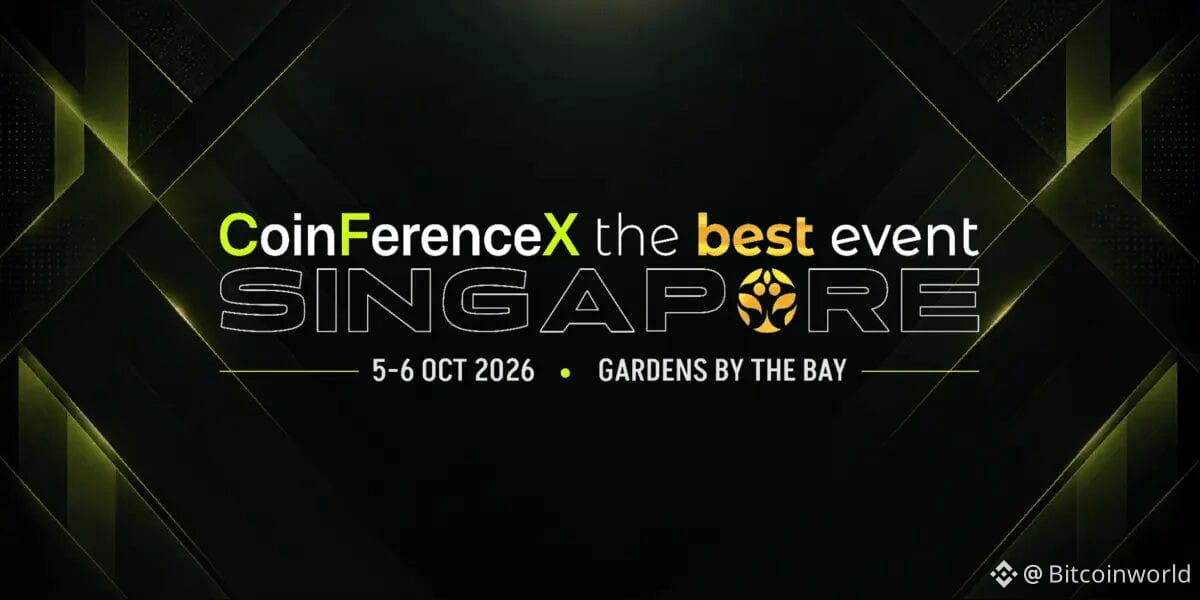
La alineación más grande de Token Week ya está aquí: Arthur Hayes, Raoul Pal, como protagonistas de CoinFerenceX El mejor evento de Singapur 2026
SINGAPUR, 1 de octubre de 2026: la alineación de ponentes más grande de Token Week se dirige a Gardens by the Bay. CoinFerenceX El mejor evento de Singapur 2026 contará con más de 85 ponentes en Flower Field Hall el 5 y 6 de octubre durante dos días de conferencias magistrales, paneles y charlas junto a la chimenea durante la semana de TOKEN2049.
La cumbre está encabezada por Arthur Hayes, CIO de Maelstrom; Raoul Pal, cofundador y CEO de Real Vision; Yat Siu, cofundador y presidente ejecutivo de Animoca Brands; Sandeep Nailwal, cofundador y CEO de Polygon; y Andrei Grachev, socio gerente de DWF Labs. Se les unen líderes sénior de Binance, Coinbase, Crypto.com, BNB Chain, MEXC, Gate, BingX, KuCoin, CertiK, Hacken, MetaMask, Base, Berachain y Spartan Group.
La alineación más grande de Token Week ya está aquí: Arthur Hayes, Raoul Pal, como protagonistas de CoinFerenceX el mejor ...
BitcoinWorld
La alineación más grande de Token Week ya está aquí: Arthur Hayes, Raoul Pal, como protagonistas de CoinFerenceX El mejor evento de Singapur 2026
SINGAPUR, 1 de octubre de 2026: la alineación de ponentes más grande de Token Week se dirige a Gardens by the Bay. CoinFerenceX El mejor evento de Singapur 2026 contará con más de 85 ponentes en Flower Field Hall el 5 y 6 de octubre durante dos días de conferencias magistrales, paneles y charlas junto a la chimenea durante la semana de TOKEN2049.
La cumbre está encabezada por Arthur Hayes, CIO de Maelstrom; Raoul Pal, cofundador y CEO de Real Vision; Yat Siu, cofundador y presidente ejecutivo de Animoca Brands; Sandeep Nailwal, cofundador y CEO de Polygon; y Andrei Grachev, socio gerente de DWF Labs. Se les unen líderes sénior de Binance, Coinbase, Crypto.com, BNB Chain, MEXC, Gate, BingX, KuCoin, CertiK, Hacken, MetaMask, Base, Berachain y Spartan Group.
La alineación más grande de Token Week ya está aquí: Arthur Hayes, Raoul Pal, como protagonistas de CoinFerenceX El mejor evento de Singapur 2026
SINGAPUR, 1 de octubre de 2026: la alineación de ponentes más grande de Token Week se dirige a Gardens by the Bay. CoinFerenceX El mejor evento de Singapur 2026 contará con más de 85 ponentes en Flower Field Hall el 5 y 6 de octubre durante dos días de conferencias magistrales, paneles y charlas junto a la chimenea durante la semana de TOKEN2049.
La cumbre está encabezada por Arthur Hayes, CIO de Maelstrom; Raoul Pal, cofundador y CEO de Real Vision; Yat Siu, cofundador y presidente ejecutivo de Animoca Brands; Sandeep Nailwal, cofundador y CEO de Polygon; y Andrei Grachev, socio gerente de DWF Labs. Se les unen líderes sénior de Binance, Coinbase, Crypto.com, BNB Chain, MEXC, Gate, BingX, KuCoin, CertiK, Hacken, MetaMask, Base, Berachain y Spartan Group.
152
·
--
Artículo
Circle pide a la UE que elimine la regla de depósito bancario de MiCA para las stablecoinsBitcoinWorld
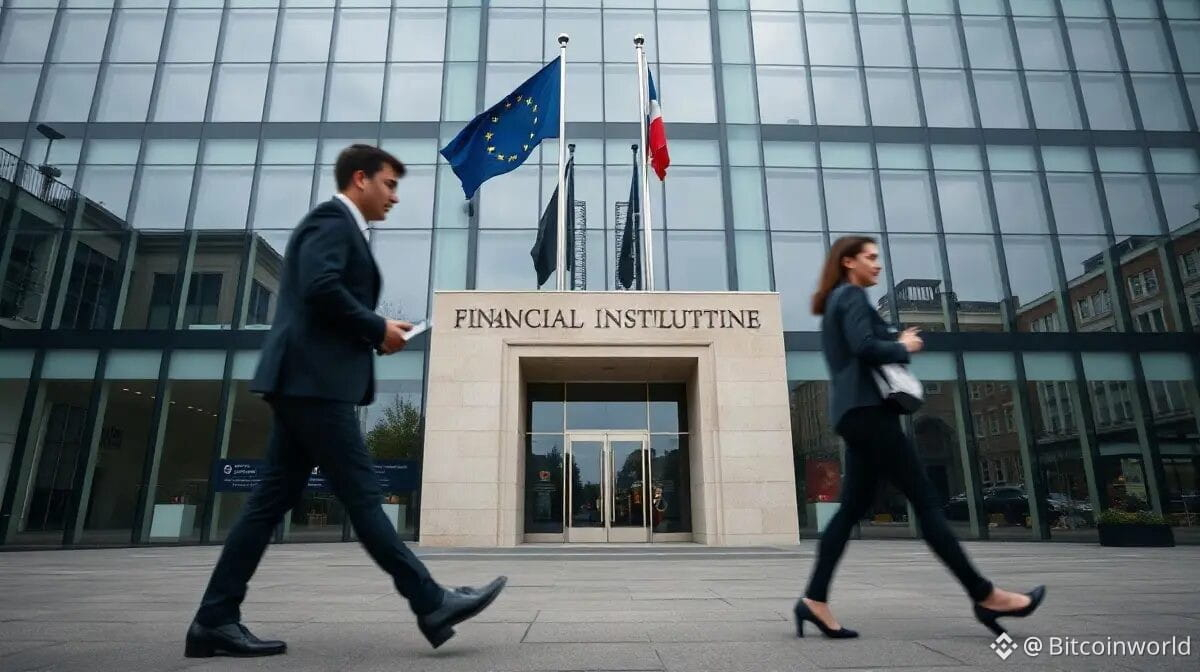
Circle pide a la UE que elimine la regla de depósito bancario de MiCA para las stablecoins
Circle ha pedido a la Comisión Europea que reescriba las normas de reservas en el marco de la Regulación de Mercados en Criptoactivos de la UE, y ha dicho a Bruselas que un mandato fijo de depósito bancario deja a los emisores de stablecoins más expuestos al sistema bancario, y no menos. El emisor de USDC presentó su respuesta a la consulta de la Comisión sobre MiCA el jueves 2 de octubre, según Decrypt.
Circle quiere que la Comisión Europea reemplace el requisito de MiCA de que los emisores de stablecoins mantengan al menos el 30% de las reservas en depósitos en bancos comerciales, que sube al 60% para los tokens considerados significativos, por exigencias basadas en la liquidez. La empresa también instó a la UE a preservar la emisión múltiple, advirtiendo que restringirla empujaría la actividad hacia el extranjero.
Circle pide a la UE que elimine la regla de depósito bancario de MiCA para las stablecoins
BitcoinWorld
Circle pide a la UE que elimine la regla de depósito bancario de MiCA para las stablecoins
Circle ha pedido a la Comisión Europea que reescriba las normas de reservas en el marco de la Regulación de Mercados en Criptoactivos de la UE, y ha dicho a Bruselas que un mandato fijo de depósito bancario deja a los emisores de stablecoins más expuestos al sistema bancario, y no menos. El emisor de USDC presentó su respuesta a la consulta de la Comisión sobre MiCA el jueves 2 de octubre, según Decrypt.
Circle quiere que la Comisión Europea reemplace el requisito de MiCA de que los emisores de stablecoins mantengan al menos el 30% de las reservas en depósitos en bancos comerciales, que sube al 60% para los tokens considerados significativos, por exigencias basadas en la liquidez. La empresa también instó a la UE a preservar la emisión múltiple, advirtiendo que restringirla empujaría la actividad hacia el extranjero.
Circle pide a la UE que elimine la regla de depósito bancario de MiCA para las stablecoins
Circle ha pedido a la Comisión Europea que reescriba las normas de reservas en el marco de la Regulación de Mercados en Criptoactivos de la UE, y ha dicho a Bruselas que un mandato fijo de depósito bancario deja a los emisores de stablecoins más expuestos al sistema bancario, y no menos. El emisor de USDC presentó su respuesta a la consulta de la Comisión sobre MiCA el jueves 2 de octubre, según Decrypt.
Circle quiere que la Comisión Europea reemplace el requisito de MiCA de que los emisores de stablecoins mantengan al menos el 30% de las reservas en depósitos en bancos comerciales, que sube al 60% para los tokens considerados significativos, por exigencias basadas en la liquidez. La empresa también instó a la UE a preservar la emisión múltiple, advirtiendo que restringirla empujaría la actividad hacia el extranjero.
854
·
--
Artículo
THORChain abre un pool de Zcash; los intercambios de ZEC aún no están en vivoBitcoinWorld
THORChain abre un pool de Zcash; los intercambios de ZEC aún no están en vivo
THORChain activó un pool de liquidez de Zcash (ZEC) el 2 de octubre de 2026, horas después de completar una rotación de nodos en la que cada nodo comenzó a vigilar la cadena de Zcash. El protocolo dijo que el pool ya está en funcionamiento, pero que “el trading es el siguiente paso”, y no dio una hora de inicio firme ni una cifra de profundidad del pool, según Crypto.news.
THORChain lanzó su pool de liquidez de Zcash (ZEC) el 2 de octubre de 2026, después de que una rotación de nodos dejó a cada nodo monitoreando la cadena de Zcash. El trading nativo de ZEC aún no ha comenzado, y THORChain dijo que la liquidez es superficial por ahora, así que está indicando a los usuarios que operen con cautela en los primeros días.
THORChain abre un pool de Zcash; los intercambios de ZEC aún no están en vivo
BitcoinWorld
THORChain abre un pool de Zcash; los intercambios de ZEC aún no están en vivo
THORChain activó un pool de liquidez de Zcash (ZEC) el 2 de octubre de 2026, horas después de completar una rotación de nodos en la que cada nodo comenzó a vigilar la cadena de Zcash. El protocolo dijo que el pool ya está en funcionamiento, pero que “el trading es el siguiente paso”, y no dio una hora de inicio firme ni una cifra de profundidad del pool, según Crypto.news.
THORChain lanzó su pool de liquidez de Zcash (ZEC) el 2 de octubre de 2026, después de que una rotación de nodos dejó a cada nodo monitoreando la cadena de Zcash. El trading nativo de ZEC aún no ha comenzado, y THORChain dijo que la liquidez es superficial por ahora, así que está indicando a los usuarios que operen con cautela en los primeros días.
THORChain abre un pool de Zcash; los intercambios de ZEC aún no están en vivo
THORChain activó un pool de liquidez de Zcash (ZEC) el 2 de octubre de 2026, horas después de completar una rotación de nodos en la que cada nodo comenzó a vigilar la cadena de Zcash. El protocolo dijo que el pool ya está en funcionamiento, pero que “el trading es el siguiente paso”, y no dio una hora de inicio firme ni una cifra de profundidad del pool, según Crypto.news.
THORChain lanzó su pool de liquidez de Zcash (ZEC) el 2 de octubre de 2026, después de que una rotación de nodos dejó a cada nodo monitoreando la cadena de Zcash. El trading nativo de ZEC aún no ha comenzado, y THORChain dijo que la liquidez es superficial por ahora, así que está indicando a los usuarios que operen con cautela en los primeros días.
1
770
·
--
Artículo
El exploit de un adaptador de Aave de terceros drena 114 ETH de los SafesBitcoinWorld
El exploit de un adaptador Aave de terceros drena 114 ETH de los Safes
Un atacante drenó aproximadamente 114,09 ETH — valorados en unos $305.000 — de dos carteras multisig Safe el 2 de octubre al explotar una vulnerabilidad de control de acceso en un adaptador de terceros construido sobre Aave v3, según Cryptoslate. La firma de seguridad blockchain SlowMist atribuyó la pérdida al FlashLoopAdapter, un módulo usado para abrir y cerrar posiciones apalancadas de Aave v3 a través de carteras Safe, mientras que los contratos propios de Aave no fueron afectados.
Los contratos inteligentes principales de Aave v3 no se vieron afectados. SlowMist dijo que el atacante comprometió dos carteras multisig Safe mediante una falla en el FlashLoopAdapter de terceros, eludiendo su comprobación de autenticación para drenar aproximadamente 114,09 ETH, o alrededor de $305.000. El fundador de Aave, Stani Kulechov, confirmó que el incidente implicó infraestructura externa construida sobre Aave, no el propio protocolo.
El exploit de un adaptador de Aave de terceros drena 114 ETH de los Safes
BitcoinWorld
El exploit de un adaptador Aave de terceros drena 114 ETH de los Safes
Un atacante drenó aproximadamente 114,09 ETH — valorados en unos $305.000 — de dos carteras multisig Safe el 2 de octubre al explotar una vulnerabilidad de control de acceso en un adaptador de terceros construido sobre Aave v3, según Cryptoslate. La firma de seguridad blockchain SlowMist atribuyó la pérdida al FlashLoopAdapter, un módulo usado para abrir y cerrar posiciones apalancadas de Aave v3 a través de carteras Safe, mientras que los contratos propios de Aave no fueron afectados.
Los contratos inteligentes principales de Aave v3 no se vieron afectados. SlowMist dijo que el atacante comprometió dos carteras multisig Safe mediante una falla en el FlashLoopAdapter de terceros, eludiendo su comprobación de autenticación para drenar aproximadamente 114,09 ETH, o alrededor de $305.000. El fundador de Aave, Stani Kulechov, confirmó que el incidente implicó infraestructura externa construida sobre Aave, no el propio protocolo.
El exploit de un adaptador Aave de terceros drena 114 ETH de los Safes
Un atacante drenó aproximadamente 114,09 ETH — valorados en unos $305.000 — de dos carteras multisig Safe el 2 de octubre al explotar una vulnerabilidad de control de acceso en un adaptador de terceros construido sobre Aave v3, según Cryptoslate. La firma de seguridad blockchain SlowMist atribuyó la pérdida al FlashLoopAdapter, un módulo usado para abrir y cerrar posiciones apalancadas de Aave v3 a través de carteras Safe, mientras que los contratos propios de Aave no fueron afectados.
Los contratos inteligentes principales de Aave v3 no se vieron afectados. SlowMist dijo que el atacante comprometió dos carteras multisig Safe mediante una falla en el FlashLoopAdapter de terceros, eludiendo su comprobación de autenticación para drenar aproximadamente 114,09 ETH, o alrededor de $305.000. El fundador de Aave, Stani Kulechov, confirmó que el incidente implicó infraestructura externa construida sobre Aave, no el propio protocolo.
464
·
--
Artículo
Evernorth gana la votación de los accionistas para debutar en Nasdaq con 473M XRPBitcoinWorld
Evernorth gana la votación de los accionistas para debutar en Nasdaq con 473M XRP
El plan de Evernorth para cotizar en Nasdaq dio este jueves su último gran paso, ya que los accionistas de la empresa de adquisición con fines específicos (SPAC) Armada Acquisition Corp. II aprobaron su propuesta de combinación de negocios, informó Cointelegraph. La votación despeja el último obstáculo antes del cierre esperado de la operación el 7 de octubre, con acciones listas para empezar a cotizar al día siguiente bajo el ticker XRPN, sujeto a las condiciones de cierre restantes.
La fusión de Evernorth con Armada Acquisition Corp. II obtuvo la aprobación de los accionistas, allanando el camino para que la empresa combinada cotice en Nasdaq bajo el ticker XRPN. Se espera que el acuerdo se cierre el 7 de octubre, y Evernorth prevé mantener aproximadamente 473 millones de XRP, una tesorería valorada en unos 710 millones de dólares a precios actuales. Datos clave
Evernorth gana la votación de los accionistas para debutar en Nasdaq con 473M XRP
BitcoinWorld
Evernorth gana la votación de los accionistas para debutar en Nasdaq con 473M XRP
El plan de Evernorth para cotizar en Nasdaq dio este jueves su último gran paso, ya que los accionistas de la empresa de adquisición con fines específicos (SPAC) Armada Acquisition Corp. II aprobaron su propuesta de combinación de negocios, informó Cointelegraph. La votación despeja el último obstáculo antes del cierre esperado de la operación el 7 de octubre, con acciones listas para empezar a cotizar al día siguiente bajo el ticker XRPN, sujeto a las condiciones de cierre restantes.
La fusión de Evernorth con Armada Acquisition Corp. II obtuvo la aprobación de los accionistas, allanando el camino para que la empresa combinada cotice en Nasdaq bajo el ticker XRPN. Se espera que el acuerdo se cierre el 7 de octubre, y Evernorth prevé mantener aproximadamente 473 millones de XRP, una tesorería valorada en unos 710 millones de dólares a precios actuales. Datos clave
Evernorth gana la votación de los accionistas para debutar en Nasdaq con 473M XRP
El plan de Evernorth para cotizar en Nasdaq dio este jueves su último gran paso, ya que los accionistas de la empresa de adquisición con fines específicos (SPAC) Armada Acquisition Corp. II aprobaron su propuesta de combinación de negocios, informó Cointelegraph. La votación despeja el último obstáculo antes del cierre esperado de la operación el 7 de octubre, con acciones listas para empezar a cotizar al día siguiente bajo el ticker XRPN, sujeto a las condiciones de cierre restantes.
La fusión de Evernorth con Armada Acquisition Corp. II obtuvo la aprobación de los accionistas, allanando el camino para que la empresa combinada cotice en Nasdaq bajo el ticker XRPN. Se espera que el acuerdo se cierre el 7 de octubre, y Evernorth prevé mantener aproximadamente 473 millones de XRP, una tesorería valorada en unos 710 millones de dólares a precios actuales. Datos clave
512
Inicia sesión para explorar más contenidos
Únete a usuarios de criptomonedas de todo el mundo en Binance Square
⚡️ Obtén la información más reciente y útil sobre criptomonedas.
💬 Confía en el mayor exchange de criptomonedas del mundo.
👍 Descubre opiniones reales de creadores verificados.
Correo electrónico/número de teléfono
Temas en tendencia
BinanceLaunchesBinanceIntelligence
461,184 visualizaciones
3,275 participa(n) en el debate
🚀 ¡La Inteligencia Artificial llega de forma directa al trading! 🚀
El ecosistema cripto acaba de dar su paso más ambicioso hacia la automatización accesible para todos.
Con el hashtag #BinanceLaunchesBinanceIntelligence, celebramos el lanzamiento oficial de Binance Intelligence, una nueva capa de IA integrada que viene a cerrar por completo la brecha del conocimiento financiero.
Ya seas un principiante o un trader algorítmico avanzado, esta suite de tres productos te ofrece herramientas de nivel institucional directamente en la app que usas todos los días:
Binance AI (Gratuito):
Una experiencia adaptativa que personaliza resúmenes de mercado (Market Briefs cada 4 horas) y alertas según tu nivel de conocimiento y portafolio.
Binance AI Pro:
Un agente financiero personal que transforma tus ideas en lenguaje natural en estrategias ejecutables de trading automatizado las 24/7.
Binance Agent OS:
La infraestructura ideal para desarrolladores que buscan conectar aplicaciones e IA directamente con las capacidades de la plataforma mediante APIs.
💡 Mi consejo de hoy:
Aprovechá estas herramientas para potenciar tus análisis técnicos, pero mantené siempre una correcta gestión de riesgo sin dejarte llevar por las emociones del mercado.
¿Qué herramienta tenés más ganas de probar primero?
¡Te leo en los comentarios! 👇
#BinanceLaunchesBinanceIntelligence #WriteToEarn #Crypto #Trading #BinanceAI#binancelaunchesbinanceintelligence
AlchemyS7
·5 «Me gusta»
·7.3k visualizaciones
BitcoinTargets2026OpenAt$87570
3,150 visualizaciones
84 participa(n) en el debate
BitcoinRejectedAt$87KThirdTime
2,944 visualizaciones
66 participa(n) en el debate