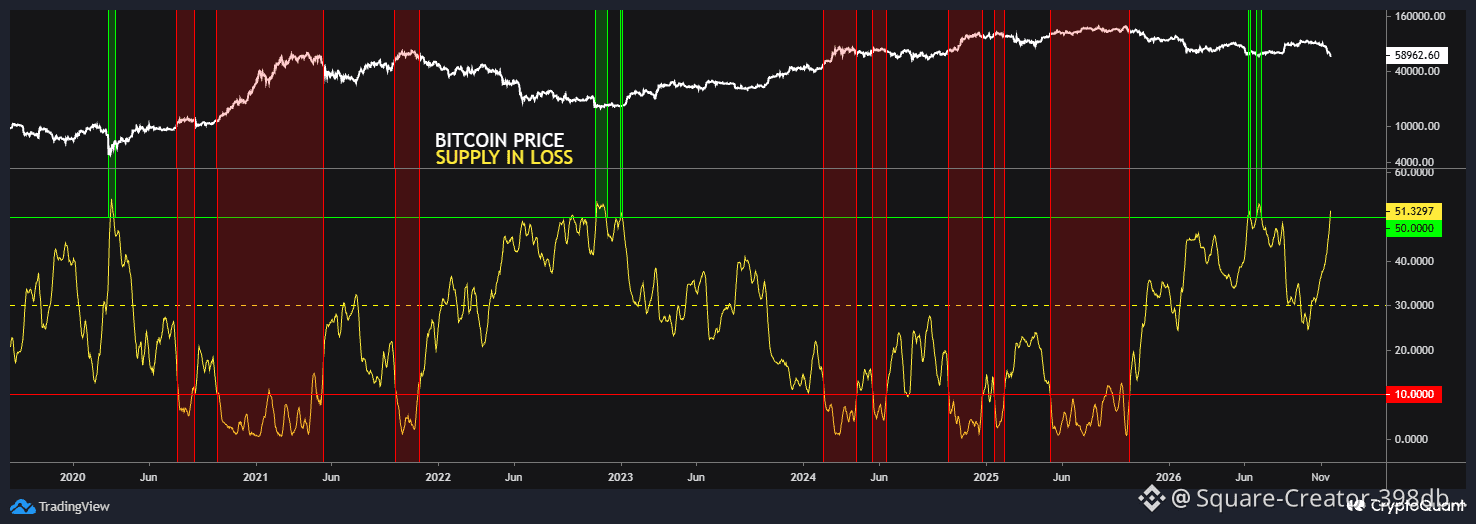
Supply in Loss MA7d in historic bottom🟩 region
The indicator reached 140-day high — re-entering historic bottom zone in 2026, located above 50%.
Most of #BTC supply is now in the red — this is a pattern that historically coincides with the formation of #Bitcoin bottom #BTC Price Analysis# #Macro Insights# #OnChainAnalysis $BTC
The indicator reached 140-day high — re-entering historic bottom zone in 2026, located above 50%.
Most of #BTC supply is now in the red — this is a pattern that historically coincides with the formation of #Bitcoin bottom #BTC Price Analysis# #Macro Insights# #OnChainAnalysis $BTC