
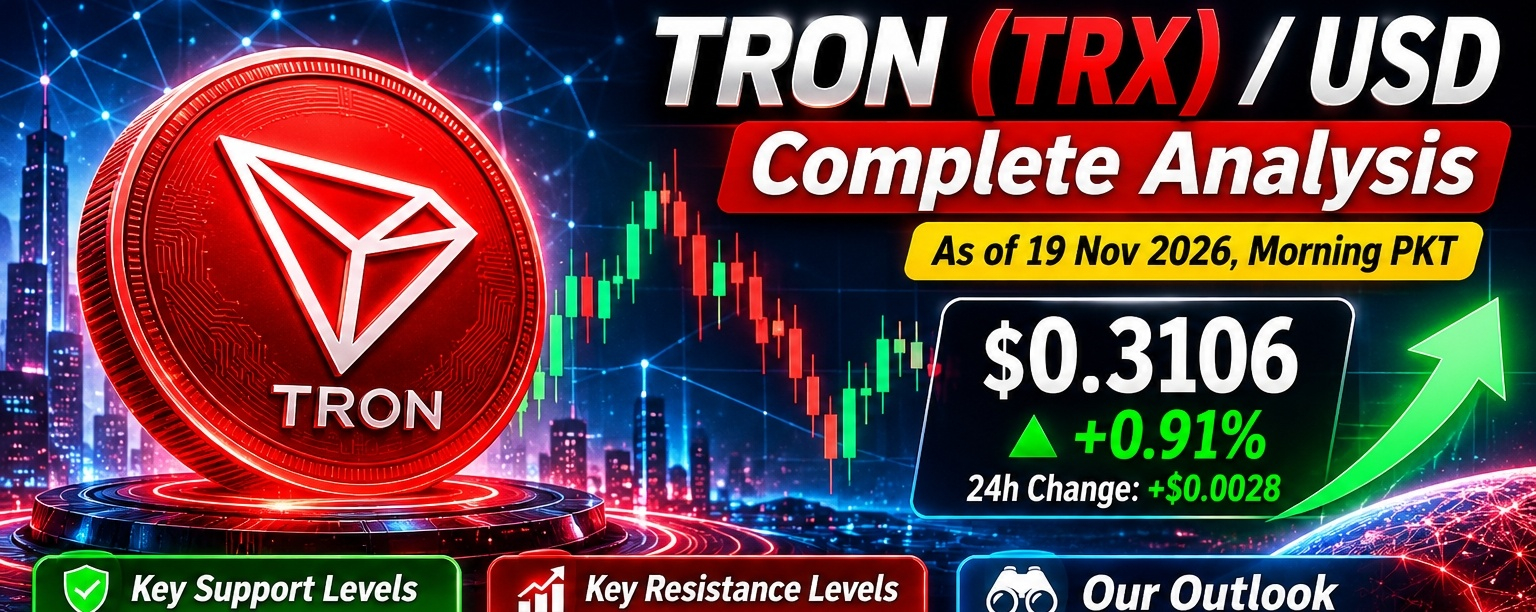

TRON ($TRX ) / USD - Complete Analysis 19 Nov 2026
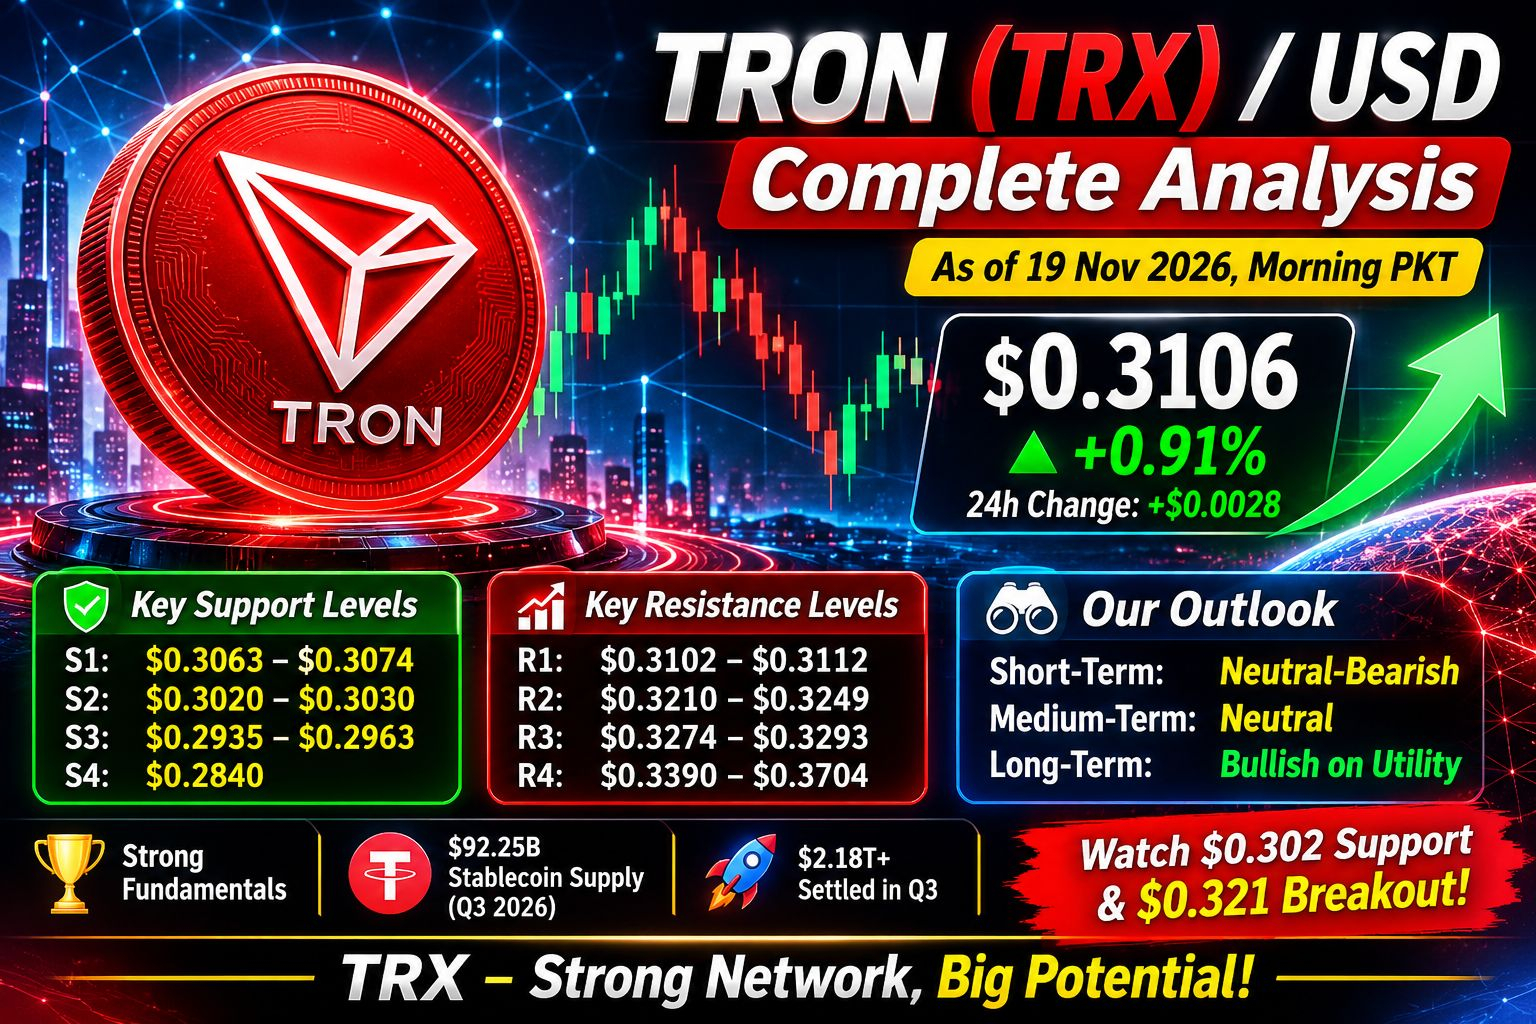
1. Live Snapshot
Current Price: ~$0.3106
24h Range: $0.3074 - $0.3112
24h Change: +0.91% [+0.0028]
24h Volume: ∼$280.69M
Market Cap: $29.35B - Rank #8
Circulating Supply: ∼95.04B TRX
Previous Close: $0.3078

Recent Daily Closes:
| Date | Open | High | Low | Close |
| --- | --- | --- | --- | --- |
| 18 Nov 2026 | $0.3081 | $0.3105 | $0.3074 | $0.3099 |
| 17 Nov 2026 | $0.3052 | $0.3087 | $0.3048 | $0.3081 |
| 16 Nov 2026 | $0.3053 | $0.3074 | $0.3023 | $0.3052 |
Price is holding just above $0.31 after 3 days of small green closes, but still in a tight consolidation range.
2. Performance
5 Days: -0.74%
1 Month: -6.71%
6 Months: -13.05%
Year-to-Date: +7.94%
1 Year: +8.02%
7 Days: -3.08% in earlier session, now recovering
Interpretation: TRX is outperforming on a yearly basis but underperforming short-term. It has lost momentum in the last 1-6 months despite strong network usage. This is classic TRX behaviour - strong fundamentals, slow price.
3. Technical Analysis
Overall Signal: Bearish-to-Neutral / Consolidation
| Indicator | Value | Signal |
| --- | --- | --- |
| RSI (14) | 38.8 - 39.3 | Bearish / Weak, but NOT oversold |
| MACD (12,26,9) | -0.0055 / -0.01 | Bearish, below zero |
| 1H RSI | 61.9 | Short-term bounce / Long |
| Price vs MAs | Below 7, 30, 200-day MAs | Bearish |
| 20-day EMA | ~$0.3223 | Price below it = resistance |
| 50 & 200-day EMA | ~$0.3274 aligned | Major resistance cluster |
TRX is trading below all major moving averages. The daily trend is still down, but the 1-hour chart shows a short-term relief bounce. RSI near 39 means sellers are tired but buyers have not taken control yet.
4. Key Levels to Watch
Support:
S1 - Immediate: $0.3063 - $0.3074
S2 - Strong / Psychological: $0.3020 - $0.3030
S3 - Breakdown: $0.2935 - $0.2963
S4 - Major: $0.2840
Resistance:
R1 - Immediate: $0.3102 - $0.3112
R2 - Key Breakout: $0.3210 - $0.3249
R3 - EMA Cluster: $0.3274 - $0.3293
R4 - Major: $0.3390 - $0.3704
The battle is $0.302 vs $0.321. Hold $0.302 = consolidation continues. Break $0.321 with volume = trend reversal. Lose $0.302 = drop toward $0.293.
### 5. Fundamentals - Why TRX Is Still Strong
This is where $ADA separates from most altcoins:
#1 Stablecoin Network: TRON overtook Ethereum for average USDT supply in Q3 2026. Average stablecoin supply hit a record $92.25B, with USDT alone at $90.75B vs Ethereum's $87.73B.
Massive Settlement: $2.18T - $2.21T settled in Q3 2026, capturing 73% of all stablecoin volume. Cumulative transaction value now exceeds $30T.
Revenue Leader: TRON generated 93% of tracked L1 + L2 network revenue in Q3.
New Catalyst - ETF: First U.S. spot staked TRX ETF launched in Q3 2026.
New Catalyst - DeFi: On 17 Nov 2026, Aave App announced support for USDT (TRC-20) deposits on TRON.
Use Case: Fast, low-cost transfers, especially for USDT in Asia, Africa, and Latin America. USDT is 98.5% of TRON's stablecoin supply.
Risk: Heavy dependence on $ETH . If USDT dominance falls or regulators target TRON / Justin Sun, TRX is exposed. Also, network success is NOT translating into TRX price yet.
6. Market Sentiment
Fear & Greed Index: 11 - Extreme Fear (whole crypto market)
AI Signal: Neutral 66%
Technical Sentiment: Strong Sell on daily, but Long on 1H
Extreme fear + price holding support often marks accumulation zones, but it can also precede one more flush down.
7. Price Prediction / Scenarios
These are model estimates, not guarantees - forecasts vary widely:
| Source / Period | Low | Base / Average | High |
| --- | --- | --- | --- |
| Nov-Dec 2026 | $0.2950 | $0.3180 | $0.3300 |
| End 2026 | $0.28 | $0.34 - $0.366 | $0.40 - $0.439 |
| 2027 | $0.27 - $0.30 | $0.385 - $0.42 | $0.46 - $0.60 |
| 2030 | - | $0.35 - $0.51 | $0.55+ |
Most conservative models see TRX stuck in $0.29 - $0.35 until it breaks $0.33. More bullish models project $0.38-$0.42 in 2027 if Bitcoin recovers and stablecoin usage keeps growing.
8. Trading Plan - 3 Scenarios
A) Bullish - Breakout
Trigger: Daily close above $0.321 with volume
Target 1: $0.329
Target 2: $0.339
Invalidation: Fall back below $0.311
B) Neutral - Range (Most Likely Now)
Range: $0.302 - $0.321
Strategy: Buy near $0.303-$0.306, sell near $0.318-$0.321
Stop-loss below $0.299
C) Bearish - Breakdown
Trigger: Daily close below $0.302
Target 1: $0.296
Target 2: $0.284
Invalidation: Reclaim $0.311 quickly
9. Verdict
Short-term (Days-Weeks): NEUTRAL-BEARISH
Price is below all MAs, MACD negative, RSI weak. Expect chop between $0.302-$0.321.
Medium-term (Months): NEUTRAL
Fundamentals are excellent, but price needs Bitcoin market recovery + a break above $0.327 to turn bullish.
Long-term (1-3 Years): BULLISH on Utility
If TRON keeps 70%+ stablecoin settlement share, TRX has real utility value that most altcoins don't. The risk is not technology, it's price not following usage.
Not financial advice. Crypto is highly volatile. Only risk what you can afford to lose, and use a stop-loss if you trade short-term.
Want me to make you a TRX buy/sell alert plan with exact entry, stop-loss and targets for spot vs futures, or a 1-week daily forecast?
#TRX #TRXUpdate #trxanalysis #TRXUSDT #CryptoSignals #LongTrade #FuturesTrading #BinanceFeed #ScalpSetup #MomentumTrade #Leverage15x #CryptoTamil #BreakoutSetup