

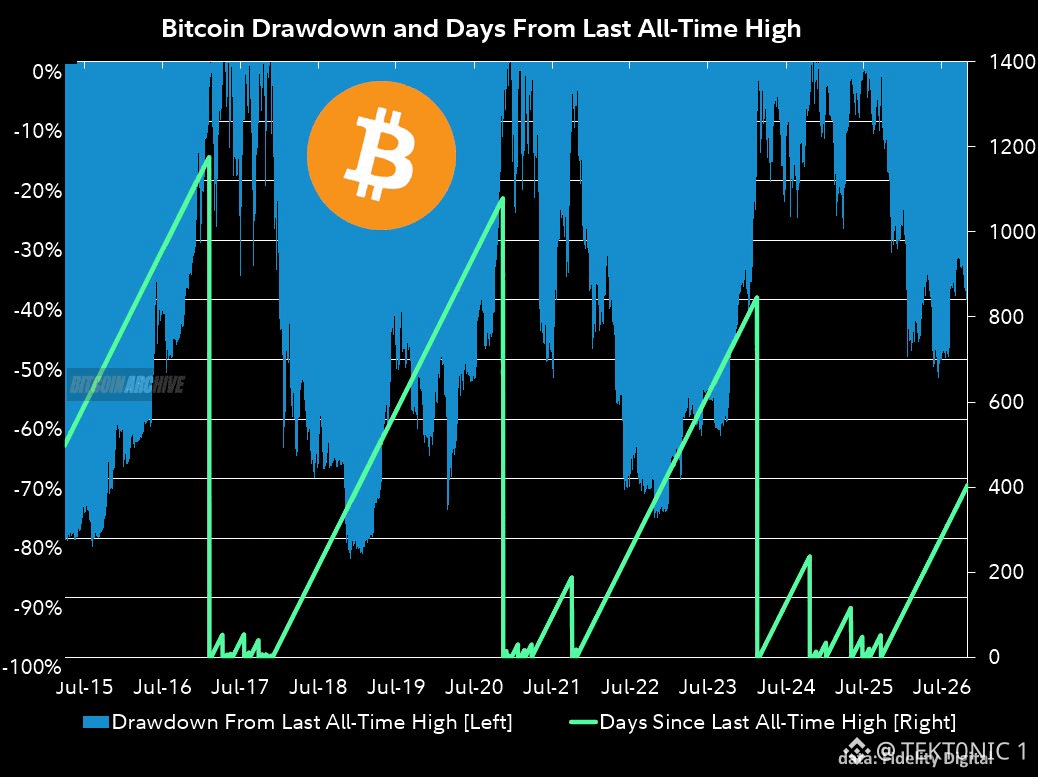
fidelity digital’s chris kuiper said the current bitcoin drawdown “isn’t that bad,” noting that the market has been here before and survived. the chart tracks drawdown from the last all-time high (blue area) and days since that high (green line). the present decline sits near 48–50%, a level the blue area has reached multiple times since 2015 without marking a cycle end. the green line shows roughly 400 days have passed since the prior peak, shorter than the multi-year stretches that followed the 2017 and 2021 tops. earlier drawdowns of similar depth in 2018, 2022, and 2024 were followed by recoveries once the days-since-ath metric reset. a 50% drawdown is painful in absolute terms, yet the historical data shows bitcoin has repeatedly traded at or below this level and later made new highs. the current combination of a moderate drawdown depth and a relatively short time since the last peak differs from the longer, deeper bear markets of prior cycles. kuiper’s comment aligns with the chart’s pattern of prior survivals at comparable drawdown percentages. the data places the latest decline inside the range of previous corrections rather than at an extreme. sentiment can remain bearish while the drawdown itself stays within historical norms. the chart and the fidelity remark both frame the present move as one the market has already experienced and moved past. #BTC Price Analysis# #Bitcoin Price Prediction: What is Bitcoins next move?# #Macro Insights# $BTC $ETH
Únete a usuarios de criptomonedas de todo el mundo en Binance Square
⚡️ Obtén la información más reciente y útil sobre criptomonedas.
💬 Confía en el mayor exchange de criptomonedas del mundo.
👍 Descubre opiniones reales de creadores verificados.
Correo electrónico/número de teléfono