


Key Highlights
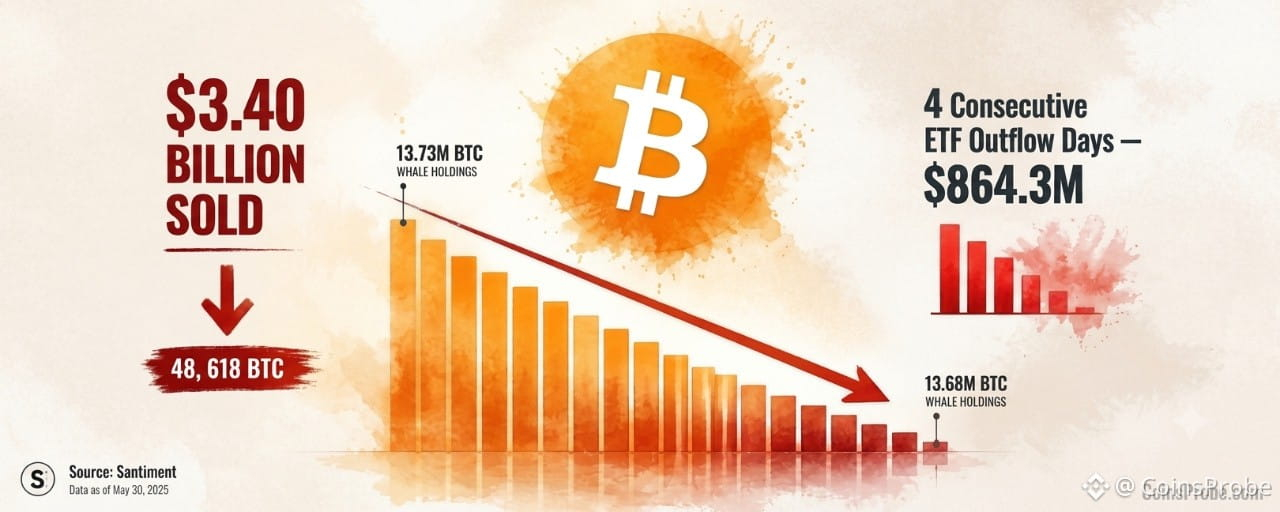
Bitcoin whales sold or redistributed 48,618 BTC — worth $3.40B — over the past two weeks per Santiment data via an on-chain analyst
Spot BTC ETFs recorded 4 consecutive outflow days totaling $864.3M with zero inflow days, led by IBIT at -$143.5M per SoSoValue
Santiment whale holdings chart shows trend from 13.73M BTC down to 13.68M BTC — most recent bars at the lowest level in the visible range
Markets price 67.1% probability of a Fed rate hike by January 2027 — macro backdrop adds pressure to near-term BTC positioning
Bitcoin is trading at approximately $64,597 — up just 0.09% in the past 24 hours — as on-chain data reveals a sustained and significant redistribution event that has quietly drained $3.40 billion worth of BTC from large-entity wallets. The selling pressure is not a one-day event. It has been building for two full weeks with no sign of reversal.
An on-chain analyst flagged the data on November 16, 2026, drawing directly from Santiment’s whale tracking metrics. The finding is unambiguous: large entities have sold or redistributed 48,618 BTC over the past two weeks. “The selling hasn’t stopped yet,” the analyst wrote — a declarative conclusion, not a hedge.
48,618 BTC — The Scale of the Distribution
At current prices, 48,618 BTC represents approximately $3.40 billion in realized or redistributed value. This is not a single transaction or a one-off wallet shuffle. Santiment’s on-chain data tracks the aggregate holdings of large entities — wallets holding significant BTC balances — and the chart shared shows a clear, sustained downward trend in those holdings across the two-week window from roughly day 7 through day 16 of November.
The chart records whale holdings moving from the 13.73M BTC zone down toward the 13.68M BTC zone, a decline of approximately 50,000 BTC across the tracked cohort. The most recent bars on the chart — corresponding to the latest data point — sit at the lowest level in the visible range, confirming that the distribution has not plateaued. The trend is still descending.
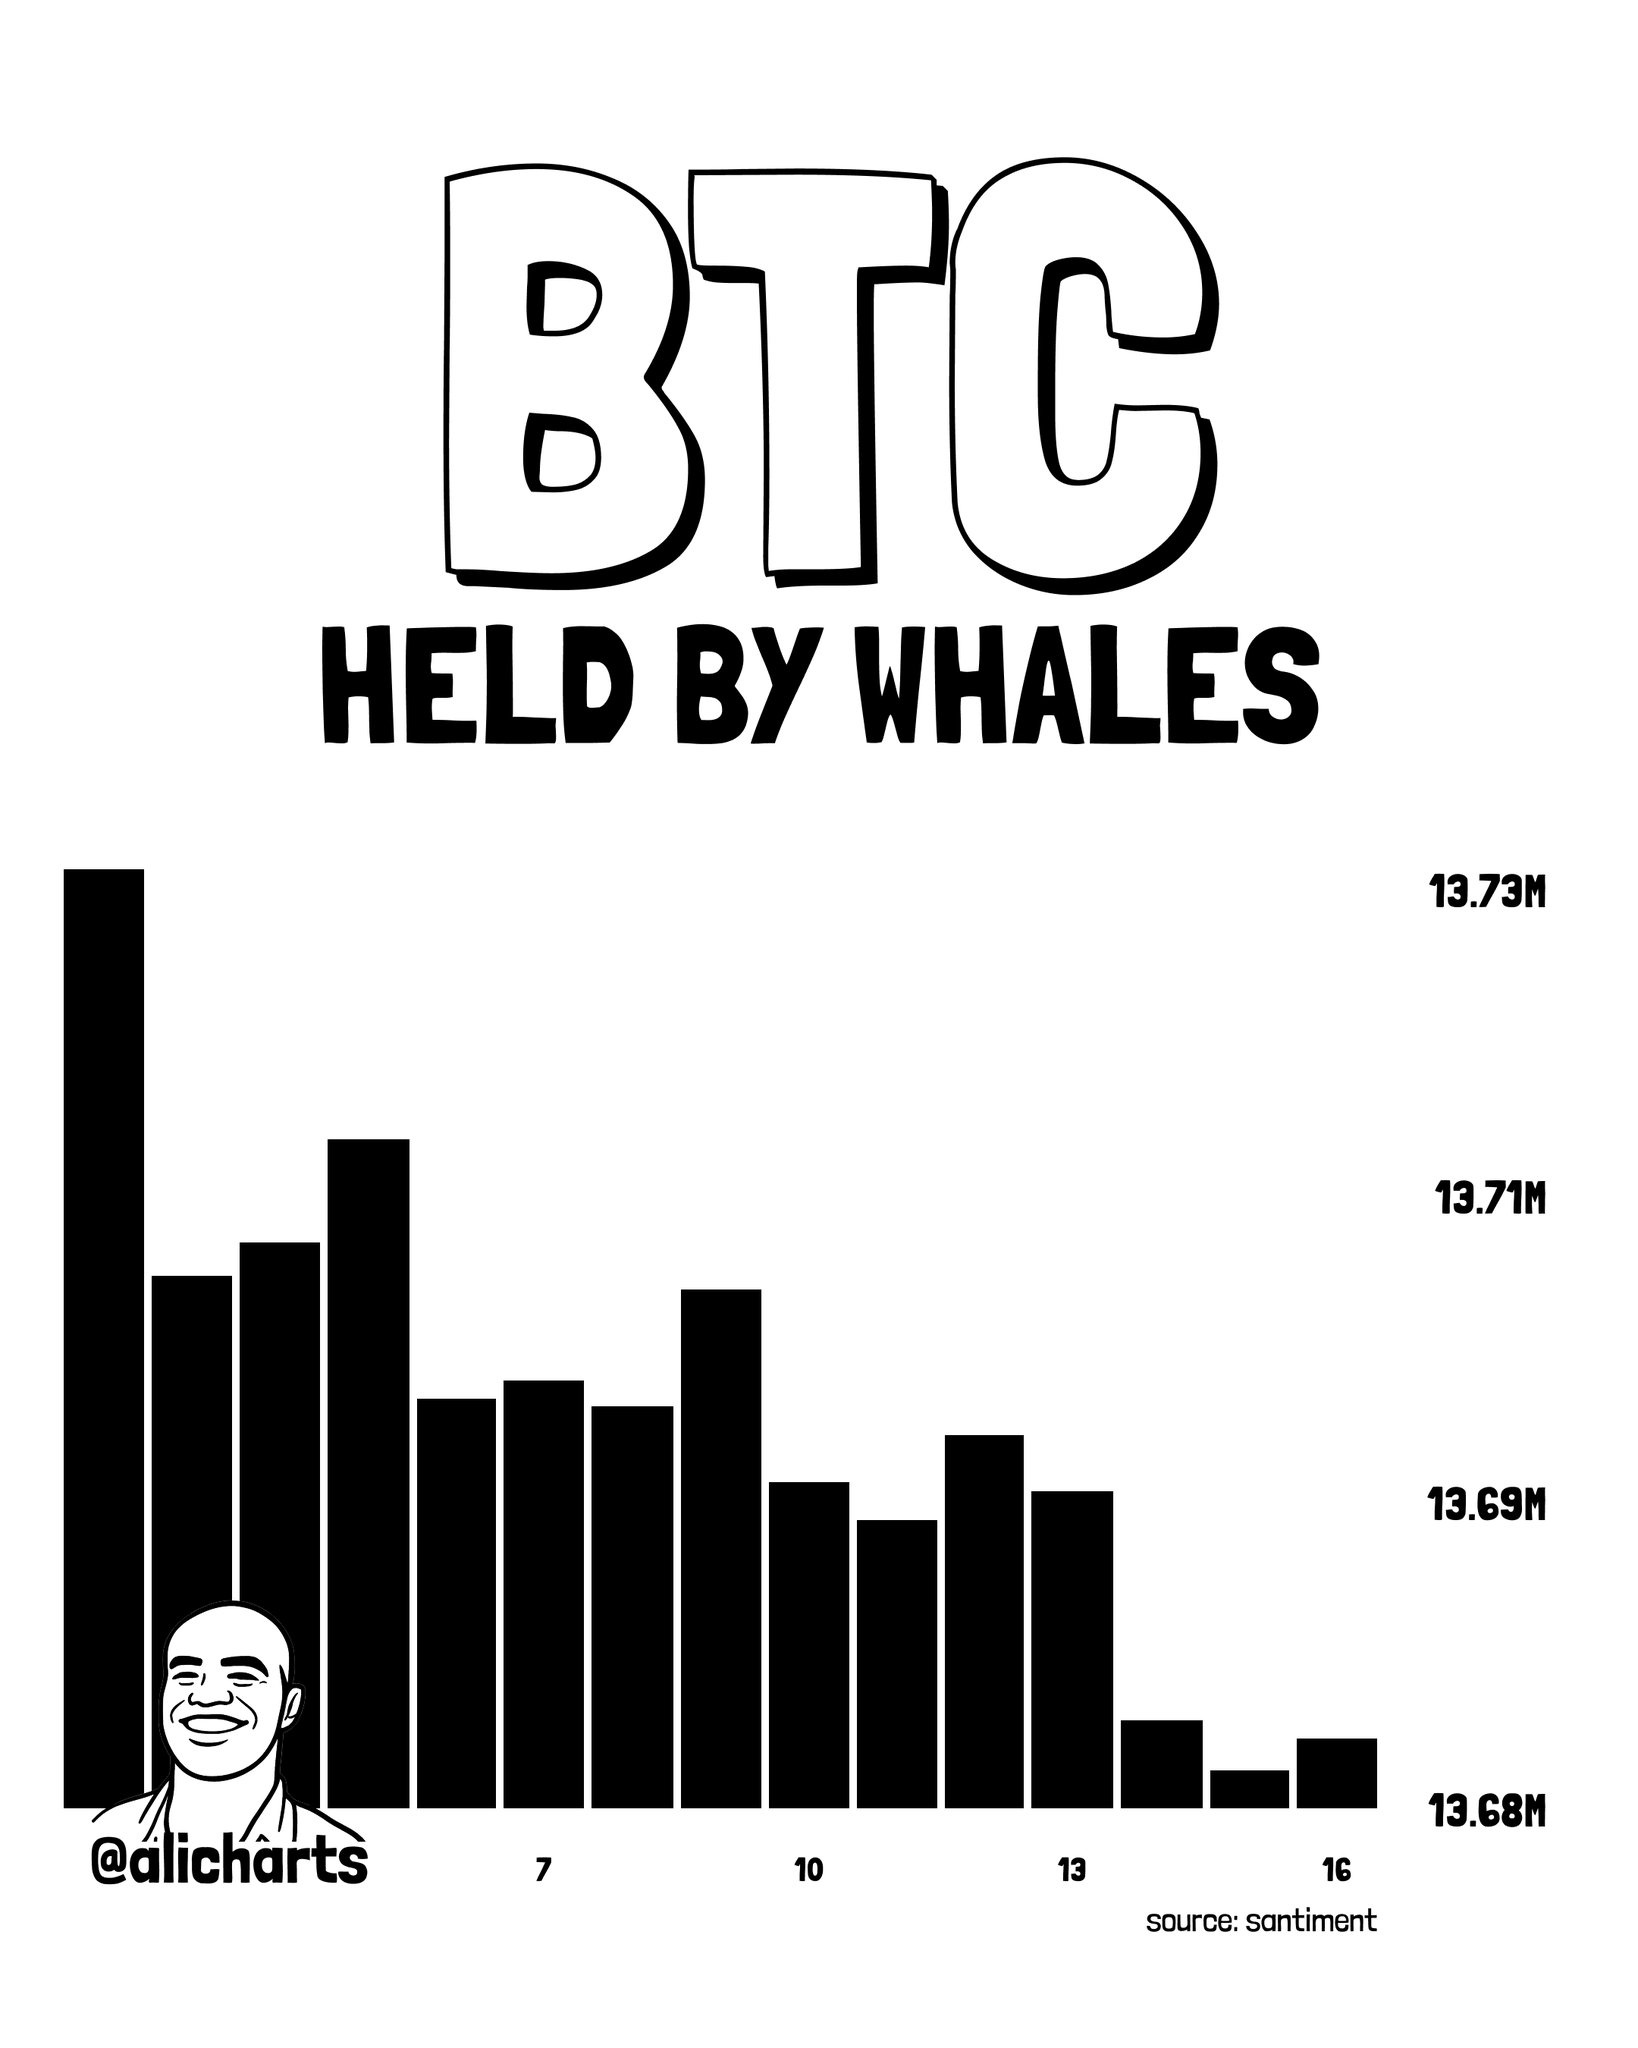
BTC Held by Whales — Chart Analysis | Source: @alicharts (X)
This matters because whale behavior in Bitcoin historically precedes broader price movement. When large entities reduce exposure over a sustained two-week window — not a spike, not a one-day flush — it signals deliberate portfolio repositioning, not a knee-jerk reaction to intraday volatility.
ETF Outflows Corroborate the On-Chain Signal
The whale distribution does not exist in isolation. Spot Bitcoin ETF data via SoSoValue shows four consecutive days of net outflows totaling $864.3 million as of November 13, 2026. There were zero inflow days across that four-day streak.
ETF Fund Daily Outflow AUM IBIT (BlackRock) -$143.5M $53.99B FBTC (Fidelity) -$11.3M $11.24B GBTC (Grayscale) -$34.6M $7.97B All Funds (Combined) -$185.5M $86.20B
Spot BTC ETF daily flow breakdown | Source: SoSoValue
IBIT alone accounted for $143.5 million of the latest daily outflow — the dominant fund in the ecosystem showing the largest single-day exit. Combined with four straight days of aggregate outflows, the institutional picture aligns with the on-chain signal: large holders, whether on-chain whales or ETF-accessing institutions, are reducing BTC exposure simultaneously.
Total ETF net assets stand at $86.20 billion, with cumulative net inflows since launch at $54.63 billion — meaning the structural inflow base remains intact, but the near-term flow direction has turned negative.
Strategy Holds — But the Broader Whale Cohort Is Selling
One important counterpoint: Strategy (formerly MicroStrategy) added 485 BTC for $33.4 million in its latest purchase, bringing total holdings to 850,849 BTC as of November 16, 2026. Over the past three weeks, Strategy acquired 2,332 BTC for $180.8 million, per SoSoValue data.
Strategy’s accumulation represents a single, well-documented corporate buyer with a defined treasury mandate. The Santiment whale data tracks a broader cohort of large on-chain entities. These are two different pools. Strategy’s buying does not offset the distribution signal — it simply means one large buyer is absorbing some of what a larger group is selling. The net on-chain direction, per the two-week data, remains redistributive.
This dynamic — one institutional anchor buying while broader whale cohorts reduce — is worth monitoring closely in the sessions ahead. For context on how technical signals have been behaving during similar distribution windows, the NEAR TD Sequential ‘9’ buy signal after a 39% drop illustrates how momentum exhaustion signals interact with broader market selling pressure.
Macro Backdrop — FOMC and Key Data Events
Markets currently price a high probability of a rate hike at the December 9, 2026 FOMC meeting, with the federal funds rate expected to rise from the current 3.75%–4.00% range to 4.00%–4.25%. The January 27, 2027 meeting shows a roughly 67–71% probability of a further hike to 4.25%–4.50%. Upcoming data releases that could shift this outlook include Retail Sales on November 17, GDP and Core PCE on November 25, Nonfarm Payrolls on December 4, and CPI on December 10.
What This Data Confirms — And What It Doesn’t
The Santiment data confirms that 48,618 BTC has left large-entity wallets over a two-week window ending November 16. It confirms the trend has not reversed. It confirms that the most recent data point sits at the lowest level in the visible range — meaning the distribution is ongoing, not historical.
What it does not confirm: a specific price target to the downside, a timeline for when selling will exhaust, or whether this distribution is profit-taking from prior cycle highs versus structurally bearish conviction. Distribution can precede a sharp decline. It can also precede a consolidation followed by resumption. The data is a warning, not a verdict.
What to watch: Santiment’s daily large-entity holdings update. If the bar chart begins to flatten — holdings stabilizing rather than declining — that is the first signal that the distribution wave is absorbing. Until that flattening appears, the two-week trend remains intact. Watch the $64,000 level as near-term support; a sustained loss of that zone on meaningful volume would be consistent with the distribution signal finding a price impact.
The on-chain signal is clear: $3.40 billion redistributed over two weeks, 48,618 BTC out of large-entity wallets, and four consecutive days of ETF outflows totaling $864.3 million — all pointing in the same direction. The analyst’s conclusion requires no embellishment: the selling hasn’t stopped yet.
Disclaimer: The views and analysis presented in this article are for informational purposes only and reflect the author’s perspective, not financial advice. Technical patterns and indicators discussed are subject to market volatility and may or may not yield the anticipated results. Investors are advised to exercise caution, conduct independent research, and make decisions aligned with their individual risk tolerance.