



Date: November 17, 2026
Bitcoin is approaching a crucial decision point after experiencing significant selling pressure. BTC has dropped sharply from the $74,000 region and is currently trading around $65,000, putting the market at an important support zone.
The big question is: Is Bitcoin preparing for a recovery, or will sellers push the price toward $63,500 and potentially lower?
Let's examine the technical structure, momentum indicators, market sentiment, liquidity, and possible trading opportunities.
📊 1. BTC Daily Chart Analysis
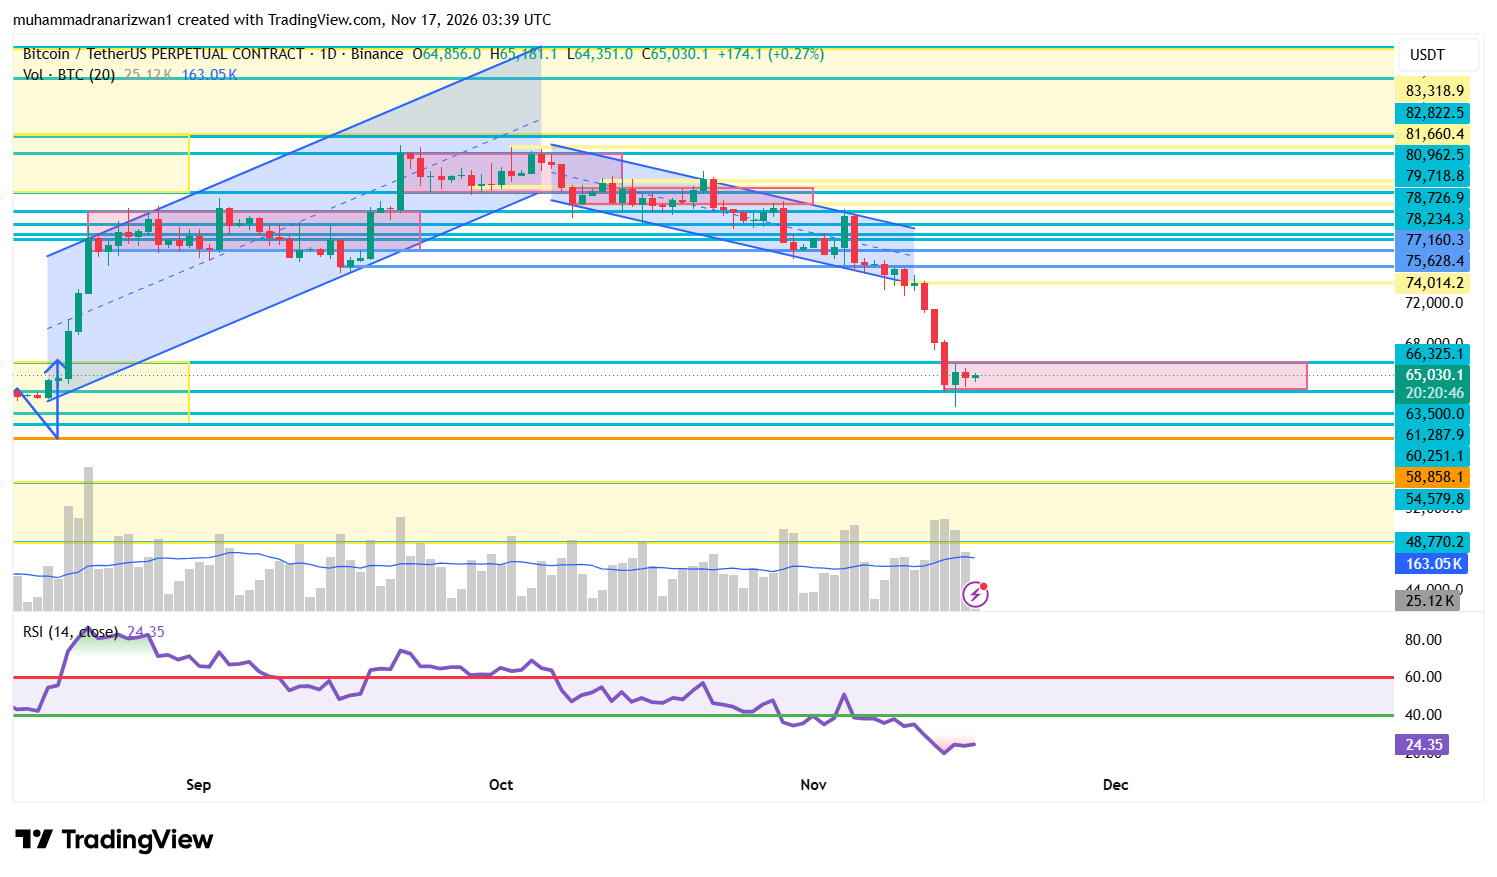
Bitcoin's daily chart currently shows a clear bearish structure.
After failing to maintain its position inside the previous descending resistance channel, BTC experienced a strong downward move. The price broke several important support levels and is now consolidating near $65,000.
Important observations:
BTC has experienced a sharp bearish breakdown.
The previous descending channel confirms selling pressure.
Price is trading below several previous support levels, which may now act as resistance.
The current $63,500–$66,325 region is an important decision zone.
Buyers need to reclaim higher resistance levels before a stronger recovery can be confirmed.
As long as BTC remains below $66,325, the broader daily structure remains weak.
📉 2. RSI Analysis – Bitcoin Is Oversold
One of the most important indicators right now is the Relative Strength Index (RSI).
Current readings from the chart:
Daily RSI: 24.35
Market momentum: Strongly bearish
Oversold condition: Yes
An RSI below 30 generally indicates oversold conditions.
This suggests that selling pressure has become extreme and a temporary relief bounce is possible.
However, remember:
Oversold does not automatically mean bullish.
Bitcoin can remain oversold during a strong downtrend. Traders should wait for bullish price action and confirmation before opening aggressive long positions.
💰 3. Market Sentiment and Liquidity Analysis
The Daily Watching report provides several important market observations:
Crypto Fear & Greed Index: 12 – Extreme Fear.
Crypto market capitalization: Approximately $2.19 trillion.
Crypto average RSI: 41.04.
US BTC Spot ETF daily net flow: -$68.51 million.
Bitcoin treasury weekly net inflow: +$51.86 million.
Bitcoin treasury holdings: 1,171,317 BTC.
BTC open interest: Approximately $42.15 billion.
BTC funding rate: 0.0063%.
These indicators present a mixed picture.
Extreme fear and negative ETF flows suggest that institutional demand and overall market sentiment remain under pressure.
On the other hand, Bitcoin treasury accumulation and deeply oversold technical conditions could help support a recovery if buyers return.
🎯 4. Important Bitcoin Support and Resistance Levels
These are the key price levels to monitor today.
Major Support Levels:
$63,500 – Immediate critical support.
$61,287 – Next important downside level.
$60,251 – Additional support.
$58,858 – Major lower support zone.
Major Resistance Levels:
$66,077 – Important liquidity and recovery target.
$66,325 – Immediate resistance.
$74,014 – Major overhead resistance.
$75,628 – Next resistance.
$77,160 – Higher resistance zone.
A sustained recovery above $66,325 would improve the short-term outlook.
However, a confirmed daily breakdown below $63,500 could open the door toward $61,287 and $60,251.
🔍 5. Bitcoin Next Move – Bullish or Bearish?
There are two possible scenarios.
Scenario 1: Bullish Recovery
If Bitcoin successfully holds the $63,500 support zone and buying pressure increases, BTC could attempt a recovery toward:
$66,077
$66,325
Higher resistance levels if bullish momentum continues.
A strong daily close above $66,325 would provide a better bullish confirmation.
Scenario 2: Bearish Continuation
If BTC fails to hold $63,500 and confirms a breakdown below this level, selling pressure could increase.
Potential downside targets:
$61,287
$60,251
$58,858
A breakdown followed by a failed retest would strengthen the bearish continuation setup.
📈 6. BTC/USDT Trading Signal
Primary Setup: SHORT – Conditional Breakdown
Exchange: Binance
Pair: BTC/USDT Perpetual
Trade Setup: Short
Entry Zone: $63,300–$63,500 (only after confirmed breakdown and failed retest)
Leverage: 3x–5x maximum
Take Profit 1: $61,287
Take Profit 2: $60,251
Take Profit 3: $58,858
Stop Loss: $64,400
Risk Management: Risk only 1% of trading capital.
Technical Confirmation:
Daily trend remains bearish.
Price has broken the previous descending structure.
Daily RSI is deeply oversold.
$63,500 is the key support to monitor.
A failed retest below support could provide a short opportunity.
Important: Do not open a short position directly into support. Wait for a confirmed breakdown and retest. If BTC holds support and reclaims $66,325, avoid this short setup.
🧠 7. Final Market Outlook
Bitcoin is currently at a critical turning point.
The daily trend remains bearish, but the deeply oversold RSI suggests that a short-term recovery cannot be ignored.
My approach today is to remain cautious and let price action confirm the next move.
Below $63,500: Bearish continuation becomes more likely.
Above $66,325: Recovery momentum improves.
Until one of these levels gives a convincing confirmation, patience is more important than forcing a trade.
The market is offering opportunities, but capital protection should always come first.
📢 Follow for daily BTC market analysis, technical breakdowns, and professional trading setups.
⚠️ Disclaimer: This analysis is for educational purposes only and is not financial advice. Cryptocurrency trading involves significant risk. Always use proper risk management, DYOR, and never risk more than you can afford to lose.
#bitcoin #BTCUSDT.P #BitcoinAnalysis #CryptoTradingInsights #BinanceSquareTalks