DAILY SIGNAL — SOL/USDT
Date: 10 Nov 2026
Chart Time: 01:25 UTC+8
Timeframe: 1m
Intraday Bias: Bearish pressure → support test → potential continuation
---
📊 MARKET BIAS
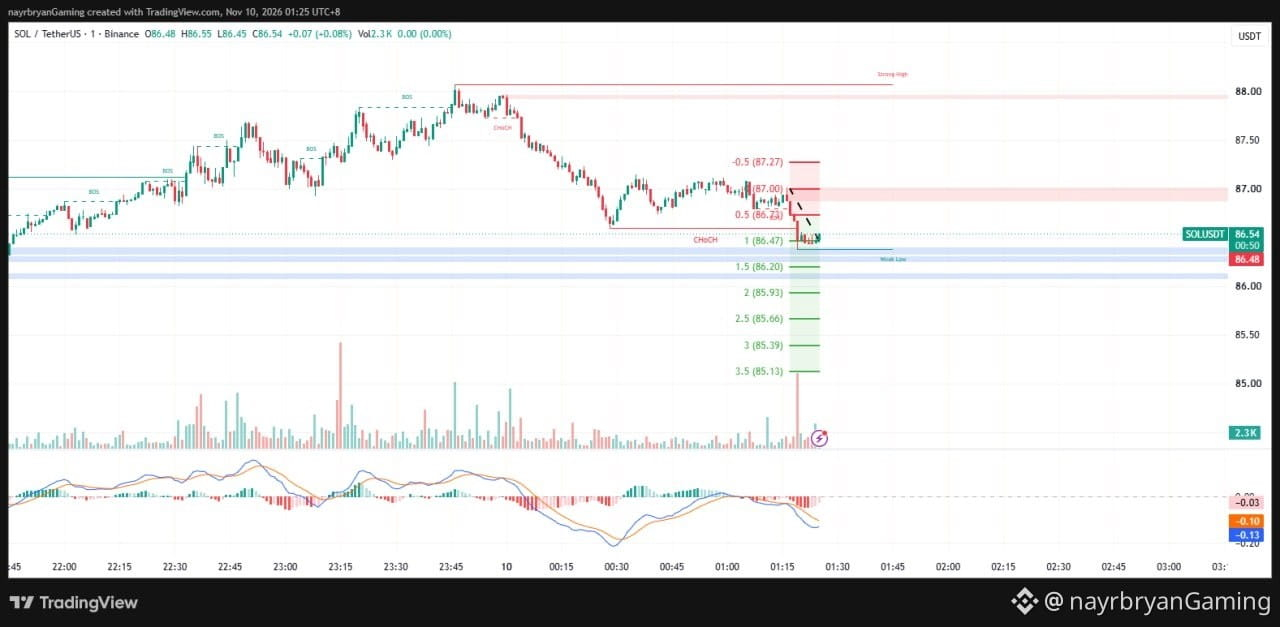
SOL continues to experience short-term bearish pressure following a rejection from the upper region around 88.00.
Price has gradually declined, forming lower highs and lower lows before reaching the current support area around 86.47–86.54.
The latest candles show price attempting to stabilize near the lower blue support zone.
However, bearish momentum remains relevant, with MACD positioned below the zero line.
The immediate question is whether buyers can defend the 86.47 support or sellers will extend the downside movement toward the lower Fibonacci extensions.
A confirmed breakdown could expose 86.20 → 85.93 → 85.66.
A successful recovery above nearby resistance could weaken the immediate bearish structure.
---
🔹 KEY LEVELS FROM CHART
Current Price:
86.54
Immediate Resistance:
86.72
Key Resistance:
87.00
Upper Resistance Reference:
87.27
Immediate Support:
86.47
Lower Support Zone:
86.40–86.20
Major Downside References:
85.93–85.66
---
🎯 FIBONACCI LEVELS
Upper References:
87.27 → -0.5 Fib
87.00 → 0 Fib
86.72 → 0.5 Fib
Downside Extensions:
TP1 → 86.47 (1.0 Fib)
TP2 → 86.20 (1.5 Fib)
TP3 → 85.93 (2.0 Fib)
TP4 → 85.66 (2.5 Fib)
TP5 → 85.39 (3.0 Fib)
TP6 → 85.13 (3.5 Fib)
---
📈 TECHNICAL BREAKDOWN
1. Price Structure
SOL has experienced a broader intraday decline from the 88.00 region.
The market subsequently formed lower highs and continued to trade beneath previous resistance levels.
.
---
🧠 QUICK INSIGHT
"Support is not guaranteed to hold. Confirmation determines whether a reaction becomes a reversal or another continuation."
---
⚠️ DISCLAIMER
This is personal market analysis, not financial advice.
This chart framework is for educational purposes only.
Always DYOR / DYODD, manage risk properly, and avoid emotional trading.
— @nayrbryanGaming
#SOL #SOLUSDT #Crypto #Trading #TechnicalAnalysis #PriceAction #SmartMoney #Fibonacci #Binance #MACD
Date: 10 Nov 2026
Chart Time: 01:25 UTC+8
Timeframe: 1m
Intraday Bias: Bearish pressure → support test → potential continuation
---
📊 MARKET BIAS
SOL continues to experience short-term bearish pressure following a rejection from the upper region around 88.00.
Price has gradually declined, forming lower highs and lower lows before reaching the current support area around 86.47–86.54.
The latest candles show price attempting to stabilize near the lower blue support zone.
However, bearish momentum remains relevant, with MACD positioned below the zero line.
The immediate question is whether buyers can defend the 86.47 support or sellers will extend the downside movement toward the lower Fibonacci extensions.
A confirmed breakdown could expose 86.20 → 85.93 → 85.66.
A successful recovery above nearby resistance could weaken the immediate bearish structure.
---
🔹 KEY LEVELS FROM CHART
Current Price:
86.54
Immediate Resistance:
86.72
Key Resistance:
87.00
Upper Resistance Reference:
87.27
Immediate Support:
86.47
Lower Support Zone:
86.40–86.20
Major Downside References:
85.93–85.66
---
🎯 FIBONACCI LEVELS
Upper References:
87.27 → -0.5 Fib
87.00 → 0 Fib
86.72 → 0.5 Fib
Downside Extensions:
TP1 → 86.47 (1.0 Fib)
TP2 → 86.20 (1.5 Fib)
TP3 → 85.93 (2.0 Fib)
TP4 → 85.66 (2.5 Fib)
TP5 → 85.39 (3.0 Fib)
TP6 → 85.13 (3.5 Fib)
---
📈 TECHNICAL BREAKDOWN
1. Price Structure
SOL has experienced a broader intraday decline from the 88.00 region.
The market subsequently formed lower highs and continued to trade beneath previous resistance levels.
.
---
🧠 QUICK INSIGHT
"Support is not guaranteed to hold. Confirmation determines whether a reaction becomes a reversal or another continuation."
---
⚠️ DISCLAIMER
This is personal market analysis, not financial advice.
This chart framework is for educational purposes only.
Always DYOR / DYODD, manage risk properly, and avoid emotional trading.
— @nayrbryanGaming
#SOL #SOLUSDT #Crypto #Trading #TechnicalAnalysis #PriceAction #SmartMoney #Fibonacci #Binance #MACD