

ETH Technical Outlook: Ethereum Struggles Below $2,385 as Key Support Remains Under Pressure
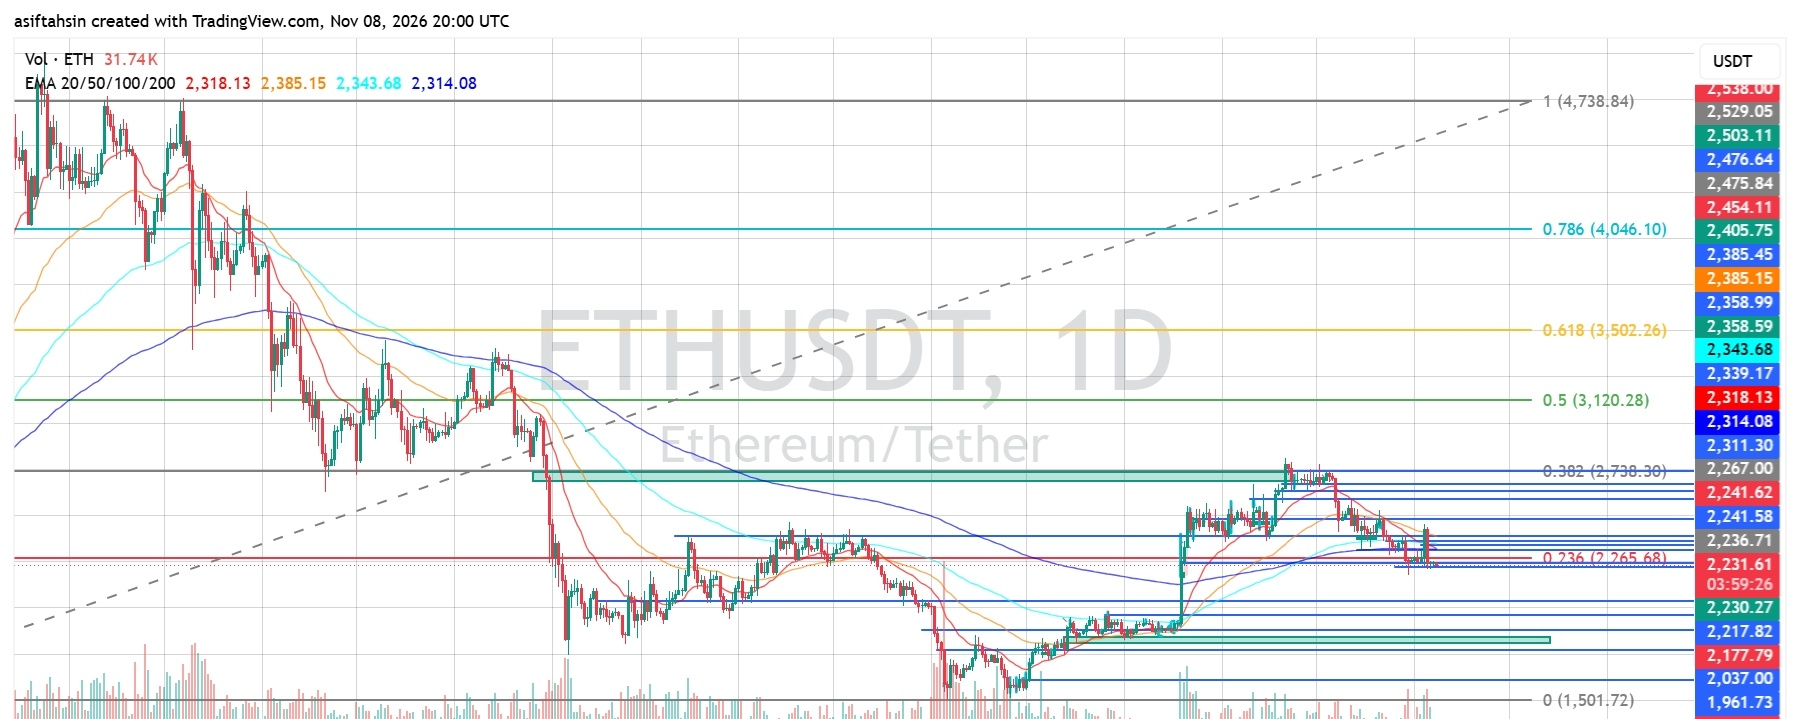
Ethereum is showing a weak daily structure after facing rejection from the $2,700 area. Price is currently trading near $2,232, below all four major EMAs. Although buyers are attempting to stabilize the market around $2,230, momentum remains relatively weak.
The next move will depend on whether ETH can reclaim its EMA resistance zone or whether sellers push price toward lower support levels.
1. EMA Structure: Sellers Maintain Control
Current ETH price: $2,231–$2,233
- EMA 20: $2,318.22
- EMA 50: $2,385.19
- EMA 100: $2,343.70
- EMA 200: $2,314.09
ETH is trading below all four major EMAs, keeping the daily trend under bearish pressure.
The $2,314–$2,385 region is a significant resistance zone. A sustained recovery above this area would be necessary to improve the short-term market structure.
2. Fibonacci Levels: Important Recovery Targets
Based on the chart:
- 0.236: $2,265.68
- 0.382: $2,738.30
- 0.5: $3,120.28
- 0.618: $3,502.26
- 0.786: $4,046.10
- 1.0: $4,738.84
ETH is currently trading below the 0.236 Fibonacci level at $2,265.68, making this an important level to reclaim.
A sustained move above $2,265 could provide an initial recovery signal, but stronger confirmation would require reclaiming the EMA resistance cluster.
3. Bearish Scenario: Support Levels to Watch
The recent price action shows continued weakness following rejection near the $2,700 region.
If ETH fails to recover above $2,265–$2,318, sellers could maintain control.
Important downside levels:
- $2,230: Immediate support area
- $2,217: Nearby technical support
- $2,177: Important support zone
- $2,037: Major lower support
- $1,961: Additional downside level
- $1,501.72: Major Fibonacci baseline
A confirmed daily breakdown below $2,177 would increase the risk of a deeper correction toward $2,037.
4. Bullish Scenario: What Buyers Need to Reclaim
For a meaningful bullish recovery, ETH needs to reclaim the following levels:
- $2,265.68: Fibonacci 0.236
- $2,314.09: EMA 200
- $2,318.22: EMA 20
- $2,343.70: EMA 100
- $2,385.19: EMA 50
A daily close above $2,385, followed by a successful retest, would provide stronger evidence of a trend recovery.
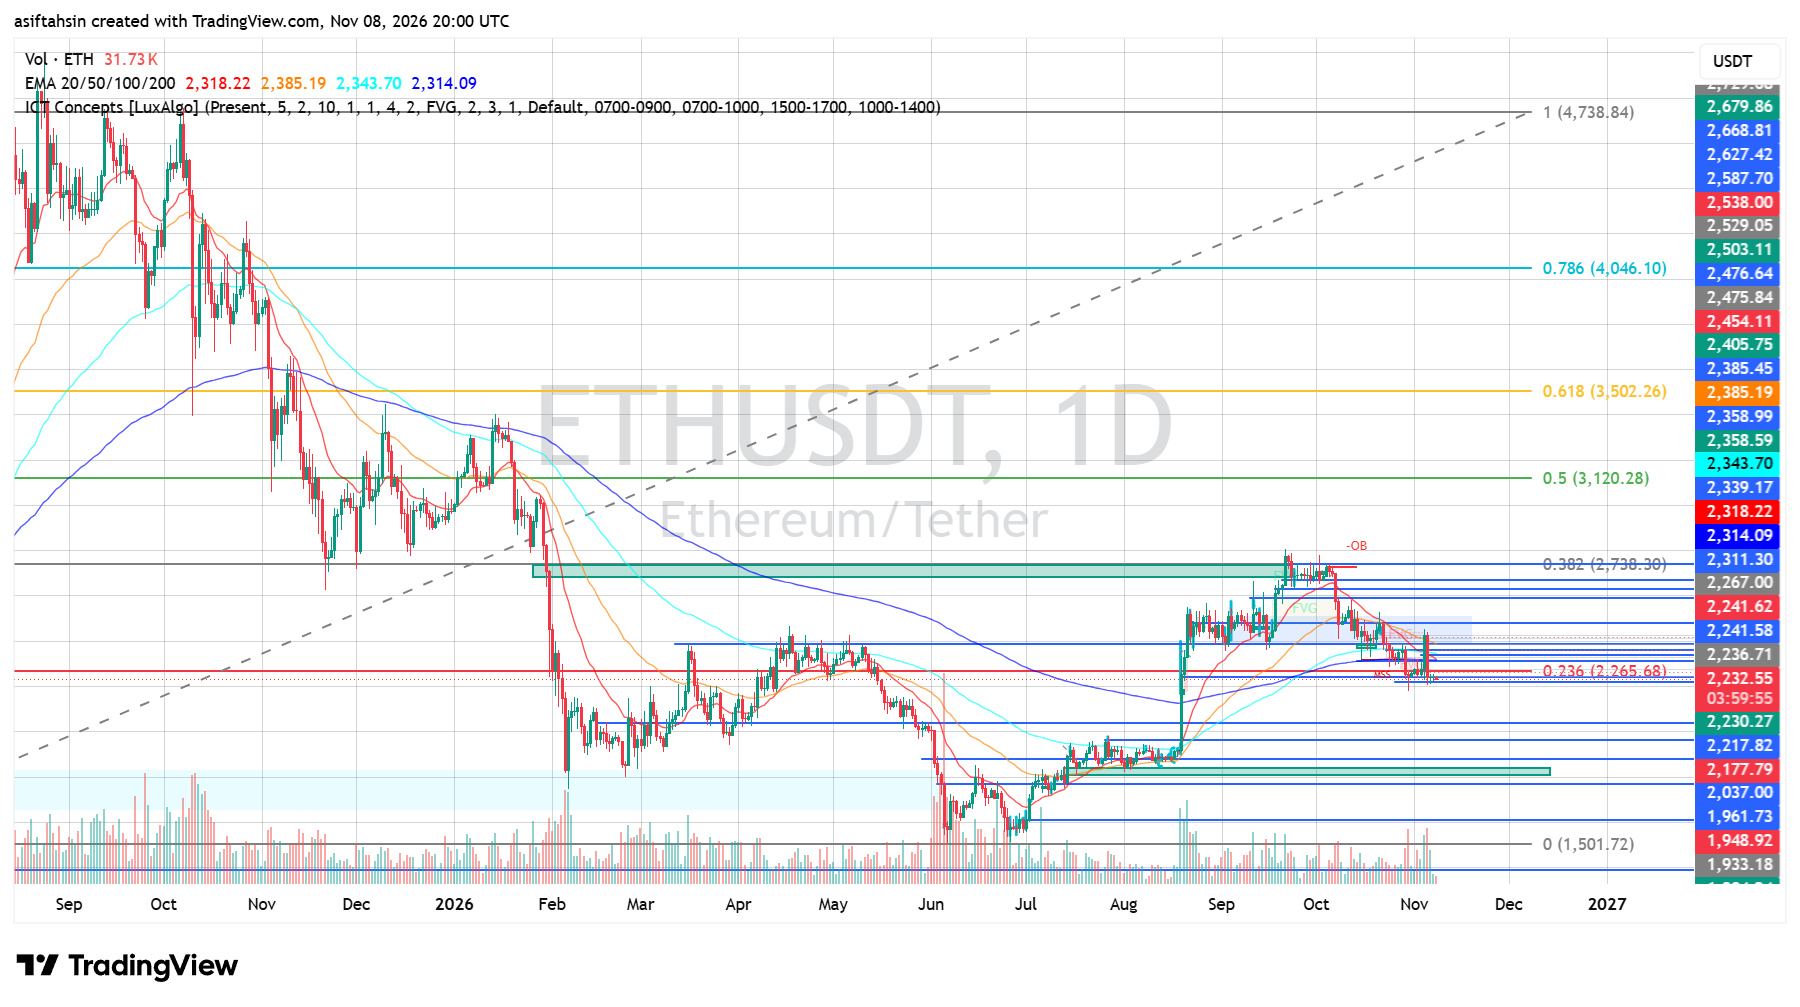
If momentum improves further, the $2,538 and $2,679 areas could become subsequent resistance targets.
5. RSI Momentum: Weak but Improving Slightly
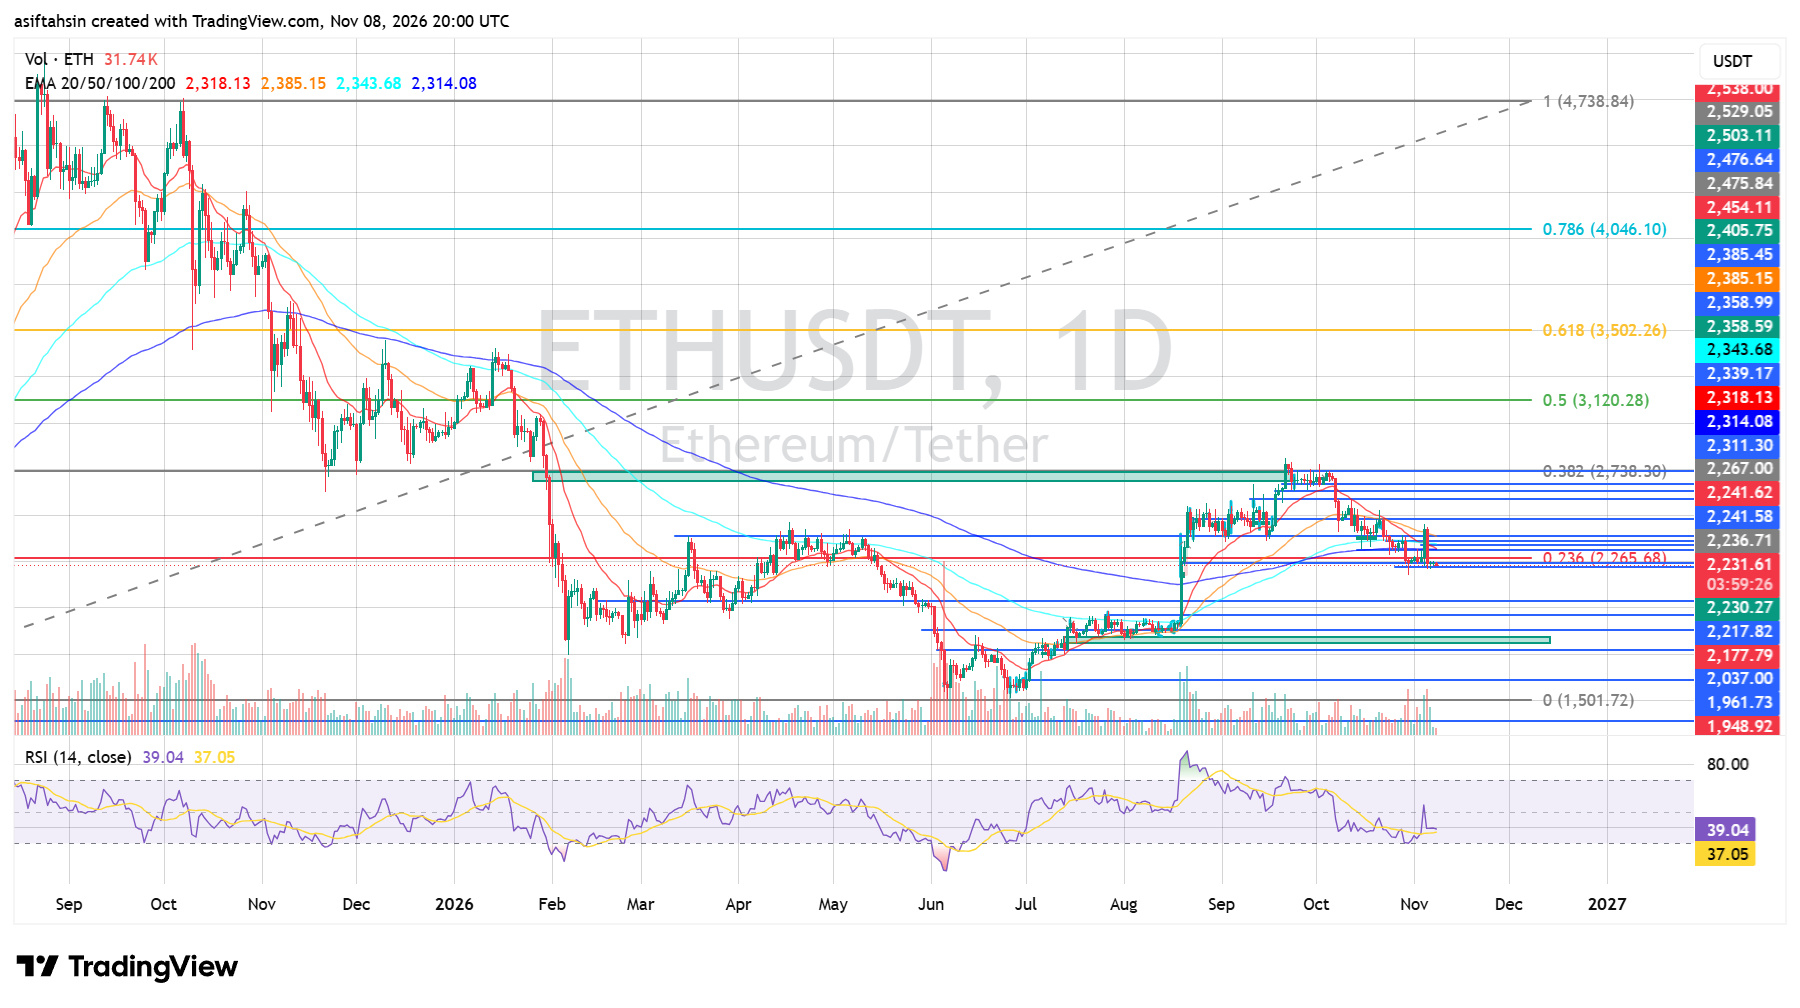
RSI (14): 39.04
RSI Moving Average: 37.05
RSI remains below the neutral 50 level, indicating that bearish momentum still dominates.
However, RSI is slightly above its moving average, suggesting a modest improvement in short-term momentum.
A sustained move above 40–50 would strengthen the recovery outlook. A decline below 30 would indicate renewed downside momentum.
6. Key Support and Resistance
Support
- $2,230: Immediate support
- $2,217: Nearby technical support
- $2,177: Major short-term support
- $2,037: Lower support zone
- $1,961: Additional support
Resistance
- $2,265: Fibonacci 0.236
- $2,314–$2,318: EMA 200 and EMA 20
- $2,343: EMA 100
- $2,385: EMA 50
- $2,538–$2,679: Higher resistance zone
Final Outlook
Ethereum remains under bearish pressure on the daily timeframe. Price is below all four major EMAs and has not yet reclaimed the $2,265 Fibonacci level.
The $2,230–$2,217 region is important for buyers. Holding this area could support a relief bounce, while a confirmed breakdown below $2,177 may expose ETH to $2,037.
For bulls, reclaiming $2,265 is the first step, followed by the $2,314–$2,385 EMA resistance cluster.
Current Bias: Bearish below $2,385, with potential for a relief bounce if support holds.
The market needs a confirmed breakout and sustained buying pressure before a stronger bullish reversal can be considered.
