
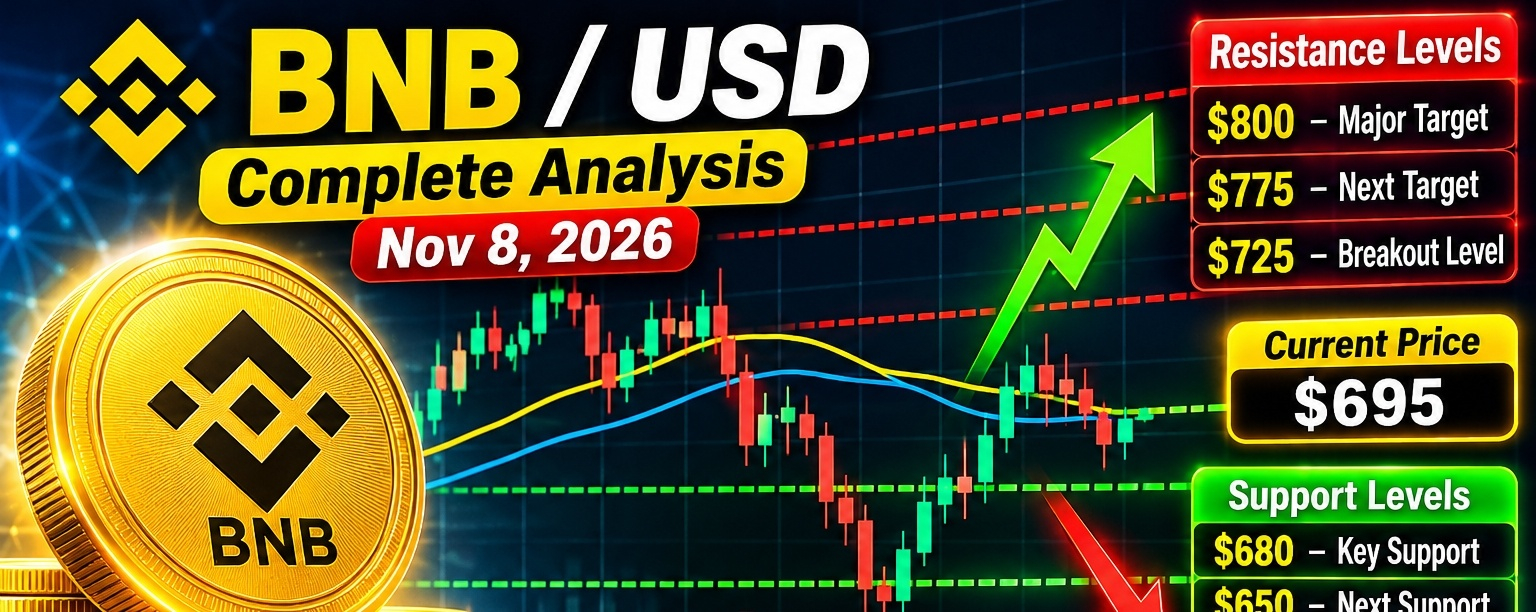

$BNB /USD Complete Analysis — November 8, 2026
Current price zone: around $695. $BNB is currently consolidating after a recent decline, with the most important near-term battle around $680–$725.
📊 Key technical levels

Level Price Importance
🔴 Major resistance $725 Breakout trigger
🔴 Resistance $700–$706 100/200-day MA area
🔴 Immediate resistance $696–$700 Current overhead zone
🟢 Immediate support $680–$690 Key demand zone
🟢 Major support $650 Next downside area
🟢 Strong support $580 Major bearish target
Recent analysis places strong support around $680–$690 and resistance near $725. A sustained move above $725 could open approximately $775, while losing $680 could expose the $580 region.
📈 Technical indicators
The latest technical readings are mixed:
- RSI: ~49 — neutral
- MACD: bearish
- ADX: ~14 — weak trend / consolidation
- 20-day MA: ~695
- 50-day MA: ~697
- 100-day MA: ~700
- 200-day MA: ~703–706
$BNB is therefore sitting close to its short-term averages but remains below the 50/100/200-day resistance cluster, which keeps the medium-term setup cautious.
🟢 Bullish scenario
The first bullish signal would be a clean reclaim of $700–$706.
If BNB then breaks and holds $725, momentum could accelerate toward:
$725 → $750 → $775 → $800
A sustained move above $800 would be a much stronger medium-term bullish confirmation.
🔴 Bearish scenario
If BNB cannot recover $700–$706 and loses $680, sellers could target:
$680 → $650 → $620 → $580
The $680 level is particularly important because it is currently identified as the major near-term support zone.
📰 Fundamental / market factors
BNB's recent movement appears heavily influenced by the broader crypto market rather than a strong BNB-specific catalyst. CoinMarketCap's latest analysis describes the move as largely beta-driven, while also noting uncertainty surrounding broader market volatility and recent Binance-related security concerns.
BNB also recently experienced a sharp move from above $760 toward $680, before recovering back toward the $700 area, showing that volatility remains elevated.
🎯 Trading outlook
Short term: 🟡 Neutral / slightly bearish
Medium term: 🟡 Neutral until $725 breaks
Bullish confirmation: Daily close above $725
Strong bullish confirmation: Above $800
Bearish confirmation: Daily close below $680
Possible trade map
Aggressive long: $680–$690 only after a confirmed bullish reversal
Safer long: Wait for a breakout and retest of $725
Upside targets: $750 → $775 → $800
Bearish targets: $650 → $620 → $580
Bullish invalidation: Sustained break below $680
🔥 Bottom line
BNB is currently in a decision zone around $680–$725. The chart does not yet show a strong bullish breakout. $700–$706 is the first hurdle, while $725 is the key breakout level. Above $725, BNB could move toward $775–$800; below $680, downside risk increases significantly toward $650 and potentially $580.
This is market analysis, not financial advice. Crypto prices can move rapidly and invalidate technical levels.