DAILY SIGNAL — SOL/USDT
Date: 06 Nov 2026
Chart Time: 03:45 UTC+8
Timeframe: 1m
Intraday Bias: Bullish recovery → resistance test → potential continuation
---
📊 MARKET BIAS
SOL is showing signs of short-term recovery after an extended period of sideways-to-bearish price action.
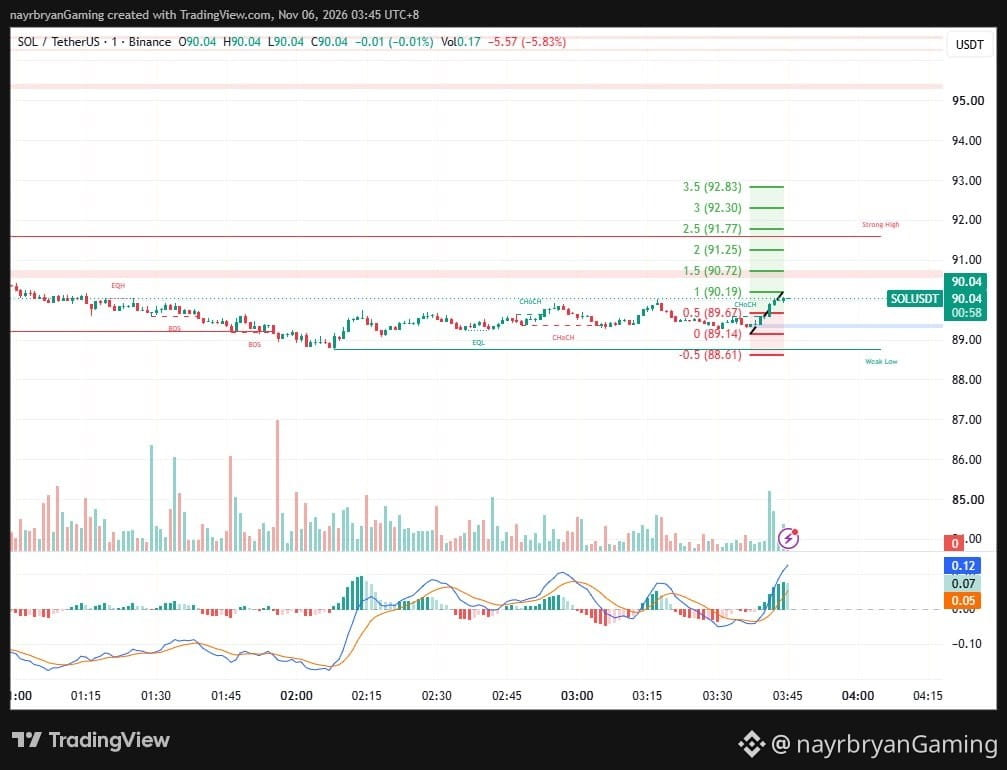
Price has rebounded from the lower structure around 89.14, recovering toward the current level of 90.04.
The latest candles indicate improving buying pressure, supported by a positive MACD structure.
However, SOL is approaching the important 90.19 Fibonacci level, which represents the first major confirmation point for further bullish continuation.
A sustained reclaim could open the way toward higher Fibonacci extensions.
Failure to maintain the recovery could bring the lower support levels back into focus.
---
🔹 KEY LEVELS FROM CHART
Current Price:
90.04
Immediate Support:
89.67
Key Support:
89.14
Major Downside Reference:
88.61
Key Reclaim:
90.19
Next Resistance:
90.72
Major Resistance:
91.25
Strong High Reference:
91.77 area
---
🎯 FIBONACCI LEVELS
Upside:
TP1 → 90.19 (1.0 Fib)
TP2 → 90.72 (1.5 Fib)
TP3 → 91.25 (2.0 Fib)
TP4 → 91.77 (2.5 Fib)
TP5 → 92.30 (3.0 Fib)
TP6 → 92.83 (3.5 Fib)
Downside:
89.67 → 89.14 → 88.61
---
📈 TECHNICAL BREAKDOWN
1. Price Structure
SOL has been consolidating around the 89.00–89.70 region before producing a stronger recovery.
Recent candles show an upward reaction from the lower structure, with price approaching the 90.19 Fibonacci level.
The immediate focus is whether buyers can maintain this recovery and establish acceptance above resistance.
.
---
🧠 QUICK INSIGHT
"Recovery creates opportunity, but resistance determines whether momentum can become continuation."
---
⚠️ DISCLAIMER
This is personal market analysis, not financial advice.
This chart framework is for educational purposes only.
Always DYOR / DYODD, manage risk properly, and avoid emotional trading.
— @nayrbryanGaming
#SOL #SOLUSDT #Crypto #Trading #TechnicalAnalysis #PriceAction #Fibonacci #Binance #MACD #MarketStructure #DYOR #NFA #NoFOMO
Date: 06 Nov 2026
Chart Time: 03:45 UTC+8
Timeframe: 1m
Intraday Bias: Bullish recovery → resistance test → potential continuation
---
📊 MARKET BIAS
SOL is showing signs of short-term recovery after an extended period of sideways-to-bearish price action.
Price has rebounded from the lower structure around 89.14, recovering toward the current level of 90.04.
The latest candles indicate improving buying pressure, supported by a positive MACD structure.
However, SOL is approaching the important 90.19 Fibonacci level, which represents the first major confirmation point for further bullish continuation.
A sustained reclaim could open the way toward higher Fibonacci extensions.
Failure to maintain the recovery could bring the lower support levels back into focus.
---
🔹 KEY LEVELS FROM CHART
Current Price:
90.04
Immediate Support:
89.67
Key Support:
89.14
Major Downside Reference:
88.61
Key Reclaim:
90.19
Next Resistance:
90.72
Major Resistance:
91.25
Strong High Reference:
91.77 area
---
🎯 FIBONACCI LEVELS
Upside:
TP1 → 90.19 (1.0 Fib)
TP2 → 90.72 (1.5 Fib)
TP3 → 91.25 (2.0 Fib)
TP4 → 91.77 (2.5 Fib)
TP5 → 92.30 (3.0 Fib)
TP6 → 92.83 (3.5 Fib)
Downside:
89.67 → 89.14 → 88.61
---
📈 TECHNICAL BREAKDOWN
1. Price Structure
SOL has been consolidating around the 89.00–89.70 region before producing a stronger recovery.
Recent candles show an upward reaction from the lower structure, with price approaching the 90.19 Fibonacci level.
The immediate focus is whether buyers can maintain this recovery and establish acceptance above resistance.
.
---
🧠 QUICK INSIGHT
"Recovery creates opportunity, but resistance determines whether momentum can become continuation."
---
⚠️ DISCLAIMER
This is personal market analysis, not financial advice.
This chart framework is for educational purposes only.
Always DYOR / DYODD, manage risk properly, and avoid emotional trading.
— @nayrbryanGaming
#SOL #SOLUSDT #Crypto #Trading #TechnicalAnalysis #PriceAction #Fibonacci #Binance #MACD #MarketStructure #DYOR #NFA #NoFOMO