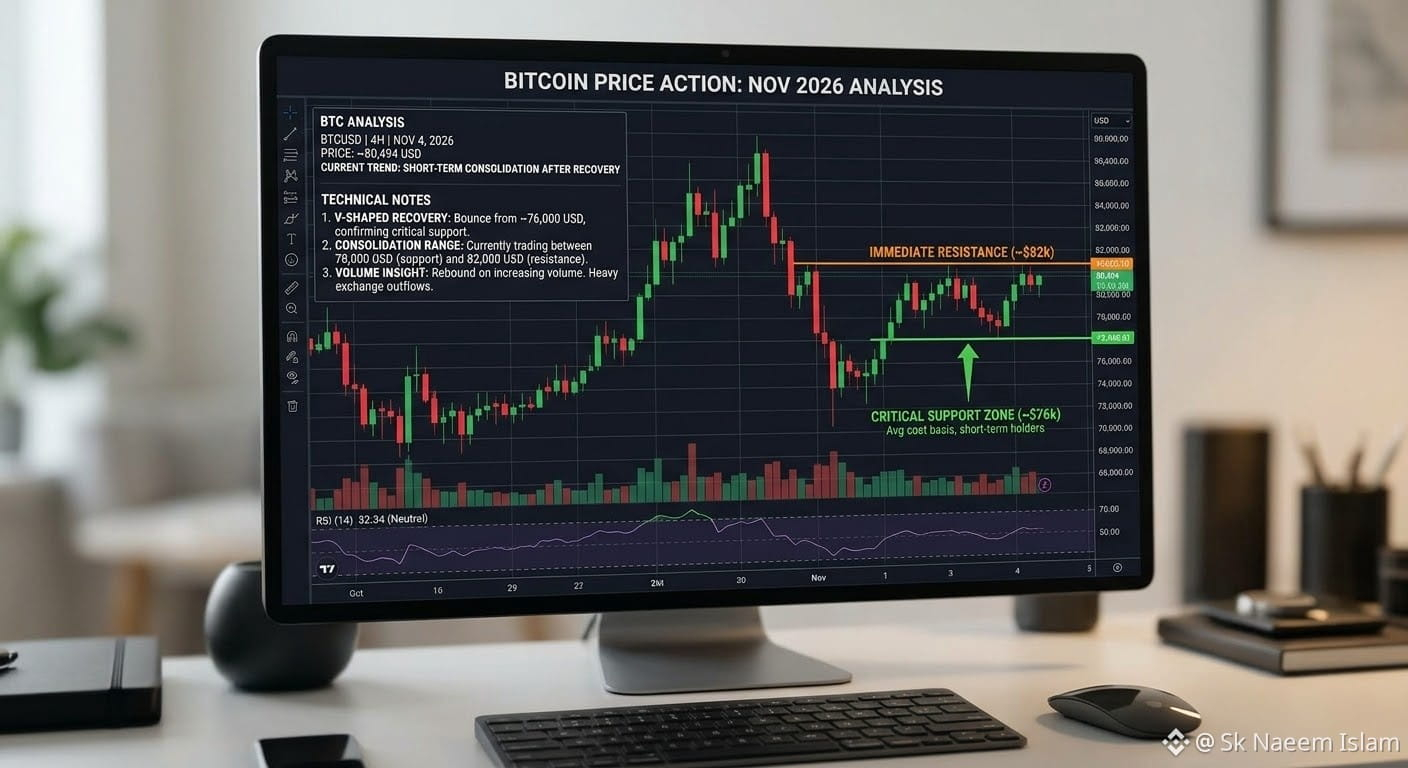
$BTC (BTC/USD) Executive Summary
Bitcoin has experienced heightened volatility following market reactions to exchange-related news, derivative liquidations, and broader macro conditions. After dipping into the $78,000–$80,000 support zone in late October, price action shows signs of short-term accumulation and stabilization near key support levels.
Resistance Range ($84,000 - $86,000)
+----------------------------------------+
| |
| [T1] High: $85,200 | <-- Long Upper Wick (Rejection)
| | |
| +--+ |
| | | Red Body (Selling Pressure) |
| +--+ |
| | Low: $78,500 |
| |
+----------------------------------------+
| |
| [T2] Hammer Pattern / Absorption |
| | High: $81,000 |
| +--+ |
| | | Small Body |
| +--+ |
| | |
| | Low: $77,800 (Demand Wick) | <-- Buyers Defending Floor
| |
+----------------------------------------+
Support Floor ($78,000 - $80,000)
Key Price Action Drivers
Support Floor ($78,000–$80,000): The recent sell-off met strong demand near $78,500. The long lower wicks on recent daily/4-hour candles indicate institutional buying and absorption of panicked retail liquidations.
Resistance Ceiling ($84,000–$86,000): The upper boundary of the current consolidation zone. A sustained daily candle close above $84,500 is needed to confirm a bullish trend reversal.
Candlestick Structure:
Long Lower Shadows (Wicks): Signal price rejection below $79,000, confirming that sellers are losing momentum at lower levels.
Bullish Engulfing Potential: A strong green daily candle back above $82,000 would invalidate near-term bearish momentum.
Bullish Scenario: A clean break and close above $84,500 opens the path toward testing previous swing highs near $90,000+.
Bearish Scenario: If $78,000 fails to hold under continued liquidation pressure, BTC risks retesting secondary support around $72,500–$74,000
#BTCRebounds80K #Binance98PercentReplenished #USMidterms-WhatAreMarketsExpecting? #AMDBeatsExpectations-AINarrativeContinues #BinanceIncidentReport