



Bitcoin's daily Timeframe Market Structure Analysis
Let's break down $BTC daily structure.
Current Market Condition: Sideways / Indecision
First, let's look at the major structural developments.
🔴 Bearish Structural Break
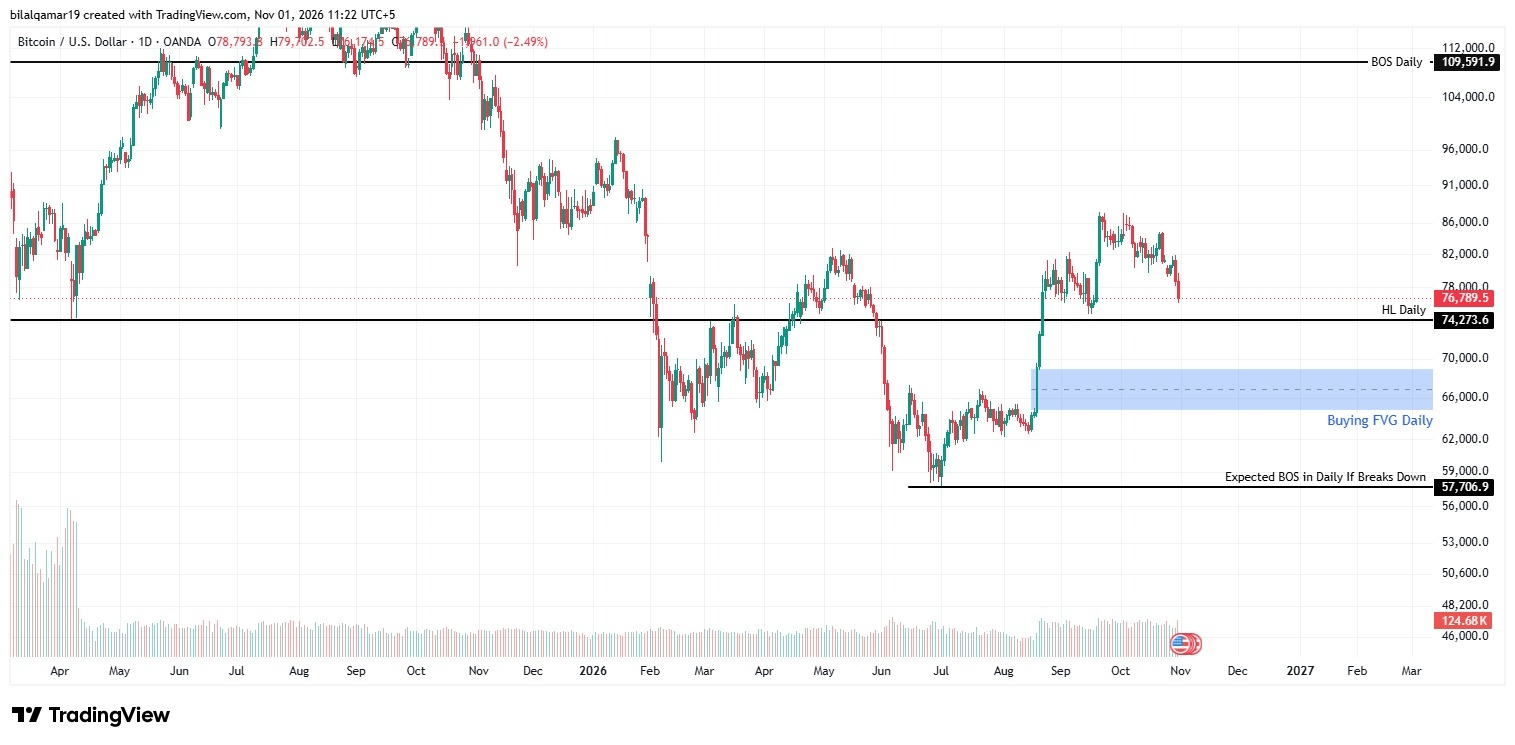
In April, $BTC broke its major confirmed higher low around $74,500. This was an important structural development and an early indication of potential bearish pressure.
However, the market did not immediately establish a sustained bearish structure. Eventually, BTC experienced a significant decline towards the $57,000 region.

🟢 Recent Recovery
After the decline, BTC recovered and moved above the $82,000 level.
However, this recovery alone does not confirm a complete bullish structural shift. We still need stronger evidence of bullish continuation.
🔍 What I'm Watching Next
Two important scenarios
Scenario 1 – Bullish Recovery
If BTC holds the $57,700 key support and develops stronger bullish structure, we could see further upside momentum.
Scenario 2 – Bearish Continuation
If BTC breaks below $57,700 with a confirmed daily candle close, it could indicate renewed bearish pressure and a potential shift towards further downside.
My Current View
For now, I prefer to remain patient rather than assume a clear directional trend.
Preserve capital, manage risk and monitor important liquidity levels on both sides of the market.
Remember: Understanding market structure is more important than predicting every move.
Regards,
Liquidity hunter