🚀 SOLANA (SOL) PRICE ANALYSIS: IS A RECOVERY COMING? 📈
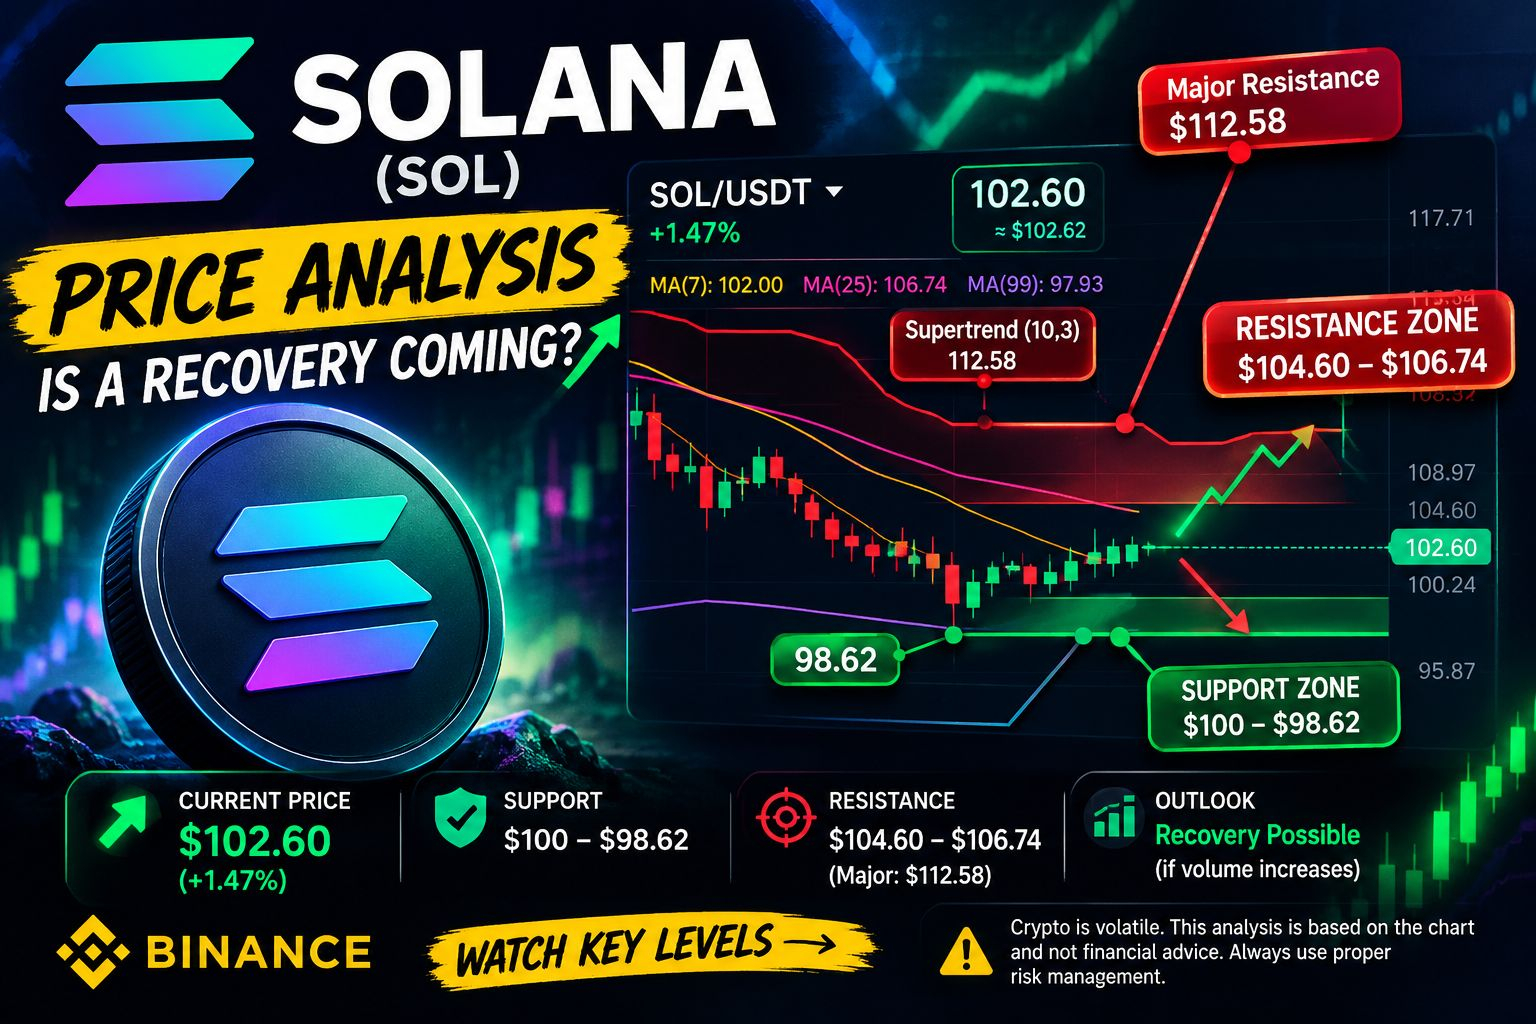
Solana (SOL) is showing signs of a possible recovery after recent selling pressure. According to the chart, SOL/USDT is trading around $102.60, up approximately 1.47% at the time of the screenshot.
📊 Key Technical Levels to Watch
🟢 Support Zone: $100–$98.62
This area could act as support if buyers continue defending the recent lows.
🔵 Resistance Zone: $104.60–$106.74
A breakout above this zone, supported by strong trading volume, could improve the short-term outlook.
🔴 Major Resistance: Around $112.58
The Supertrend indicator remains above the current price, suggesting that the broader short-term trend may still be bearish.
📈 My Market Outlook
If SOL holds above the $100 area and buying volume increases, a recovery toward $104–$106 could be possible. However, if the price breaks below $98.62, further downside pressure may develop.
The chart shows a small recovery, but confirmation is still needed before calling it a bullish reversal.
💡 Trading Strategy: Watch the $100 support level, resistance near $104.60, and volume before making a decision. Avoid entering a trade based on price movement alone.
⚠️ Risk Disclaimer: Cryptocurrency markets are highly volatile. These levels are based on the provided chart and are not guaranteed predictions or financial advice. Always use proper risk management and never invest more than you can afford to lose.
💬 What do you think? Will SOL break above $105, or will sellers push it below $100? Share your analysis in the comments!
#Solana #SOL #SOLUSDT #CryptoAnalysis #BinanceSquare #CryptoTrading #Altcoins #TechnicalAnalysis