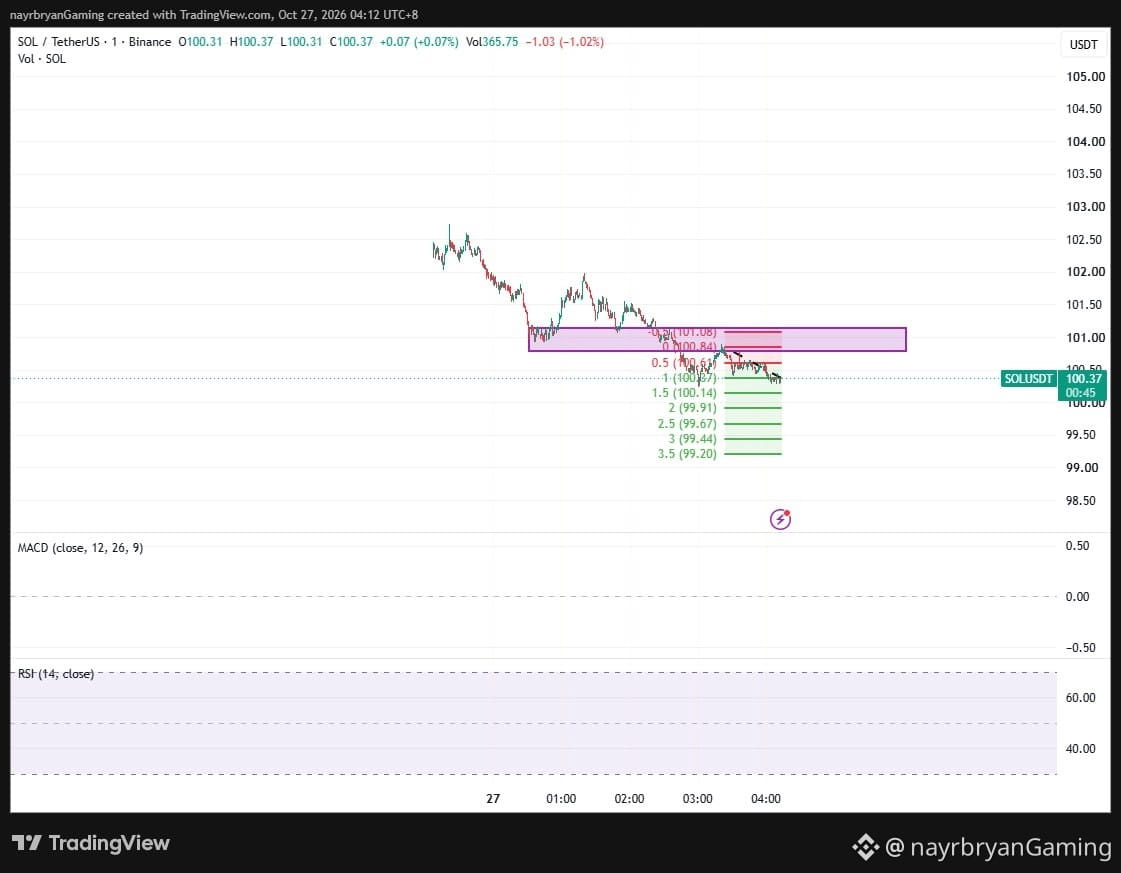
LIGHT ANALYSIS / CHART SETUP — SOL/USDT
📈 Structure Overview
Market phase:
Selloff → Support breakdown → Bearish consolidation
Current Price:
100.38
Key Resistance Zone:
100.80–101.15
Immediate Resistance:
100.57–100.64
Near-Term Support:
100.37–100.30
Downside Fibonacci Levels:
100.14 → 99.91 → 99.67 → 99.44 → 99.20
---
📌 What I'm Watching
Scenario A — Bearish Continuation
If SOL remains below 100.57–100.64 and breaks beneath the local consolidation, price may rotate toward:
100.37 → 100.14 → 99.91 → 99.67 → 99.44 → 99.20
Watch for price confirmation at each level rather than assuming every target will be reached.
Scenario B — Resistance Reclaim
If SOL recovers above 100.80 and reclaims the purple zone toward 101.15, the immediate bearish structure weakens.
A sustained recovery above the zone would warrant reassessing the descending-channel setup.
---
📊 Technical Check
Price Structure:
Descending channel with lower highs and lower lows.
Resistance:
100.80–101.15.
Downside Reference:
100.14.
Confirmation:
Breakdown below local support / reclaim of the purple resistance zone.
MACD & RSI:
Current readings are not legible in the screenshot; avoid assigning unverified momentum values.
---
Note:
This is a chart framework, not a trade recommendation.
Use it to support your own DYOR-based execution plan.
— @nayrbryanGaming
#SOLAnalysis #ChartSetup #PriceAction #SmartMoney #Fibonacci #CryptoTrading #TradingView #DYOR #NFA