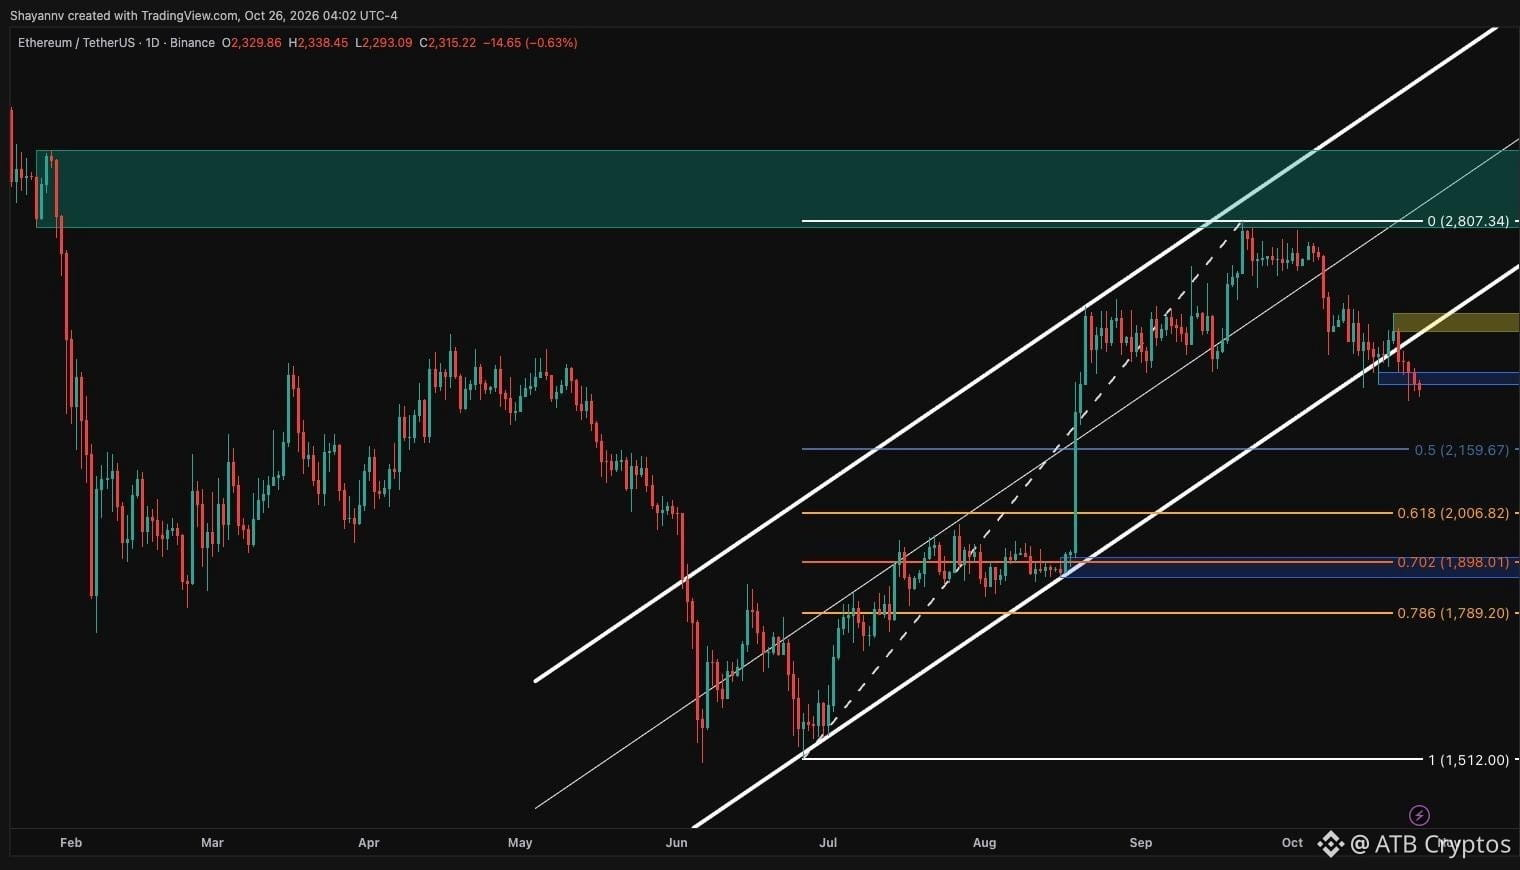
Ethereum drops below key trendline, $2.3K support under pressure.
On the daily chart, ETH closed below the lower trendline of its ascending channel around $2.4K, eroding the $2.3K‑$2.35K support area.
The next reference points are the 0.5 Fibonacci near $2.16K, the 0.618 level near $2K and the $1.9K order block.
The 4‑hour view shows a descending channel since the early‑October peak near $2.77K.
ETH is hovering just below $2.35K with a wick to $2.28K; the $2.25K demand zone is the most significant support.
A bounce could test $2.35K‑$2.45K, while a break below $2.25K would leave only $1.9K as support.
CryptoQuant’s Taker Buy Sell Ratio sits around 0.973, below the neutral 1, indicating sellers are more aggressive in the futures market.
The metric is at its lowest since the June sell‑off.
Given the current $2.25K demand zone, do you think ETH can hold or will it break lower?
#Ethereum #CryptoAnalysis #FinTech #MacroEconomy