$ETH
📊 ETH/USDT SIGNAL PLAN |
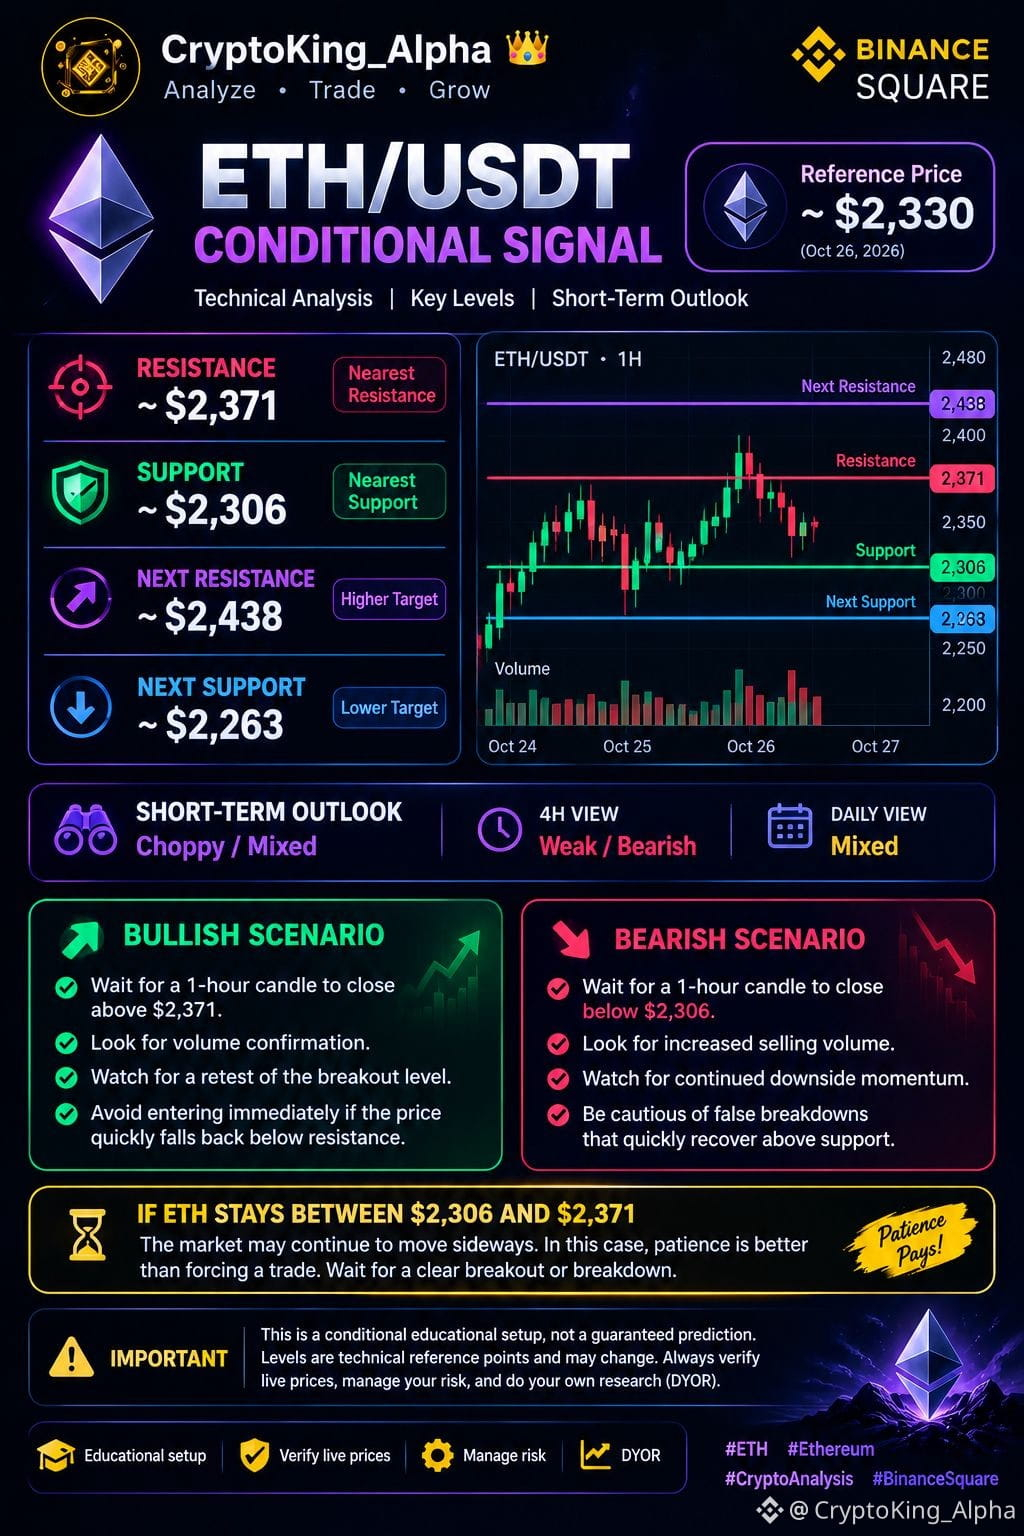
Ethereum is trading near the $2,330 area, with price action showing mixed short-term momentum. Traders should monitor the key support and resistance levels and wait for confirmation before making a decision.
🔴 Key Resistance: $2,371
The $2,371 level is the nearest resistance to watch. If ETH fails to break above this zone, sellers may push the price lower. However, a strong 1-hour candle close above $2,371, supported by increasing trading volume, could signal a potential bullish breakout. Traders should also watch for a successful retest before considering an entry.
🟢 Key Support: $2,306
The $2,306 level is the nearest support area. If buyers defend this zone, ETH may attempt another move toward resistance. However, if a 1-hour candle closes below $2,306 with strong selling volume, it could indicate further downside pressure.
📈 BULLISH SCENARIO
- Wait for a 1H candle close above $2,371.
- Look for strong volume confirmation.
- Watch for a successful retest of the breakout zone.
- Avoid chasing price after a sudden pump.
📉 BEARISH SCENARIO
- Wait for a 1H candle close below $2,306.
- Look for increased selling pressure.
- Watch for a retest of broken support as resistance.
- Be careful of false breakdowns.
⏳ NO-TRADE ZONE
If ETH remains between $2,306 and $2,371, the market may continue moving sideways. Patience is important—wait for a clearer setup rather than forcing a trade.
⚠️ These are technical reference levels, not guaranteed predictions. Verify the live ETH/USDT price before trading, manage position size carefully, and always do your own research (DYOR).
💬 What’s your view on ETH? Bullish breakout or bearish breakdown? Share your analysis below!
#ETH #Ethereum #ETHUSD #CryptoAnalysis #BinanceSquare