



AMP is catching traders’ attention with a +10.55% gain, but the big question is: Is this rally preparing for another breakout, or could buyers face a pullback? 👀
AMP/USDT is trading around 0.000744, while its 24-hour high stands at 0.000849 and its low is 0.000652. Price is now below the daily high, so the next move deserves close attention.
Let’s break down the 15m, 1H, 4H and 1D charts.
🔎 15M TIMEFRAME — Short-Term Pressure
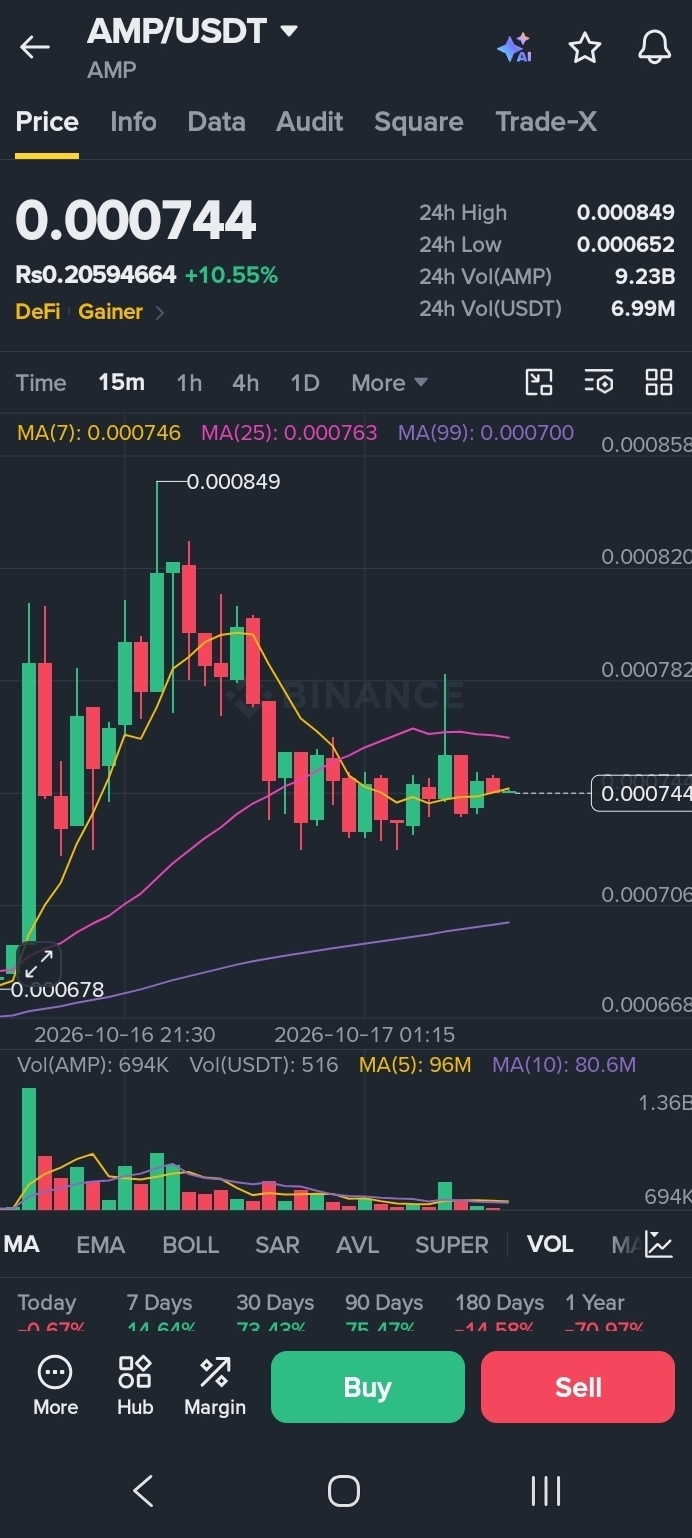
Price: 0.000744
MA(7): 0.000746
MA(25): 0.000763
MA(99): 0.000700
On the 15m chart, price is slightly below MA(7) and MA(25), suggesting short-term momentum has cooled after the recent move. However, price remains above MA(99), which is an important level to watch.
Bullish signal: A move back above 0.000763 could improve short-term momentum.
Bearish signal: If price loses the 0.000700 area, sellers may gain more control.
📊 1H TIMEFRAME — Can Buyers Regain Control?
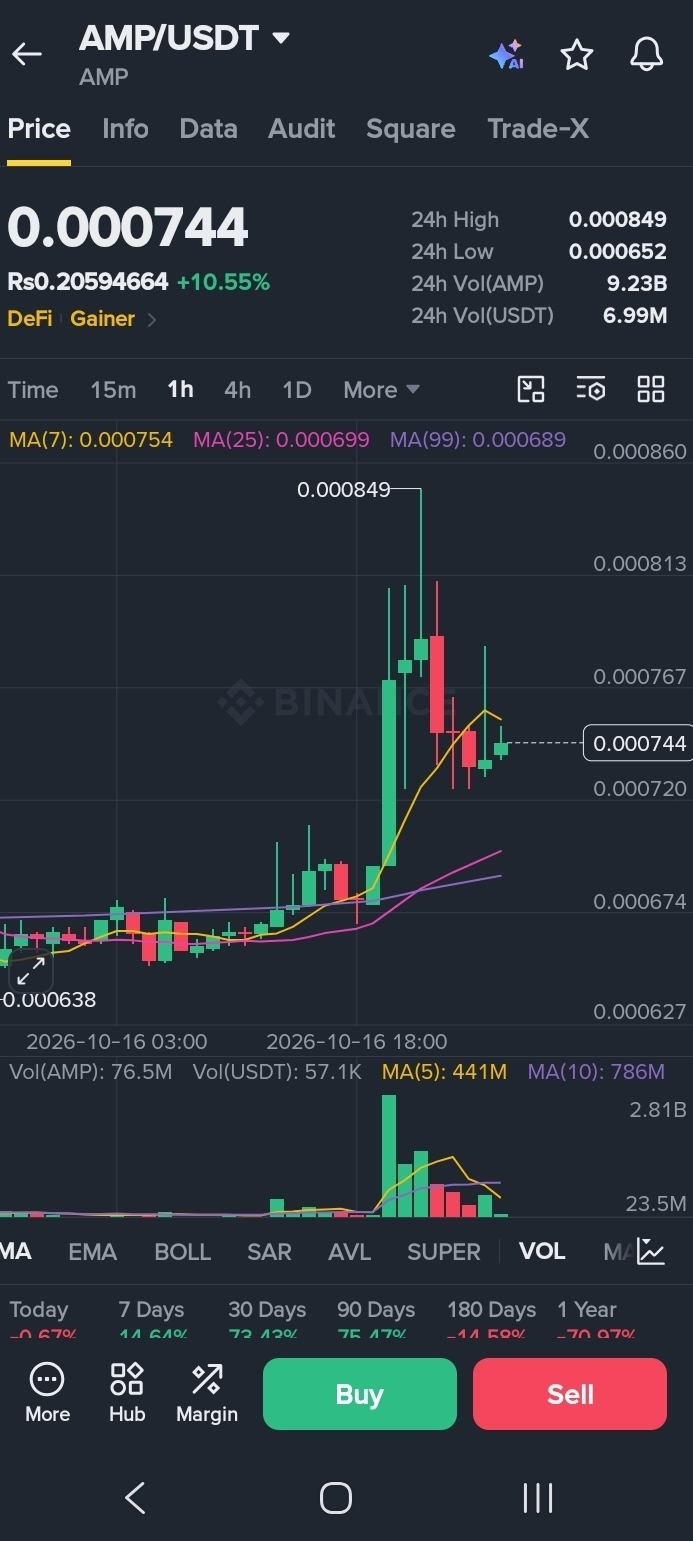
MA(7): 0.000754
MA(25): 0.000699
MA(99): 0.000689
On the 1H chart, price is below MA(7) but above MA(25) and MA(99). This suggests the immediate momentum is weaker, while the broader hourly structure still has some support.
Bullish scenario: Reclaiming 0.000754 could help buyers attempt another move toward the recent high.
Bearish scenario: A break below 0.000699–0.000689 would weaken the current hourly structure.
⚡ 4H TIMEFRAME — Recovery or Continuation?
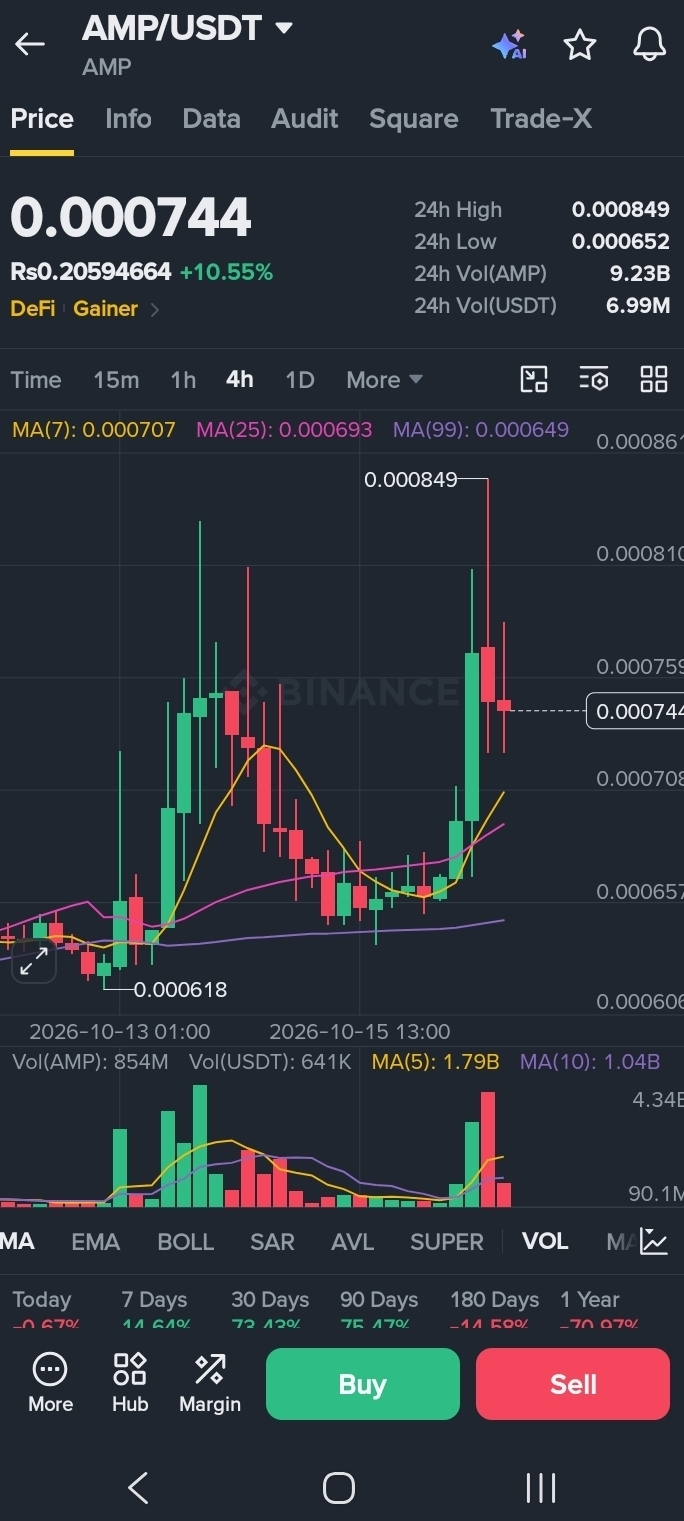
MA(7): 0.000707
MA(25): 0.000693
MA(99): 0.000649
The 4H chart shows price above all three listed moving averages. That is a constructive sign for the broader short-term trend, although it does not guarantee another rally.
Bullish scenario: Holding above 0.000707 and breaking the 0.000849 resistance could open the door to a fresh attempt higher.
Bearish scenario: Losing 0.000693 may signal that the recovery is losing strength.
📈 1D TIMEFRAME — The Bigger Picture
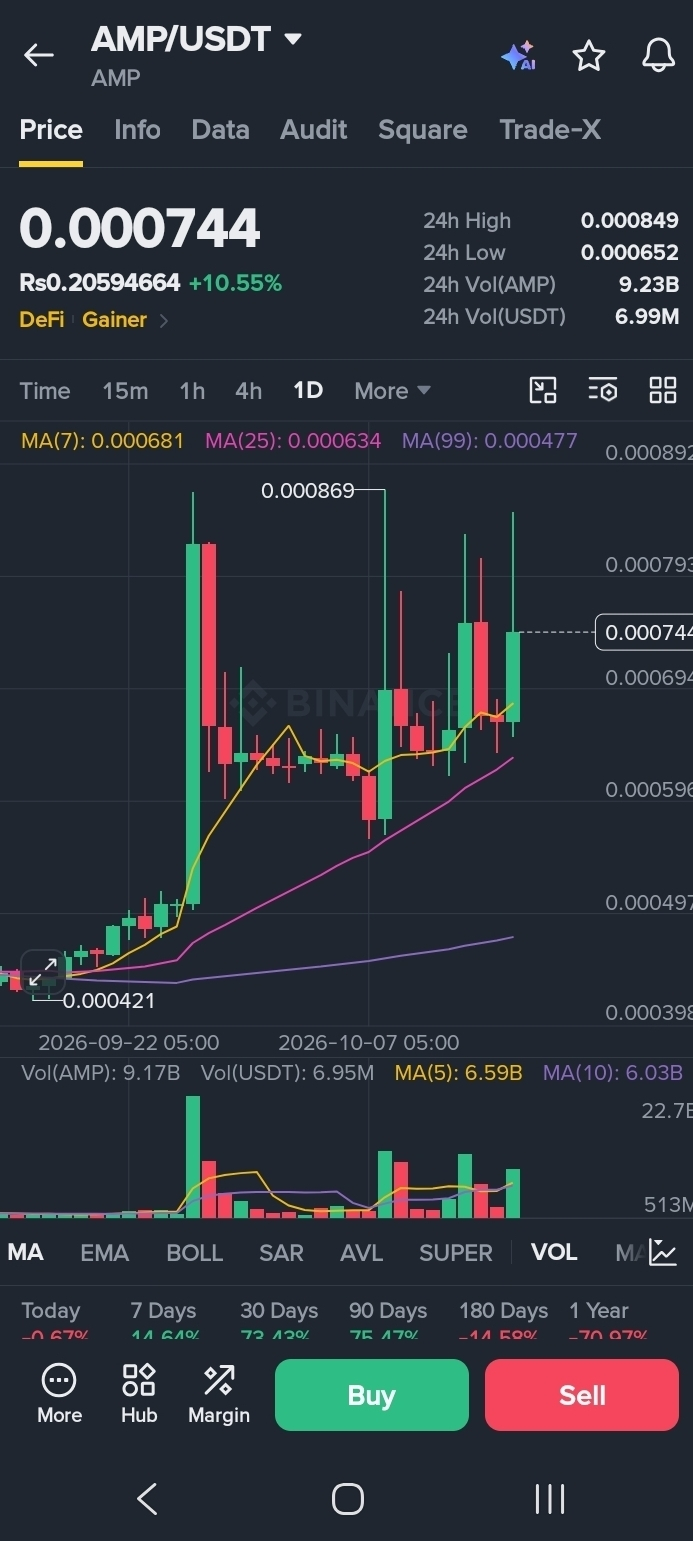
MA(7): 0.000681
MA(25): 0.000634
MA(99): 0.000477
On the 1D chart, price is above all three moving averages shown in your screenshot. This supports a stronger broader trend, but a sharp rise can still be followed by profit-taking or consolidation.
Key resistance: 0.000849, followed by the higher chart area around 0.000869–0.000892.
Key support zones: 0.000720, 0.000681, and 0.000634.
These are reference levels from the provided chart, not guaranteed turning points.
🎯 AMP/USDT — Levels to Watch
🔹 Resistance: 0.000849
🔹 Next resistance zone: 0.000869–0.000892
🔹 Near support: 0.000720
🔹 Stronger support area: 0.000699–0.000681
🔹 Lower support reference: 0.000634
🐂 Bullish vs. 🐻 Bearish Scenario
🐂 Bullish case: If AMP holds its nearby support and reclaims the 0.000754–0.000763 area, buyers may attempt another test of 0.000849. A convincing breakout above resistance would need confirmation.
🐻 Bearish case: If AMP fails to recover and breaks below 0.000720, the market could revisit lower support zones. A deeper move below 0.000681 would weaken the bullish structure further.
❓ The Big Question: Buy Now or Wait?
AMP’s chart has positive signs on the 4H and 1D timeframes, but the 15m and 1H charts show short-term hesitation.
Chasing a coin after a sharp rise can be risky. Traders may prefer to wait for a confirmed breakout or a clear support retest rather than entering based only on the percentage gain.
What do you think? Is AMP preparing for another breakout, or is a pullback coming first? 🚀📉
Share your view in the comments!
Disclaimer: This article is for educational and informational purposes only, not financial advice. Crypto markets are volatile, and technical levels can fail. Always do your own research and manage risk before trading.
#AMP #AMPUSDT #CryptoAnalysis #BinanceSquare #Altcoins #TechnicalAnalysis #cryptotrading