



Good day, @Binance Square Official
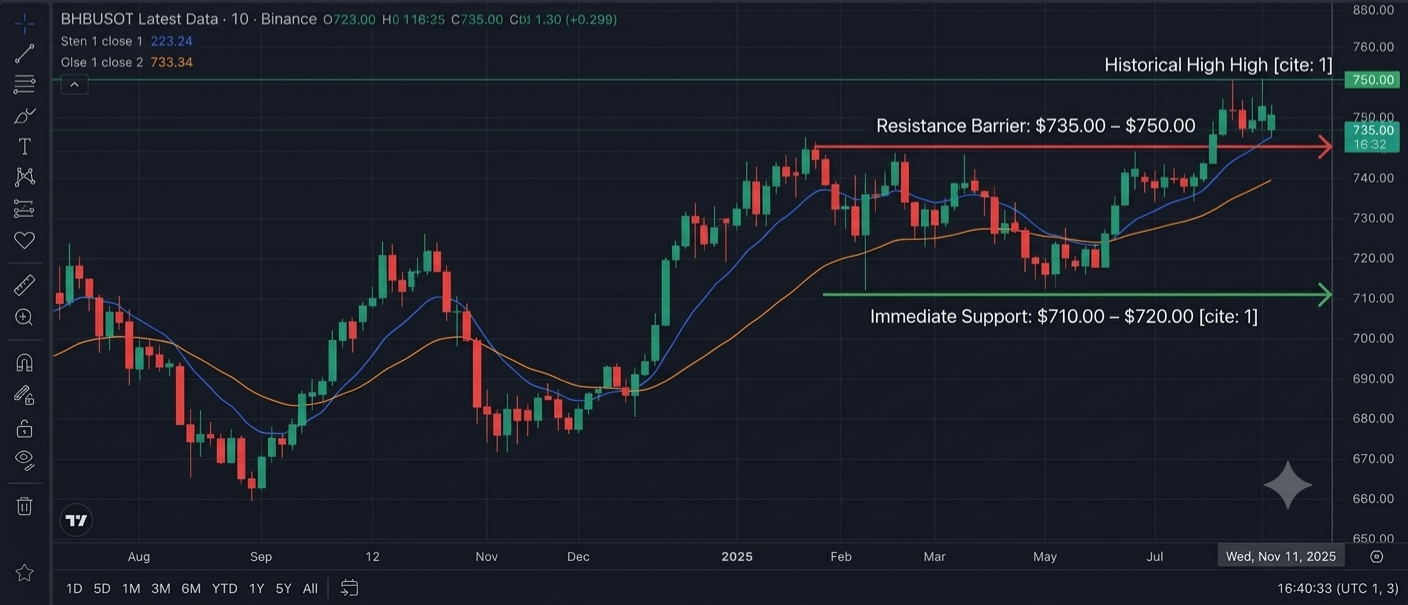
BNB ($BNB ) is currently consolidating across key timeframes as price action trades close to critical Exponential Moving Average (EMA) dynamic support zones on the daily chart.
After testing upper resistance boundaries around $735 – $750, BNB is showing signs of localized range-building, allowing buyers to absorb selling pressure while forming a solid base for the next directional move.
📊 Key Technical Zones
🚀 Major Resistance Barrier ($735.00 – $750.00): This overhead supply zone represents the primary level BNB needs to clear. A confirmed daily candle close above $735 signals strong bullish expansion toward testing higher targets near $780+.
🛡️ Immediate Support Floor ($710.00 – $720.00): A crucial horizontal accumulation area where buyers have consistently defended pullbacks.
🛑 Dynamic Trend Invalidation ($680.00): Holding above the 50-day moving average keeps the broader medium-term uptrend structurally sound.
#BNB_Market_Update #BNBUSDT $BNB
 BNB722.29-1.16%