



Spot Bitcoin ETFs recorded $681 million in outflows from October 5–9, 2026, ending three consecutive weeks of net inflows.
Ethereum ETFs lost $542 million during the week, with BlackRock’s ETHA accounting for $477 million in withdrawals.
Bitcoin and Ethereum ETF flows fluctuated alongside prices through 2024–2026, but the data does not establish direct causation.
Spot Bitcoin and Ethereum ETFs recorded a combined $1.223 billion in net outflows from October 5 to October 9, 2026, according to SoSoValue. Bitcoin funds lost $681 million, ending three consecutive weeks of net inflows, while Ethereum funds shed $542 million. BlackRock’s ETHA accounted for $477 million in Ethereum ETF outflows.
https://twitter.com/WuBlockchain/status/2109491469237293226?s=20
Bitcoin ETFs End Three-Week Inflow Streak
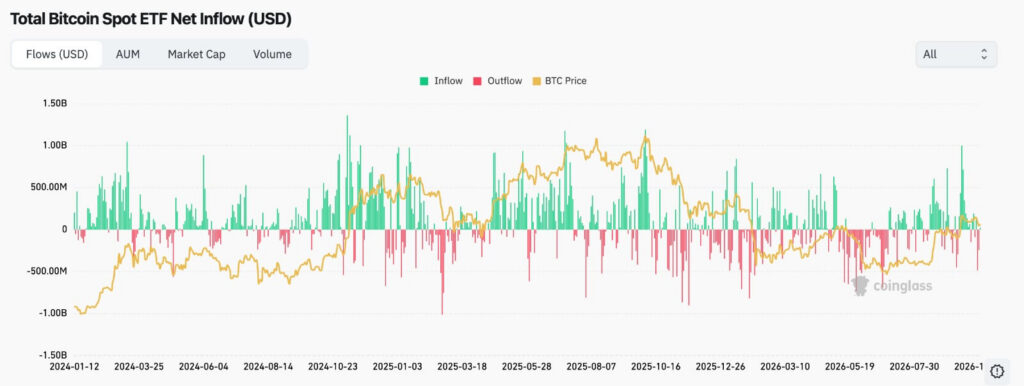
Bitcoin’s latest weekly withdrawals reversed three weeks of consecutive net inflows. The broader chart, covering January 2024 through October 2026, shows repeated shifts between daily inflows and outflows.
 Source: Coinglass
In early 2024, Bitcoin climbed from approximately 40,000–45,000 toward $70,000, alongside several inflow spikes exceeding $1 billion. However, midyear withdrawals coincided with prices retreating toward 50,000–60,000.
Buying returned late in 2024, with one inflow spike approaching $1.35 billion as Bitcoin moved toward $100,000. During 2025, daily flows remained uneven, with some withdrawals approaching $1 billion.
BlackRock’s ETHA Leads Ethereum ETF Outflows
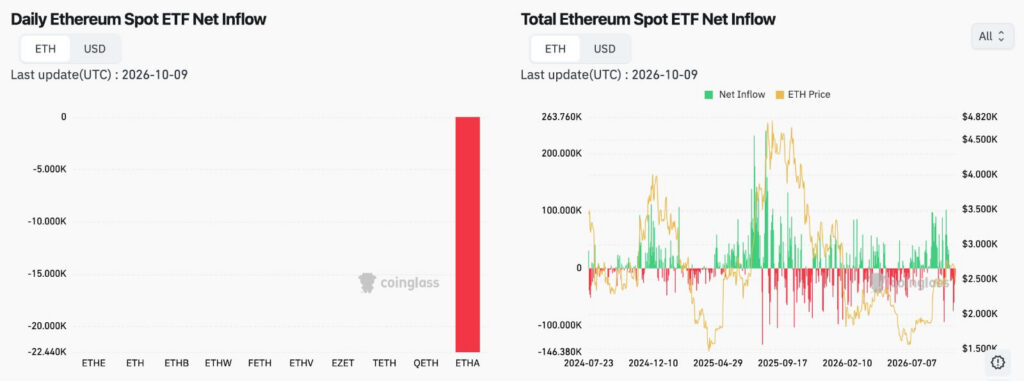
Ethereum spot ETFs recorded $542 million in weekly net outflows, with BlackRock’s ETHA accounting for $477 million. The Ethereum chart, updated October 9, also shows a daily ETHA outflow of approximately 22,440 ETH.
 Source: Coinglass
Other listed funds include ETHE, ETH, ETHB, ETHW, FETH, ETHV, EZET, TETH and QETH. However, their individual flows are not clearly visible at the chart’s displayed scale.
The cumulative-flow chart shows inflow spikes reaching approximately 200,000–230,000 ETH around mid-2025. Meanwhile, some outflow periods approached 100,000–130,000 ETH, reflecting alternating fund activity.
Bitcoin and Ethereum Prices Track Uneven Flows
Bitcoin’s chart shows prices rising toward 100,000–110,000 during parts of 2025 before falling toward $80,000 and lower. In 2026, BTC approached 60,000–70,000 before recovering toward 90,000–100,000.
Ethereum climbed toward 4,600–4,800 in August and September 2025 before declining toward 1,600–1,800 around July 2026. By the chart’s end, ETH had recovered to approximately 2,000–2,100.
Both charts show alternating inflows and outflows alongside price fluctuations. However, the figures alone do not establish that ETF withdrawals caused either cryptocurrency’s price movements.