


Sonic (S) Bullish Structure, Tighter Liquidity, and Elevated Momentum Risk
Current Market State
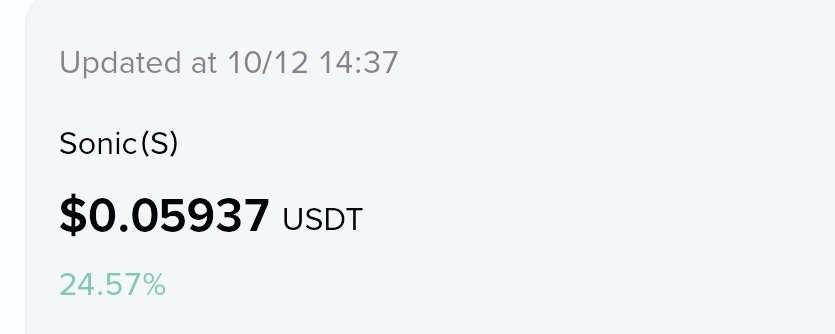
As of 2026-10-12, S is trading at $0.05937, down -2.58% versus the prior close. Its 24-hour range is $0.04716–$0.06901. Despite today’s pullback, S remains up +45.62% over 7 days and +119.48% over 30 days, reflecting a strong recent trend but also elevated volatility.
Fundamentals, Valuation, and Flows
The broader backdrop remains less supportive than a fully risk-on environment: tighter financial conditions can constrain liquidity available for higher-beta spot assets. The Fear & Greed reading of 58 suggests risk appetite is still constructive but no longer accelerating.
S has an estimated market capitalization of $173.61M, an FDV ratio of 1.12, and turnover of 1.5. Your flow data shows daily big-order net buying of +$54.1K, but taker buying of 0.51 is above large-order buying of 0.25. This points to demand being present, though conviction from larger participants appears moderate rather than decisive.
Trend and Technicals
The daily trend remains bullish. S is above MA7 at $0.04780, MA25 at $0.04192, and MA99 at $0.02950; the moving averages are aligned bullishly. MACD recorded a golden cross two daily bars ago, while SuperTrend remains positive near $0.04188.
The caution is momentum: RSI(6) is 78.66, which is overbought. Volume is also cooling, with the latest daily volume at 0.86× the 7-day average. That combination can lead to consolidation even if the broader trend remains intact.
Conditional Trade Opportunity
This is a high-momentum setup rather than a low-risk trend continuation.
Continuation scenario: The bullish structure remains more credible if S stabilizes above its short-term trend area and volume expands again. A recovery toward the recent $0.06901 range high would need sustained participation rather than a brief spike.
Consolidation scenario: If momentum cools while price stays above the short-term moving-average zone, the market may be digesting recent gains without necessarily breaking the broader trend.
Risk scenario: A structural loss of the short-term trend zone would weaken momentum. The cited $0.03 area remains a broader invalidation reference, but it is materially below current price and therefore does not capture nearer-term volatility risk.
The main trade-off is clear:
chasing strength after a large multi-week move exposes a trader to sharp pullbacks, while waiting for confirmation can reduce exposure to an overextended move but may miss renewed momentum. Position sizing, holding period, and maximum acceptable loss should determine whether this volatility profile fits your plan.
The above is market analysis and does not constitute investment advice.


