



AT&T stock has a neutral daily bias despite Thursday’s gain. The closing price sits between key daily averages, while hourly indicators offer a more constructive reading. That conflict leaves a bullish case conditional on clearing overhead resistance.
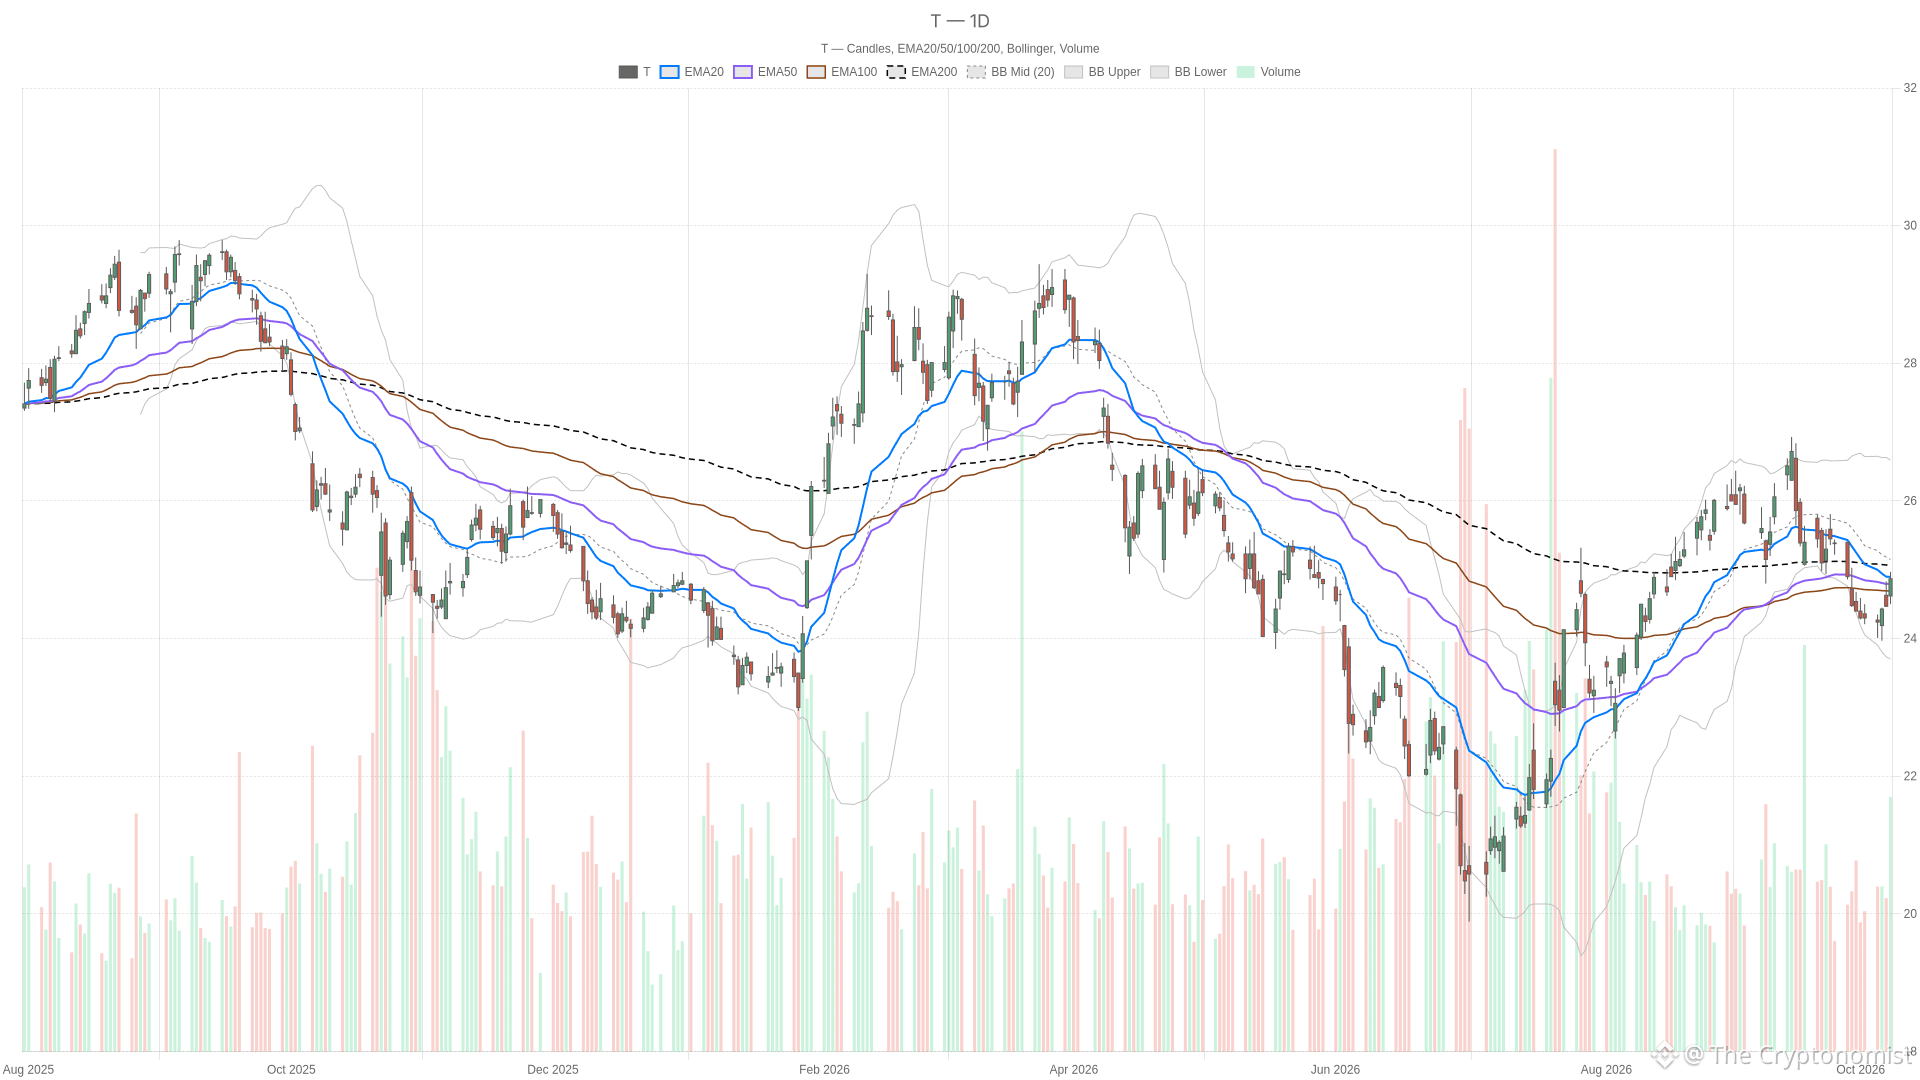 T — daily chart with candlesticks, EMA20/EMA50 and volume.
Key takeaways
AT&T closed Thursday at $24.87, up 1.63% from the previous close of $24.47 on October 7, 2026.
The close sits above the daily 50-session EMA at $24.8 but below the 20-session EMA at $24.9 and the 200-session EMA at $24.97.
Daily RSI14 is 48.9, below the neutral 50; the daily MACD line is -0.21, below its signal at -0.12, with a negative histogram of -0.09.
Hourly RSI14 is 66.34 and the hourly MACD histogram is 0.04, contrasting with the unconfirmed daily readings.
A Seeking Alpha article published October 7 cited 10.37x 2026 earnings and a 4.58% forward yield for AT&T.
On Thursday, October 8, 2026, AT&T opened at $24.62, traded between a low of $24.50 and a high of $24.97, and closed at $24.87, against a previous close of $24.47 on October 7, 2026. The gain was 1.63% versus the previous close of $24.47 on October 7, 2026. Prices and technical indicators are from Twelve Data.
AT&T stock faces a mixed daily setup
The close stands above the 50-session exponential moving average at $24.8, but below the 20-session EMA at $24.9. The 200-session EMA at $24.97 also sits overhead. This is not a bullish alignment: the longer average is above both shorter averages, and price remains below two of them.
Meanwhile, daily RSI14 stands at 48.9, just below the neutral 50 threshold. The MACD line is -0.21, below its signal at -0.12, with a negative histogram of -0.09. These readings leave daily momentum short of a bullish confirmation.
The daily Bollinger mid-band at $25.15 is also above the close. Its lower and upper bands stand at $23.71 and $26.59, placing price inside the envelope but below its midpoint. Daily ATR14 reads $0.5, providing a volatility reference without establishing a directional bias.
Hourly strength does not resolve the daily resistance
In contrast, the close is above the hourly 20-hour EMA at $24.6 and the 50-hour EMA at $24.59. However, it remains below the 200-hour EMA at $25.02. The hourly structure supports the bullish side over shorter horizons, but it is not fully aligned.
Hourly RSI14 is 66.34, above 50 but below overbought territory. The hourly MACD line at 0.12 is above its signal at 0.07, with a positive histogram of 0.04. This conflicts with the negative daily MACD histogram rather than overturning the daily view.
Notably, the close sits above the hourly Bollinger mid-band at $24.56 and below the upper band at $24.96. Hourly ATR14 is $0.16. Nearby overhead levels remain relevant even with positive hourly momentum.
For execution context only, the 15-minute averages are bullishly aligned beneath the close. The 20-quarter-hour EMA is $24.79, above the 50-quarter-hour EMA at $24.66 and the 200-quarter-hour EMA at $24.64. RSI14 is 61.73, above 50 but not overbought. Price also sits above the 15-minute Bollinger mid-band at $24.76 and below its upper band at $25.05. ATR14 is $0.08.
Fiber coverage provides context, not proof of a price catalyst
Yahoo Finance’s report published on Wednesday, October 7, said AT&T agreed to fold its Gigapower assets into a new fiber joint venture. The partners are Global Infrastructure Partners and CPP Investments. Yahoo Finance reported a target of more than 60 million locations by 2030 and 50% ownership for AT&T. Its separate coverage described the venture as aiming to support debt reduction and growth.
At the same time, a Seeking Alpha article published on October 7 argued that the shares traded too cheaply. Seeking Alpha cited 10.37x 2026 earnings and a 4.58% forward yield. Those are the publication’s valuation claims, not technical confirmation of upside. An Investing.com report published after Thursday’s close described AT&T stock as tumbling, but its supplied snippet offered no AT&T-specific explanation.
Bullish and bearish conditions for the next session
Pivot levels and session references
When trading resumes, the daily pivot is $24.78, with first resistance at $25.06 and first support at $24.59. The hourly pivot is $24.86, with first resistance at $24.91 and first support at $24.84. The 15-minute pivot is also $24.86, with first resistance at $24.91 and first support at $24.84. These are next-session reference levels, not barriers established during Thursday’s trading.
Daily resistance levels overhead
The bullish scenario requires holding the daily 50-session EMA at $24.8 and clearing the 20-session EMA at $24.9. Beyond that, the daily 200-session EMA at $24.97 and hourly 200-hour EMA at $25.02 remain overhead. Clearing daily first resistance at $25.06 and the daily Bollinger mid-band at $25.15 would strengthen that case. Daily RSI above 50 and a MACD line above its signal would provide additional confirmation.
Daily support and downside references
Conversely, a break below the daily 50-session EMA at $24.8 and next-session daily pivot at $24.78 would weaken the bullish case. A break below daily first support at $24.59 and the session low at $24.50 would invalidate that support-based scenario. The daily lower Bollinger band at $23.71 is a further downside reference, not a projected destination.
Overall, AT&T stands above daily support but below several nearby resistance levels. Daily ATR14 of $0.5 frames the volatility, while positive hourly readings contrast with an unconfirmed daily bullish case. Whether price can clear those overhead levels remains unresolved.
FAQ
Where did AT&T stock close on Thursday?
AT&T closed at $24.87 on Thursday, October 8, 2026, gaining 1.63% from the previous close of $24.47 on October 7.
What are the key resistance levels for AT&T stock?
The daily 20-session EMA at $24.9, the daily 200-session EMA at $24.97, the hourly 200-hour EMA at $25.02, daily first resistance at $25.06, and the daily Bollinger mid-band at $25.15 all sit above Thursday’s close of $24.87.
What did Seeking Alpha report about AT&T?
A Seeking Alpha article published on October 7 argued that AT&T shares traded too cheaply, citing 10.37x 2026 earnings and a 4.58% forward yield. Those are the publication’s valuation claims.
What is the daily technical picture for AT&T?
Daily RSI14 is 48.9, below the neutral 50. The MACD line is -0.21, below its signal at -0.12, with a negative histogram of -0.09. The close at $24.87 sits above the daily 50-session EMA at $24.8 but below both the 20-session EMA at $24.9 and the 200-session EMA at $24.97.
Disclaimer: This article is for informational purposes only and does not constitute financial advice, an investment recommendation, or a solicitation to buy or sell any financial instrument. The analysis provided is not indicative of future results. Investing in financial markets carries a high risk of capital loss. Always do your own research (DYOR) and consult a qualified financial advisor before making any decision.
Cryptonomist and the author hold no positions in the financial instruments mentioned and receive no compensation from the companies covered.
Article produced with the assistance of artificial intelligence and reviewed by the editorial team.