



Key Highlights
Bitcoin trades at $83,032 (-1.45% 24h) as CryptoQuant's @DanCoinInvestor flags a historically consistent cycle-bottom signal
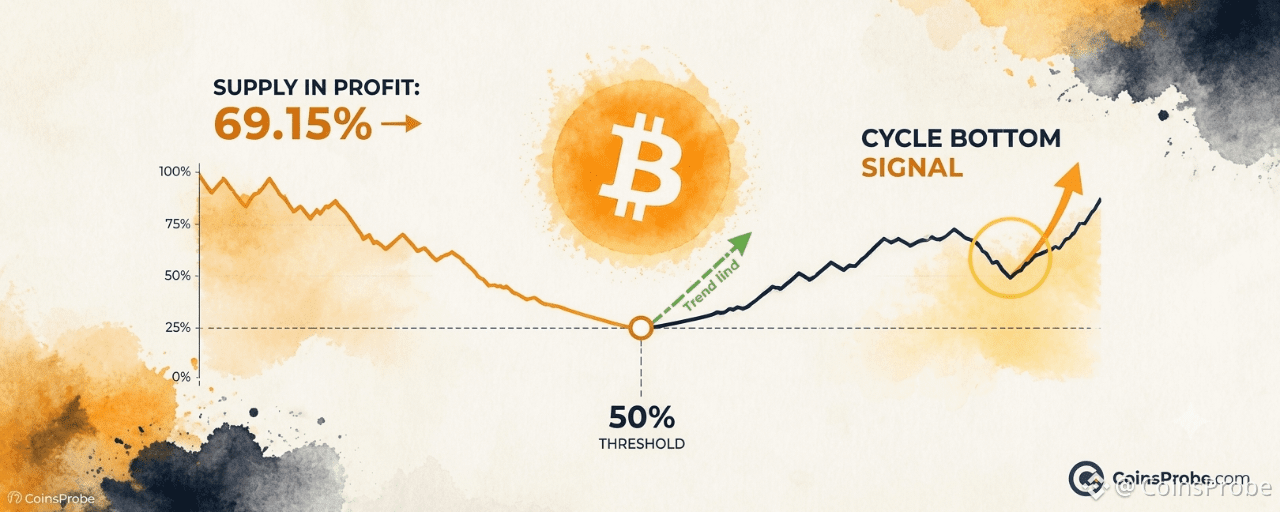
Supply in Profit at 69.15% is closing toward the 50% "kiss" threshold — a convergence that has marked every prior downtrend bottom
The same pattern completed in early 2023 and preceded Bitcoin's full uptrend cycle resumption
Confirmation requires the two lines to separate after convergence — that divergence has not yet occurred
Bitcoin is trading at $83,032 — down 1.45% in the past 24 hours — with a market capitalization of $1.67 trillion. Beneath the surface noise of daily price action, a structural signal is completing that CryptoQuant analyst @DanCoinInvestor identifies as the fingerprint of every major cycle bottom in Bitcoin’s history: the convergence and “kiss” of the profit ratio and loss ratio at the 50% threshold.
The signal was flagged by CryptoQuant’s official account (@cryptoquant_com) on October 8, 2026, with the analyst’s exact conclusion: “At the bottom of every downtrend cycle so far, the loss ratio and the profit ratio have kissed, and as the market shifted into an uptrend cycle, the two lines moved apart again.” The word “nearly” in the post’s title is the only qualifier — the completion of this pattern is in progress, not yet confirmed.
What the Profit/Loss Ratio “Kiss” Actually Measures
The Supply in Profit % and Supply in Loss % are on-chain metrics that track what percentage of all Bitcoin in circulation was last moved at a price lower or higher than the current market price. When the market rises sharply and holds high for an extended period, the profit percentage dominates — approaching 90% or higher at cycle peaks. When prices collapse and capitulation sets in, the loss percentage rises sharply, closing the gap with the profit percentage. The moment they converge near the 50% mark — when roughly half of all supply is underwater — is what @DanCoinInvestor calls the “kiss.”
The chart shared by @cryptoquant_com shows the current reading at Supply in Profit: 69.15% (down 7.41 percentage points, a -9.68% move) against a Realized Price of $53,823.88. The Supply in Loss % is partially converging toward the 50% dashed horizontal line on the lower panel — the structural threshold the analyst identifies as the historical inflection zone. The Bitcoin spot price labeled on the chart at the time of publication was $83,418.88, a figure derived from the chart annotation; the live price at time of writing is $83,032.
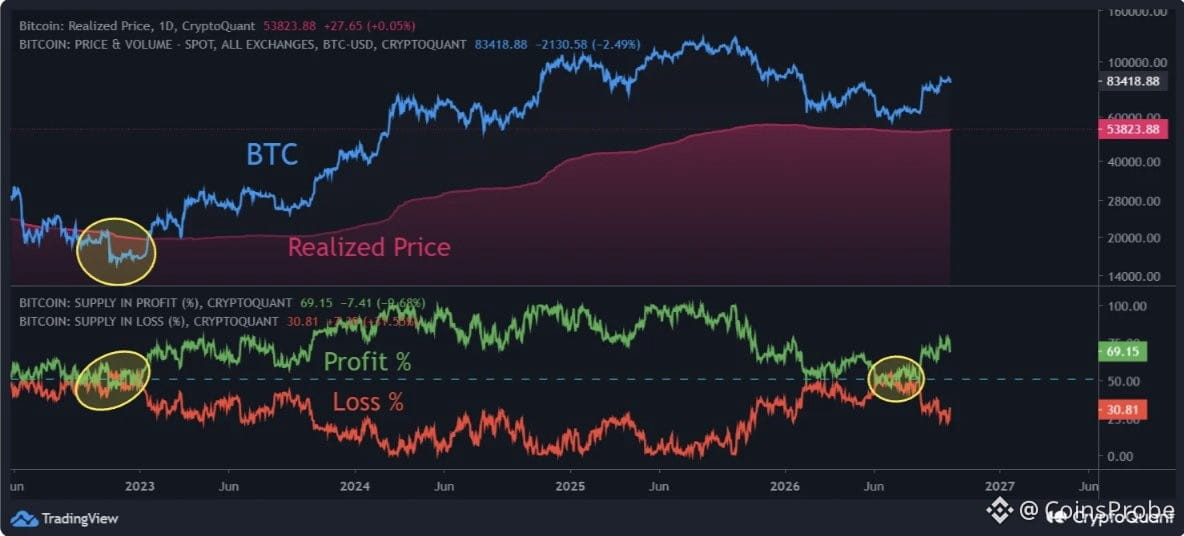
Chart Analysis | Source: @cryptoquant_com (X)
The Historical Pattern — Two Confirmed Instances, One Forming
The chart spans approximately mid-2022 to a projected axis extending toward mid-2027. Two yellow circles are annotated directly on the chart by the analyst. The first circle marks the early 2023 convergence — the moment the profit and loss ratios kissed near the 50% line during Bitcoin’s post-FTX bottom. That convergence preceded Bitcoin’s recovery from the $15,000–$16,000 range into a sustained multi-year uptrend. The second circle marks the current forming convergence in what the chart labels as mid-2026 — a structural echo of the 2023 signal at the same ~50% threshold.
The pattern is not subjective — it is defined by a measurable crossing of two on-chain lines at a specific ratio. At cycle peaks, profit supply is near 90%+ and loss supply near 0–10%. The “kiss” at 50% represents the point of maximum on-chain pain, where capitulation is most complete. @DanCoinInvestor’s thesis is that this precise moment — not a price level, but a ratio level — has marked the end of every downtrend cycle in Bitcoin’s data history.
It is worth being precise about what the signal does and does not state. The analyst describes the pattern as having occurred “at the bottom of every downtrend cycle so far” — this is a historical observation across a limited number of cycles. The current convergence is described as “nearly completed,” which means the kiss has not yet been confirmed as complete. The signal’s track record is grounded in on-chain data, but Bitcoin has experienced only a small number of full market cycles since 2012, which is the relevant sample size for any historical claim of this type.
For readers tracking Bitcoin’s broader on-chain structure, the recent reading that Bitcoin failed to hold its Active Realized Price adds context to where the current cycle stands relative to prior structural thresholds.
What “Nearly Completed” Means — The Confirmation Condition
@DanCoinInvestor’s language is deliberate. The post states the market has “nearly completed” its shift — not completed it. In prior cycles, the confirmation came when the two lines began moving apart again after the kiss, with the profit ratio turning back upward and the loss ratio declining. That divergence — the separation after the convergence — is the signal of cycle transition, not the convergence itself.
At a current Supply in Profit of 69.15%, the lines have not yet kissed at 50%. The metric has moved sharply downward (-9.68% in the measured period), closing the gap toward the threshold. The signal is in the approach phase. Whether it completes the kiss and then separates — which would constitute full confirmation on the historical pattern — is the testable condition @DanCoinInvestor is flagging.
The distinction matters. A signal “in progress” and a signal “confirmed” carry different weight. The analyst’s post communicates the former — a high-probability structural setup based on historical pattern matching, not a completed reversal declaration.
What the Realized Price of $53,823 Tells Us
The Realized Price — currently $53,823.88 per the chart — represents the average cost basis of all Bitcoin in circulation, weighted by when each coin last moved. Bitcoin trading at $83,032 means the market is approximately 54% above aggregate cost basis. This is not a signal in isolation, but it provides structural context: the market is not in deep aggregate loss territory at the current price. The on-chain loss percentage rising despite price being above realized price reflects the distribution of cost basis across the supply — a significant portion of coins were acquired at prices above $83,032 during the prior peak, pulling the Supply in Loss % higher even at current levels.
Bullish and Bearish Scenarios
Bullish Scenario — Pattern Completes and Lines Diverge
If the Supply in Profit % and Supply in Loss % complete their convergence at the 50% threshold and then begin separating — with profit supply rising and loss supply declining — the historical pattern described by @DanCoinInvestor would be confirmed. In the 2023 instance, this divergence initiated the uptrend cycle. The structural implication, per the analyst’s framework, is that a downtrend-to-uptrend transition would be underway. No specific price target is stated in the analyst’s note.
Bearish Scenario — Profit % Continues Lower Without Separation
If the Supply in Profit % continues declining past the 50% convergence zone without bouncing — meaning capitulation deepens further and the lines do not separate — the historical pattern would fail to complete on schedule. This would require Bitcoin’s price to fall materially further to push more supply into loss territory. The analyst does not specify a failure level in the published note.
For context on how other assets are positioned relative to their structural levels during this same period, the bearish setups flagged by analysts for LINK, ADA, and SOL illustrate that the broader crypto market is navigating similarly contested technical territory.
CryptoQuant analyst @DanCoinInvestor has identified a historically consistent on-chain signal: the convergence of Bitcoin’s Supply in Profit % and Supply in Loss % near the 50% threshold has marked the bottom of every prior downtrend cycle in the data. The current reading places Supply in Profit at 69.15% — moving toward that threshold but not yet at it. The confirmation signal, per the analyst’s own framework, is the subsequent separation of the two lines after the kiss — the profit ratio turning back upward. That event has not yet occurred. Watch the Supply in Profit % for a confirmed trough near 50%, followed by a directional reversal upward, as the on-chain condition that would complete the historical pattern.
Disclaimer: The views and analysis presented in this article are for informational purposes only and reflect the author’s perspective, not financial advice. Technical patterns and indicators discussed are subject to market volatility and may or may not yield anticipated results. Investors are advised to exercise caution, conduct independent research, and make decisions aligned with their individual risk tolerance.