

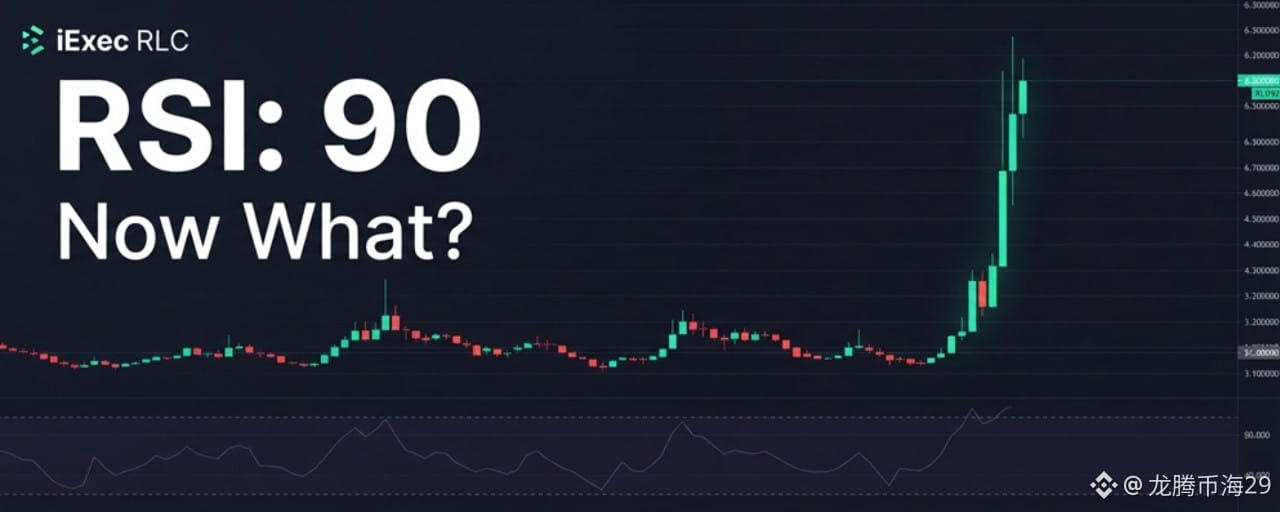

Most traders watching the crypto market this week are still fixated on Bitcoin's grind toward $87,000 or QNT's violent repricing from $60 to $300. Meanwhile, a small-cap token nobody was talking about five days ago just delivered a 100%+ move in under 48 hours, and the derivatives data behind it tells a story that is equal parts fascinating and concerning.
iExec RLC (RLC) traded in the mid-$0.30s on October 4. By October 5, it had ripped above $0.74, with CoinGecko showing a 24-hour gain of 58.7% at one point and intraday highs touching $0.635 before extending further. Binance's RLC/USDT perpetual contract saw open interest climb above $22 million, and 24-hour liquidations hit $1.23 million, with short liquidations accounting for roughly $928,000 of that total. Longs made up just $297,000 of the liquidated positions.
That ratio is the first clue. When short liquidations outnumber long liquidations by more than 3-to-1 during a sharp rally, the move is being driven by forced buying, not organic demand. Shorts getting squeezed have to buy back their positions, which pushes price higher, which triggers more short liquidations. It is a reflexive loop, and it can accelerate violently. It can also reverse just as fast when the forced buying exhausts itself.
The Technical Picture: Extreme, Not Healthy
The technical indicators on RLC are flashing warnings that experienced traders should not ignore. The relative strength index (RSI) on the daily timeframe has pushed above 90. For context, an RSI reading above 70 is traditionally considered overbought. An RSI above 90 is not just overbought, it is a statistical outlier that reflects an almost uninterrupted string of green candles. The 30-candle amplitude on RLC hit 52.84%, meaning the token's price range over that period was wider than most mid-cap altcoins move in an entire quarter.
The moving average structure does show a bullish alignment, with the 5-period MA at approximately $0.466 having crossed decisively above the 20-period MA at $0.394. The MACD histogram remains in positive territory with a reading of +0.01729. Price also broke above the upper Bollinger Band at $0.495.
Here is the problem with that setup. When price is trading above the upper Bollinger Band and RSI is above 90 simultaneously, the probability of a mean-reversion move increases significantly. The Bollinger Band squeeze that preceded this breakout has now expanded into a full volatility spike. The MA5 at $0.466 is the nearest structural support. Below that, the $0.36 to $0.40 zone represents the pre-breakout consolidation range where the move originated.
The Funding Rate Anomaly
One of the more unusual details in this setup is the funding rate. Despite RLC's price ripping higher, the funding rate on Binance's RLCUSDT perpetual contract has been reported in negative territory at points during the rally, with readings as low as -0.0366%. A negative funding rate means shorts are paying longs, which is the opposite of what you would typically expect during a leveraged rally driven by long-side speculation.
There are two ways to interpret that. The bullish read is that the negative funding rate reflects persistent short-side conviction that is now being proven wrong, and the pain trade continues higher as more shorts capitulate. The bearish read is that the negative funding rate indicates the rally is not being driven by fresh long-side leverage at all, but by a reflexive squeeze in a thin order book. In the second scenario, once the forced buying stops, there is no natural bid underneath to catch the price.
What Actually Drove This Move
I searched for a fundamental catalyst. There wasn't one. iExec did not announce a major partnership, an exchange listing, or a protocol upgrade during this window. The Bellecour sidechain bridge sunset happened back in July 2026, and Nox Protocol v0.1.0 was released in April. Neither of those is a fresh trigger for a 100% move in October.
The narrative that Binance Square discussions attached to the move was the privacy and RWA (real-world asset) story. iExec's core product is decentralized cloud computing with a focus on confidential computing and privacy layers, which does fit the broader AI and data-privacy meta that has been gaining traction. But according to analysis of the move, there was no new economic trigger on the day. The price moved first. The narrative was constructed afterward to explain it.
This pattern is important because it tells you what kind of move this is. When price leads and narrative follows, the move is reflexive and sentiment-driven. Reflexive moves can continue for longer than fundamentals would justify because the market's own reaction becomes the catalyst. They can also collapse the moment the reflexive feedback loop breaks.
What Bulls Need to Prove Next
For this move to have legs beyond the squeeze mechanics, RLC needs to hold above $0.466 (the MA5) on any retest and demonstrate that buying volume persists even without forced short liquidations. The next meaningful resistance zone sits around the prior local high near $0.74, which was already tested and rejected once. A clean break and hold above that level would signal that real demand, not just short covering, is absorbing supply.
The more convincing signal would be a funding rate that flips positive and stays positive while price consolidates. That would indicate traders are willing to pay to hold long positions, which suggests conviction rather than mechanical forced buying.
What Could Invalidate This Entire Setup
The single biggest risk here is a breakdown below $0.36. That was the base of the consolidation range before the squeeze began. If RLC retraces to that level, it means the entire move was given back, and the traders who chased the rally are now underwater. According to market commentary, leveraged long positions have already piled up during this rally. A break of key support below $0.36 could trigger mass long liquidations and create a downward spiral that is just as violent as the short squeeze that drove the price up.
The funding rate deserves monitoring closely. If it flips sharply positive while price is stalling, that would suggest longs are becoming overleveraged, which increases the probability of a long squeeze. Conversely, if funding stays negative and price continues to grind higher, that would indicate the short side remains trapped, which could extend the squeeze.
The Trader Takeaway
RLC is a textbook example of why you should never chase a vertical candle. The RSI at 90 is not a buy signal. It is a warning that the move has become disconnected from normal price discovery. The short squeeze mechanics that drove this rally are real, and they were powerful, but they are also finite. Shorts can only cover once. Once they are out, the forced buying stops, and the price has to stand on its own.
For traders who already hold RLC from lower levels, the question is whether to take profits into this strength or wait for confirmation that the move can sustain. For traders who are not in, the risk-reward at these levels is heavily skewed against chasing. If you want exposure, waiting for a retest of the $0.466 support or a sustained hold above $0.74 would provide a much clearer picture of whether this is a genuine trend or a squeeze that is running out of fuel.
RLC is a legitimate project with a real product in the decentralized confidential computing space. That does not mean the current price reflects fair value. It reflects a reflexive market dynamic that has temporarily overwhelmed normal price discovery. Respect the move, but respect the risk even more.
