
Date: 5 October 2026
Market view: Bullish / confirmation-sensitive
Primary timeframe: 7-day daily closes, with live snapshot for the current session
Why this coin deserves attention today
$BTC is back above $86K, but the real question is whether this breakout can hold. The interesting part of today's setup is not simply the percentage move. It is the relationship between the current live price, the recent closing range, liquidity and the broader market regime.
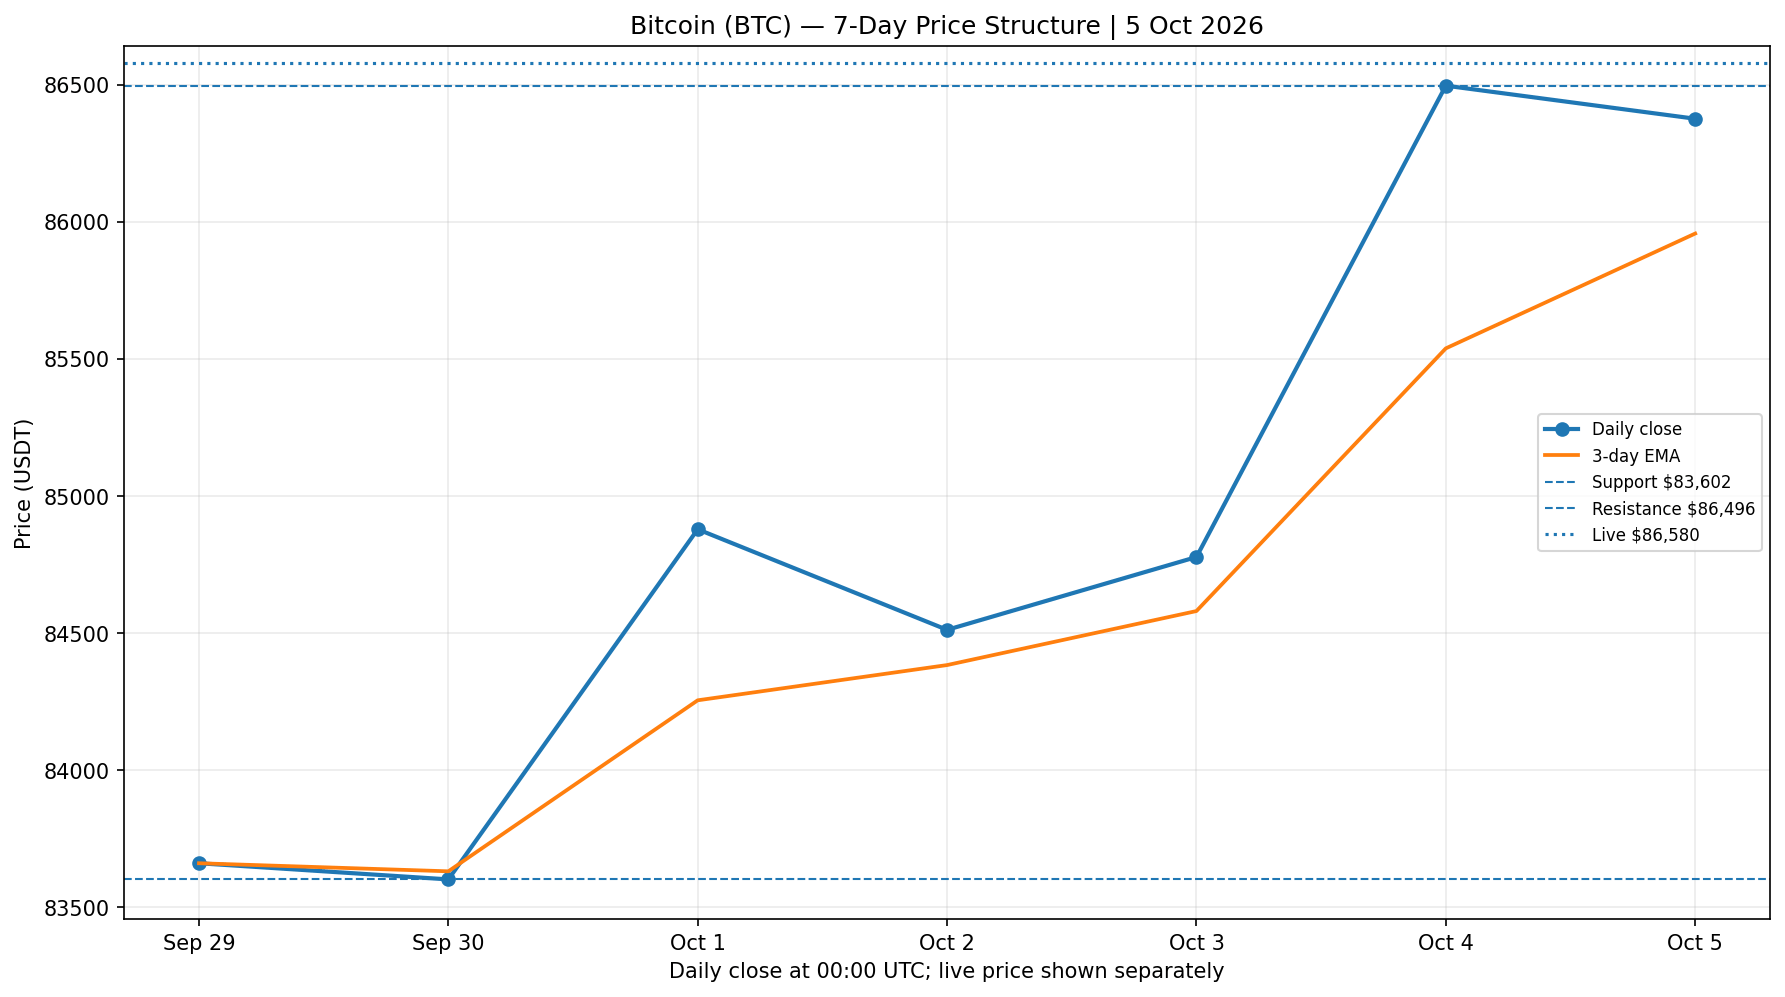
The seven-day closes are stair-stepping higher, and the current live price sits above the seven-day closing high. That is constructive, but it also means the market is testing a zone where profit-taking can appear.
Trend continuation versus a crowded short-term momentum trade is the core trading question. This is not a call that price must move in one direction; it is a framework for deciding which confirmation would make the setup stronger and which level would invalidate it.
Market snapshot
Data note: The live snapshot comes from CoinMarketCap's current market page. The technical chart uses CoinMarketCap daily USDT closes recorded at 00:00 UTC. Because crypto trades continuously, a live price and a daily close will not always match exactly.
Market structure
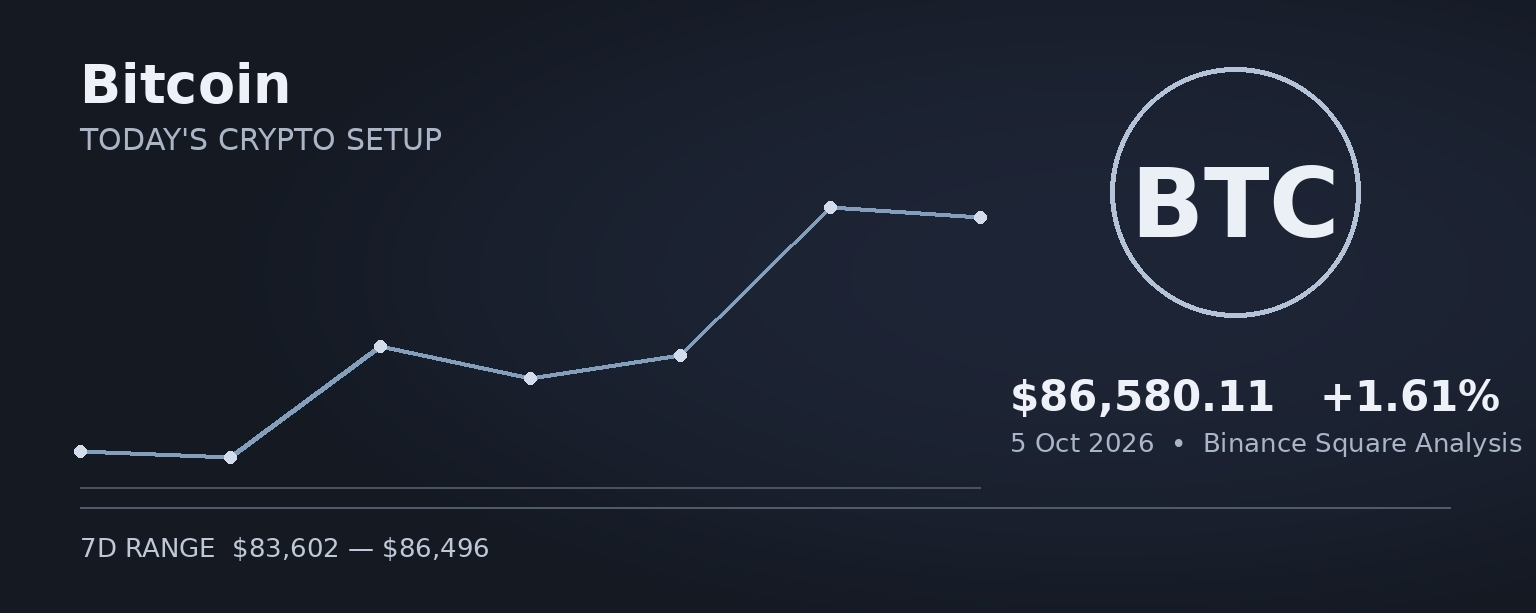
The seven-day closing range is $83,602 to $86,496. The closing-window change is +3.24%. The 3-period EMA calculated from those closes is $85,957.
Current price is above that short EMA. That is useful as a short-term trend filter, but it should not be treated as a standalone signal.
The market is best described as bullish on this short window. The most important question is whether buyers can establish acceptance above the recent high rather than briefly trading through it. Conversely, a loss of the recent low would change the short-term structure from recovery/continuation into a deeper retracement.
Technical analysis
Momentum
The 5-period RSI calculated from the seven daily closes is 87.0. That reading suggests strong/overheated short-term momentum.
RSI is a momentum measure, not a timing guarantee. In strong trends it can remain elevated for longer than expected; in falling markets it can remain weak even after a bounce begins.
Range and EMA
Price is interacting with a clearly defined recent range. The 3-EMA at $85,957 provides a simple dynamic reference: holding above it supports continuation, while repeated closes below it would suggest momentum is fading.
Volume and liquidity
24-hour turnover is approximately 1.48% of market capitalization. That is a useful liquidity/participation measure, but it is not the same as order-book depth. High turnover can support a breakout, yet it can also accelerate liquidation when positioning is crowded.
Key levels
These levels are derived from the seven daily closes, not guaranteed targets:
- Support zone: $83,602 — the lowest close in the window.
- Resistance zone: $86,496 — the highest close in the window.
- Breakout confirmation: sustained trade/close above roughly $87,361.
- Invalidation reference: below roughly $82,766.
- Potential target zone 1: around $87,943 if the breakout holds.
- Potential target zone 2: around $89,391 in a stronger range-expansion scenario.
The target zones are mechanical extensions of the observed range, not predictions. A trader should reassess them if market structure changes.
Fundamental / ecosystem context
Bitcoin remains the benchmark crypto asset and the primary liquidity anchor for the broader market.
MarketWatch reports a 50-day/200-day golden cross after a rebound of more than 40% from the 2026 lows; Barron's also reports that softer U.S. jobs data reduced near-term rate-hike expectations. Recent coverage also points to renewed spot-Bitcoin ETF inflows and continued regulatory rulemaking.
For this article, the fundamental case is intentionally separated from the technical setup. A strong project does not guarantee a strong token trade, and a strong chart does not prove improving fundamentals.
Catalysts to watch
1. Price acceptance: Can the market close beyond the current resistance area rather than only wick through it?
2. Volume confirmation: Does turnover expand with the breakout, or does price rise while liquidity thins?
3. Bitcoin regime: Large-cap altcoins remain sensitive to BTC direction and broader risk appetite.
4. Coin-specific development: MarketWatch reports a 50-day/200-day golden cross after a rebound of more than 40% from the 2026 lows; Barron's also reports that softer U.S. jobs data reduced near-term rate-hike expectations. Recent coverage also points to renewed spot-Bitcoin ETF inflows and continued regulatory rulemaking.
Bear case
A failure to hold the recent breakout zone would turn the move back into a range, while high yields or leveraged positioning could amplify a pullback. A second bearish path is a broader crypto reversal. If Bitcoin loses its current recovery structure, high-beta assets can underperform even when their individual charts initially look constructive.
The most important warning sign is therefore not a single red candle. It is a sequence of lower highs and lower lows accompanied by failed attempts to reclaim the recent range.
Bull case
The bullish case becomes stronger if price holds above the 3-EMA, breaks the recent high, and then turns that former resistance into support. A breakout accompanied by strong liquidity would be more convincing than a thin-volume spike.
For the most aggressive momentum names, the bull case also requires accepting that volatility can expand dramatically. Confirmation matters more than prediction.
Trader scenarios
🟢 Bullish scenario: Price closes above $87,361, volume remains healthy, and the former resistance begins acting as support. The range-extension zones become the next areas to monitor.
🟡 Neutral scenario: Price remains between $83,602 and $86,496. Range trading may dominate, with false breakouts possible.
🔴 Bearish scenario: Price loses $82,766 and fails to reclaim the range floor. That would invalidate the current continuation/recovery thesis and shift attention to lower support.
Risk management
This is market analysis, not financial advice. Position size should reflect volatility rather than conviction. A useful framework is to define the invalidation level before entry, keep risk per trade small enough that a normal crypto volatility spike is survivable, and avoid increasing size simply because price is moving quickly.
For high-turnover assets such as BTC, slippage and liquidation risk can rise sharply during fast moves. Do not treat the mechanical target zones above as guaranteed outcomes.
Community question
Is BTC's next clean move more likely to come from spot demand or another leverage-driven squeeze?
Hashtags
#Bitcoin #BTC #CryptoAnalysis #BTCUSDT #BinanceSquare
Source note: Current market snapshot: CoinMarketCap, retrieved 5 Oct 2026. Technical history: CoinMarketCap USDT daily-close history. News/catalyst notes are based on current/recent reporting from MarketWatch, Barron's, CoinDesk and Cointelegraph where cited in the brief. Prices and market conditions can change continuously after publication.