



Key Highlights
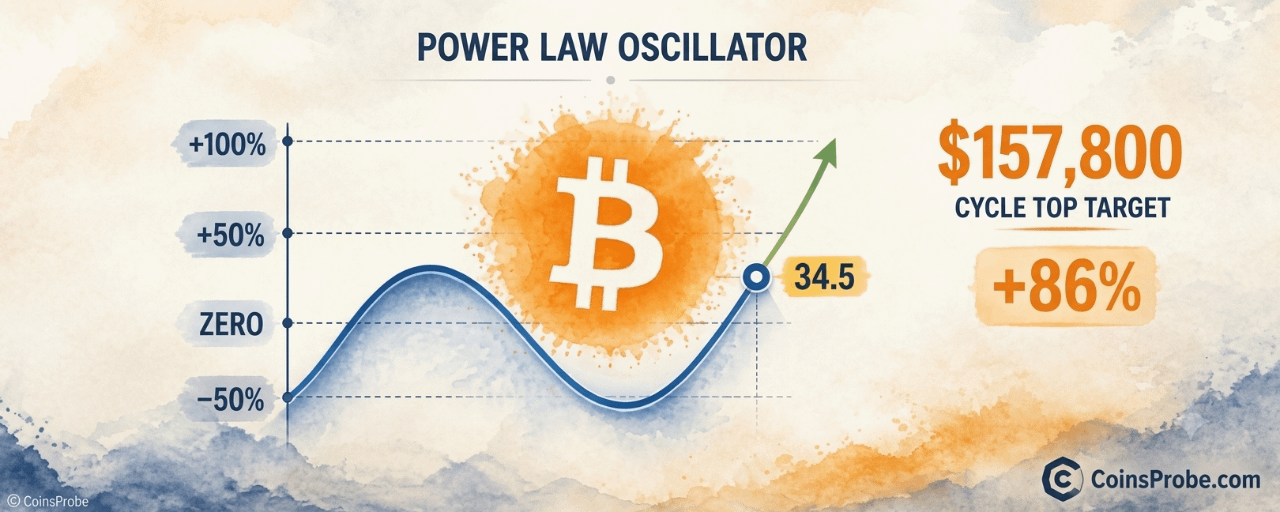
As of 3 October, Axel Adler Jr.’s Power Law Oscillator stood at +34.5, with Bitcoin at $84,700.
Under those same parameters, the +100 threshold corresponds to $157,800, about 86% above that $84,700 print. Adler calls it a reference level, not a price target.
The note’s main finding is compression: oscillator peaks fell from +169 in 2018 to +102 in 2025, and the standard deviation of daily changes fell from 4.81 to 2.47, a 49% decline.
$157,800 is the price that would put the oscillator at +100 if the 3 October regression parameters stay fixed. It rises if the Power Law line rises. It is not a forecast of the next cycle top.
**Bitcoin’s Power Law Oscillator **was +34.5 on 3 October, with the price at $84,700, according to a CryptoQuant Quicktake by Axel Adler Jr. published the next day and reposted by CryptoQuant. The same note says the +100 threshold maps to $157,800 under those parameters, roughly 86% above the price used in the calculation.
That 86% gap is tied to the 3 October price, not to a later spot print. Adler’s sentence is: “Based on the model’s parameters as of October 3, the +100 threshold corresponds to a price of $157.8K, roughly 86% above the current price. This is a reference price level: if the regression parameters remain unchanged, it will rise as the Power Law line rises.”
What the oscillator measures
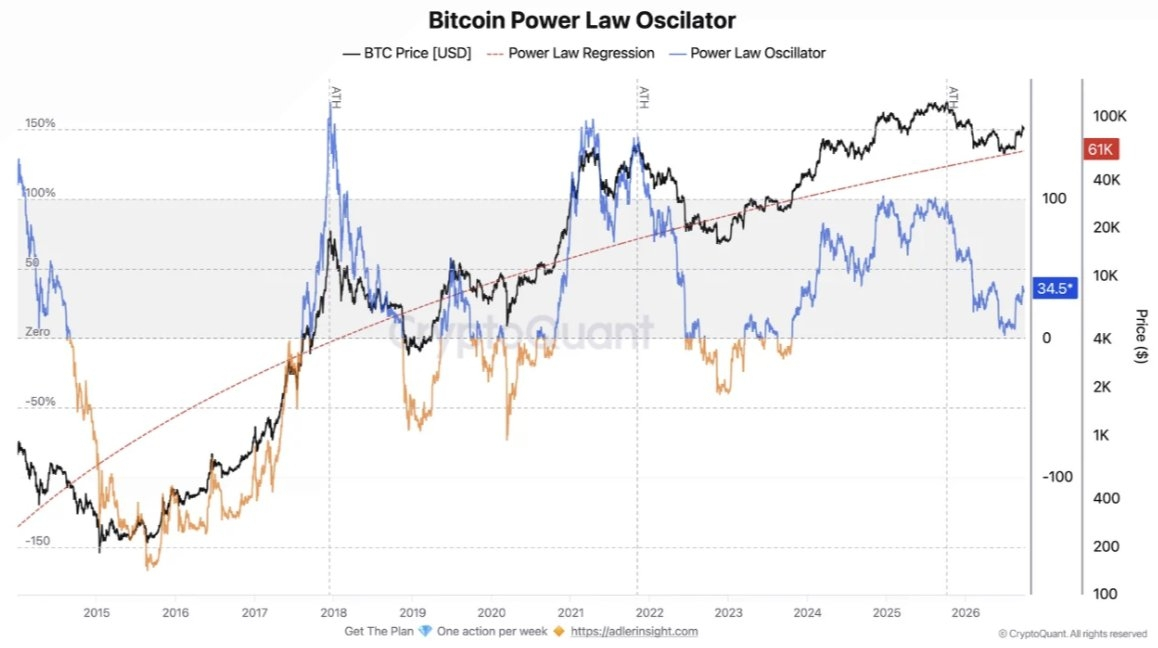
The oscillator is the distance between Bitcoin’s price and a long-run Power Law regression of price on time. On the chart Adler published, the scale is marked at −150, −50, Zero, +50, +100 and +150. Zero is the regression line. A positive reading means price is above that line.
The chart also plots Bitcoin’s price, the Power Law regression, and an orange prior-cycle line. Three all-time-high marks sit near earlier oscillator spikes. Those spikes were above +100. Adler’s own figures put the 2018 peak at +169 and the 2025 peak at +102. The +100 line is a threshold he uses as a reference, not a level that has equalled every cycle top.
The finding in the note
The Quicktake is about how wide those swings have become, not about a target.
Over the past ten years, fluctuations around the Power Law line have become less pronounced. Oscillator peaks declined from +169 in 2018 to +102 in 2025. The standard deviation of daily changes fell from 4.81 to 2.47 points, a 49% decline. As of 3 October the oscillator was +34.5, with Bitcoin at $84,700.
A reading of +34.5 is above the regression line and well below both the +100 threshold and the +102 peak recorded in 2025. The note does not define +34.5 as a mid-cycle expansion zone, and it does not say that similar readings have preceded a move to +100.
Bitcoin Power Law Oscillator | Source: @cryptoquant_com (X)
How $157,800 is derived
$157,800 is not a level printed on the chart. Adler solved for the price at which the oscillator would equal +100, using the model parameters as of 3 October. At the $84,700 price that day, that distance was about 86%.
If the regression parameters do not change, that reference price rises as the Power Law line rises. It is not fixed. The note does not say Bitcoin will reach it, or when.
What the model says, and what it does not
It says that, on 3 October parameters, +100 corresponded to $157,800, about 86% above $84,700, and that peaks and daily deviations around the Power Law line have narrowed over ten years.
It does not say $157,800 is fair value. It does not say +100 has marked every cycle top since 2014. The peaks Adler cites were +169 and +102. It does not say 86% of upside remains before the next peak, and it does not give a date.
What would change the reading
The reference level moves if the regression parameters change. A lower oscillator moves the price farther from the +100 threshold; a higher one moves it closer. Adler does not give an invalidation price. The figure he ties to the model is the 3 October pair: oscillator +34.5, Bitcoin $84,700.
Frequently asked questions
What does a reading of +34.5 mean?
It means that on 3 October, Bitcoin at $84,700 was above Adler’s Power Law regression by 34.5 oscillator points. The +100 threshold, on the same parameters, was $157,800. The 2025 peak on this oscillator was +102, and the 2018 peak was +169.
Why $157,800?
That is the price Adler’s 3 October parameters assign to an oscillator reading of +100. He describes it as a reference level that rises with the Power Law line if the parameters stay unchanged.
Has +100 marked every cycle top?
Not on Adler’s numbers. He reports peaks of +169 in 2018 and +102 in 2025. Both were above +100. The chart’s all-time-high marks sit on those spikes. The note’s point is that the spikes have compressed.
Disclaimer: The views and analysis presented in this article are for informational purposes only and reflect the author’s perspective, not financial advice. Technical patterns and indicators discussed are subject to market volatility and may or may not yield anticipated results. Investors are advised to exercise caution, conduct independent research, and make decisions aligned with their individual risk tolerance.