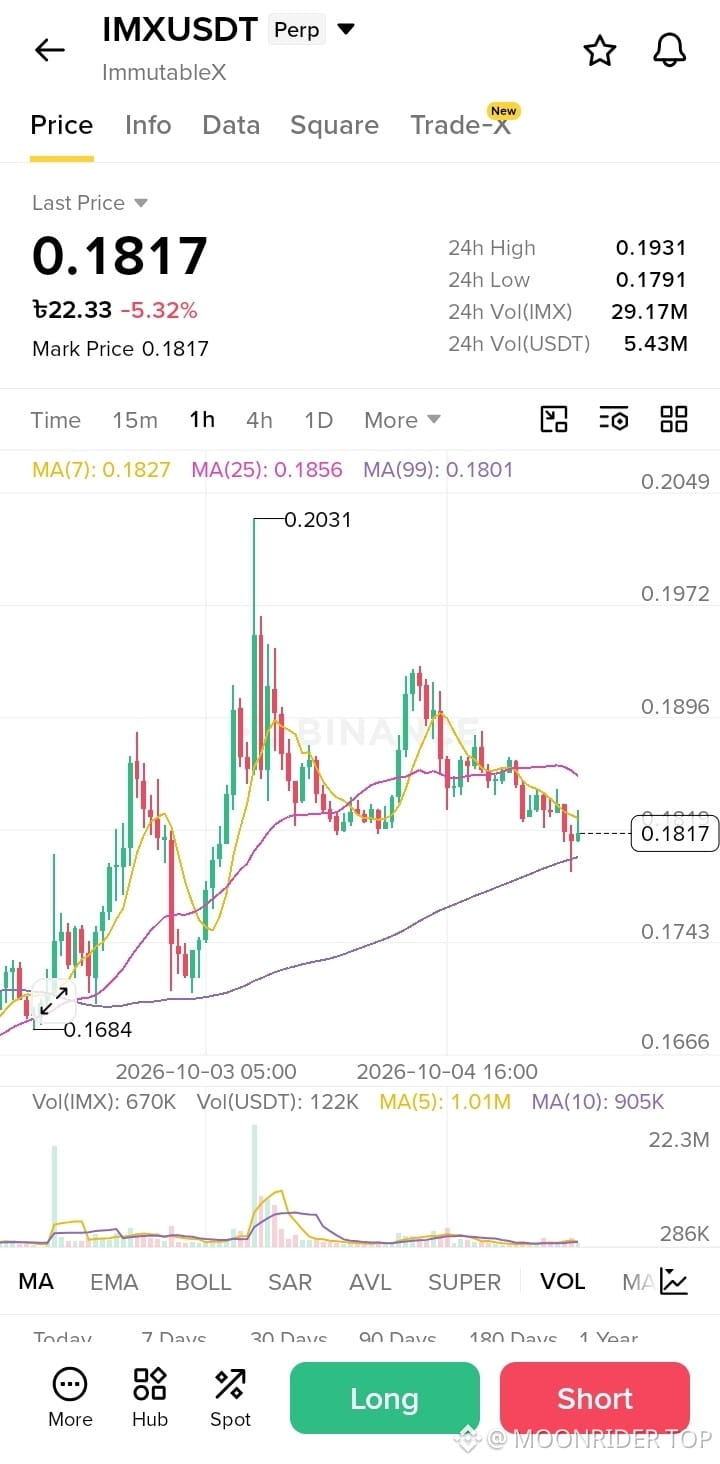
Everyone is waiting for a breakout—I am watching $IMX / USDT completing a textbook chart setup on the 1h timeframe, signaling a massive shift in short-term momentum.
LONG (1h Reversal Setup)
Trade Plan:
* Entry Zone: 0.1750 – 0.1817
* SL: 0.1650
* TP1: 0.2031
* TP2: 0.2200
* TP3: 0.2450
* TP4: 0.2750
Why this setup?
According to the 1h chart, $IMX is trading with solid consolidation following a successful defense of the structural support near 0.1684, stabilizing nicely after a -5.32% daily pullback. The price action is compressing right around the dynamic moving average cluster, with the MA(7) at 0.1827 and MA(25) at 0.1856 acting as immediate overhead levels, while the baseline MA(99) at 0.1801 provides steady backing. With a strong volume presence (5.43M USDT volume), this base-building setup is primed to challenge the major swing high of 0.2031 and expand toward higher overhead resistance zones.
Debate:
What do you think? Will IMX aggressively break through the swing high at 0.2031, or will we see a slight retest of the lower support lines before the secondary expansion? Drop your analysis below!$IMX
LONG (1h Reversal Setup)
Trade Plan:
* Entry Zone: 0.1750 – 0.1817
* SL: 0.1650
* TP1: 0.2031
* TP2: 0.2200
* TP3: 0.2450
* TP4: 0.2750
Why this setup?
According to the 1h chart, $IMX is trading with solid consolidation following a successful defense of the structural support near 0.1684, stabilizing nicely after a -5.32% daily pullback. The price action is compressing right around the dynamic moving average cluster, with the MA(7) at 0.1827 and MA(25) at 0.1856 acting as immediate overhead levels, while the baseline MA(99) at 0.1801 provides steady backing. With a strong volume presence (5.43M USDT volume), this base-building setup is primed to challenge the major swing high of 0.2031 and expand toward higher overhead resistance zones.
Debate:
What do you think? Will IMX aggressively break through the swing high at 0.2031, or will we see a slight retest of the lower support lines before the secondary expansion? Drop your analysis below!$IMX