
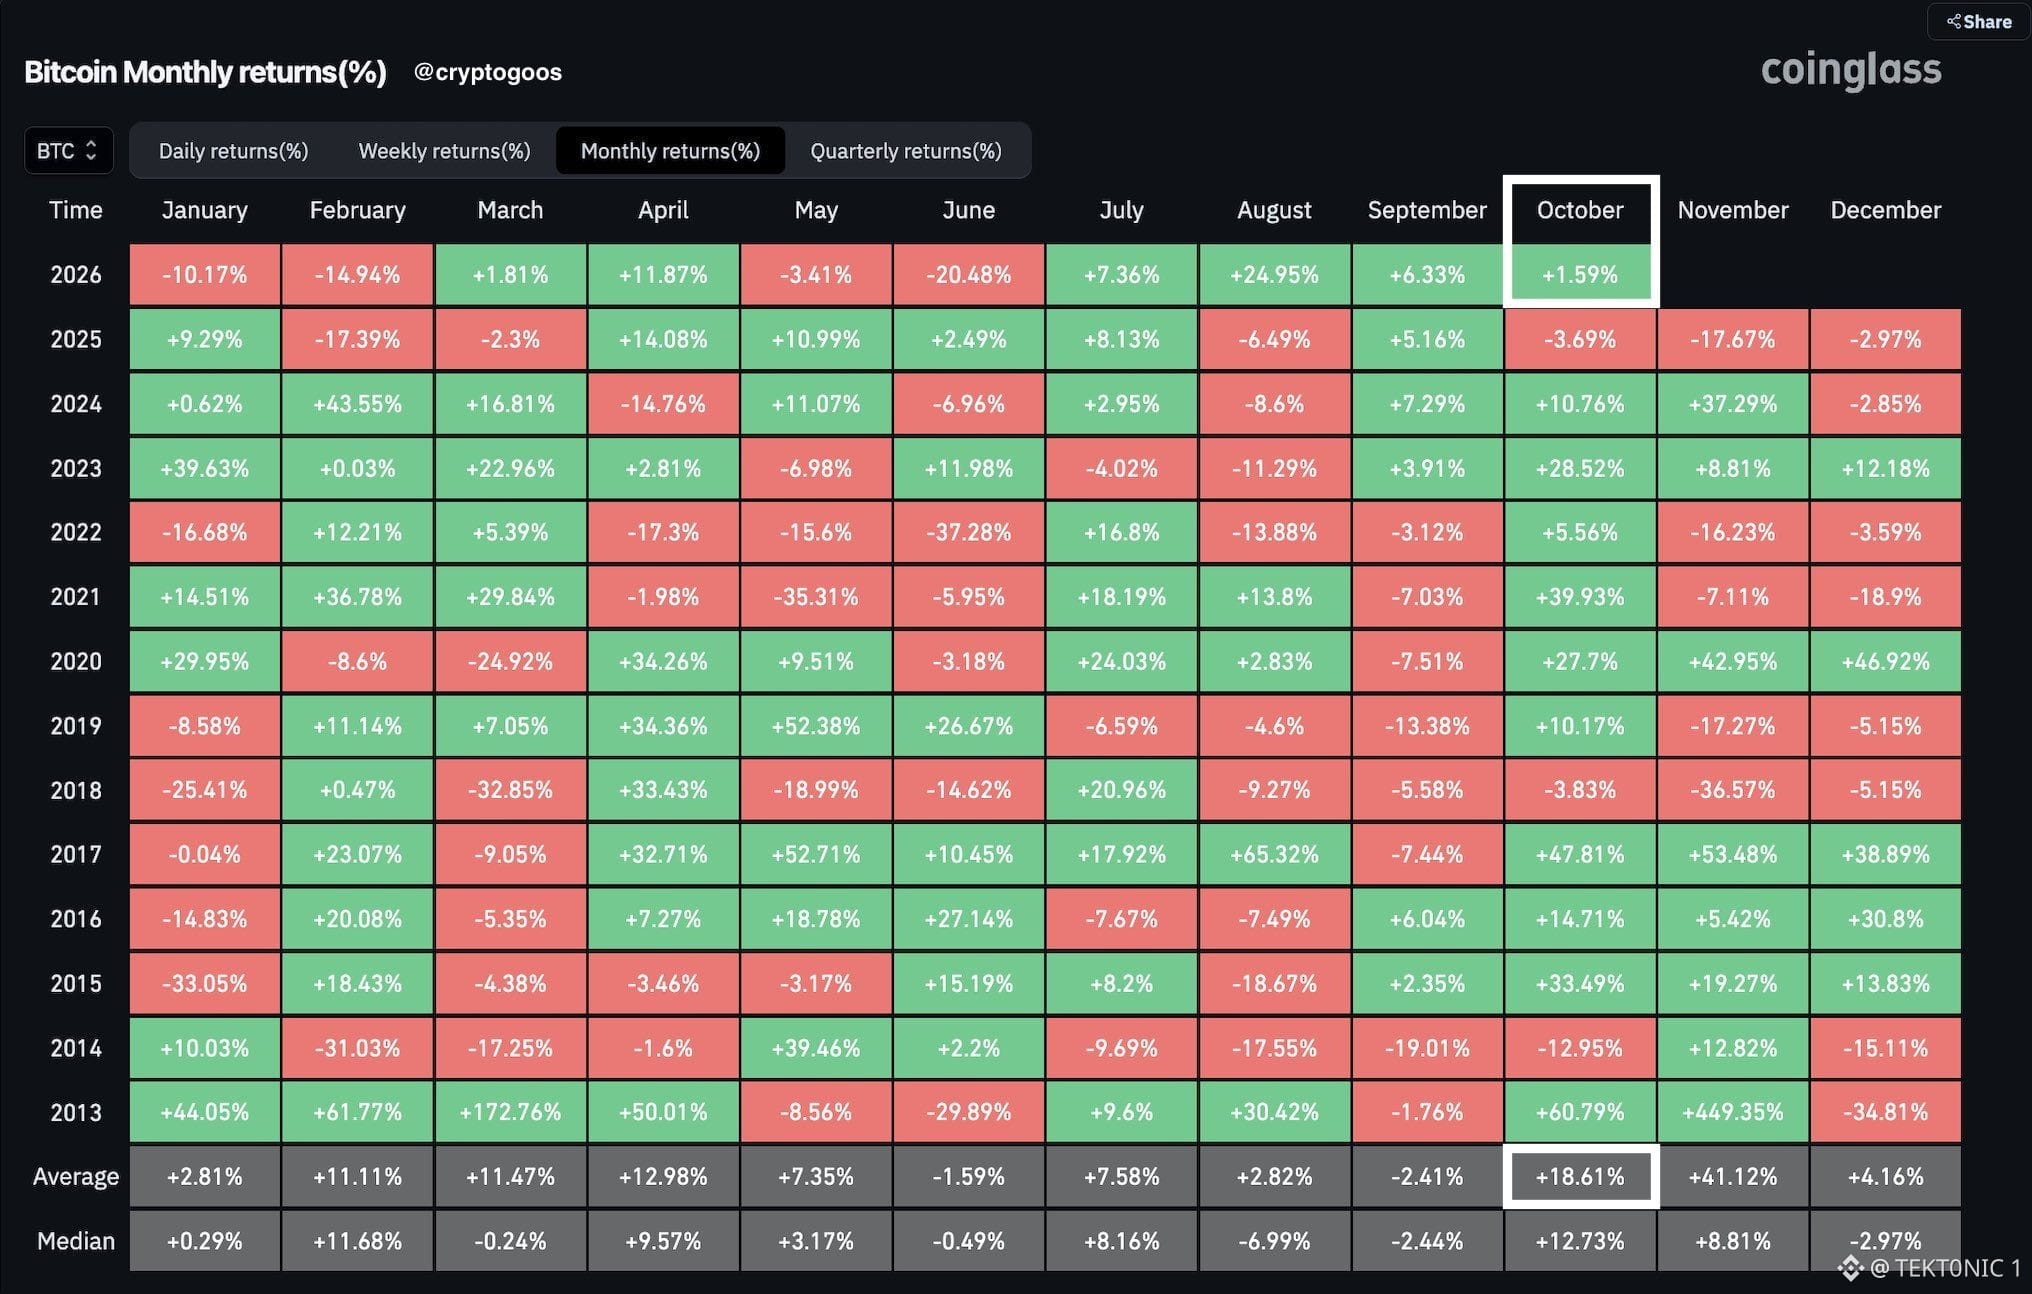
$BTC is up 1.59% so far in October, according to Coinglass. The average October on this table is +18.61%. The median is +12.73%. the average is the outlier years. 2013 was +60.8%. 2017 was +47.8%. 2021 was +39.9%. Strip those out and the middle of the set sits nearer +13%. Two Octobers finished red: 2018 at −3.8%, and 2025 at −3.7%. Last October is the recent one, and it was red. this month has four days on the board. A 1.59% start does not price an 18% month. From about $84,750, the average would land near $100,500. The median would land nearer $95,500. Kalshi still prices a trade through $100,000 by year-end around 40%. September closed +6.33%, the fourth green month in a row. Q3 was +42.6%. The seasonal average did not save October 2025. the month is still early for $BTC . Hold $84,750 and the average is still in reach. Lose it and last October is the closer comparison. we go again >>> #BTC Price Analysis# #Bitcoin Price Prediction: What is Bitcoins next move?# #Bullish $ZEC


Publicación
Aviso legal: Incluye opiniones de terceros. No es asesoramiento. Binance Ai puede utilizarse sin garantía. Consultar Términos y condiciones.