


Invesco QQQ Trust stock closed at $737.93 on Tuesday, September 29, gaining 0.19% from Monday’s $736.53 close. Tuesday’s session opened higher at $740.15 before a 0.30% intraday pullback. The daily uptrend holds firm, yet fading hourly momentum signals a market catching its breath near record levels.
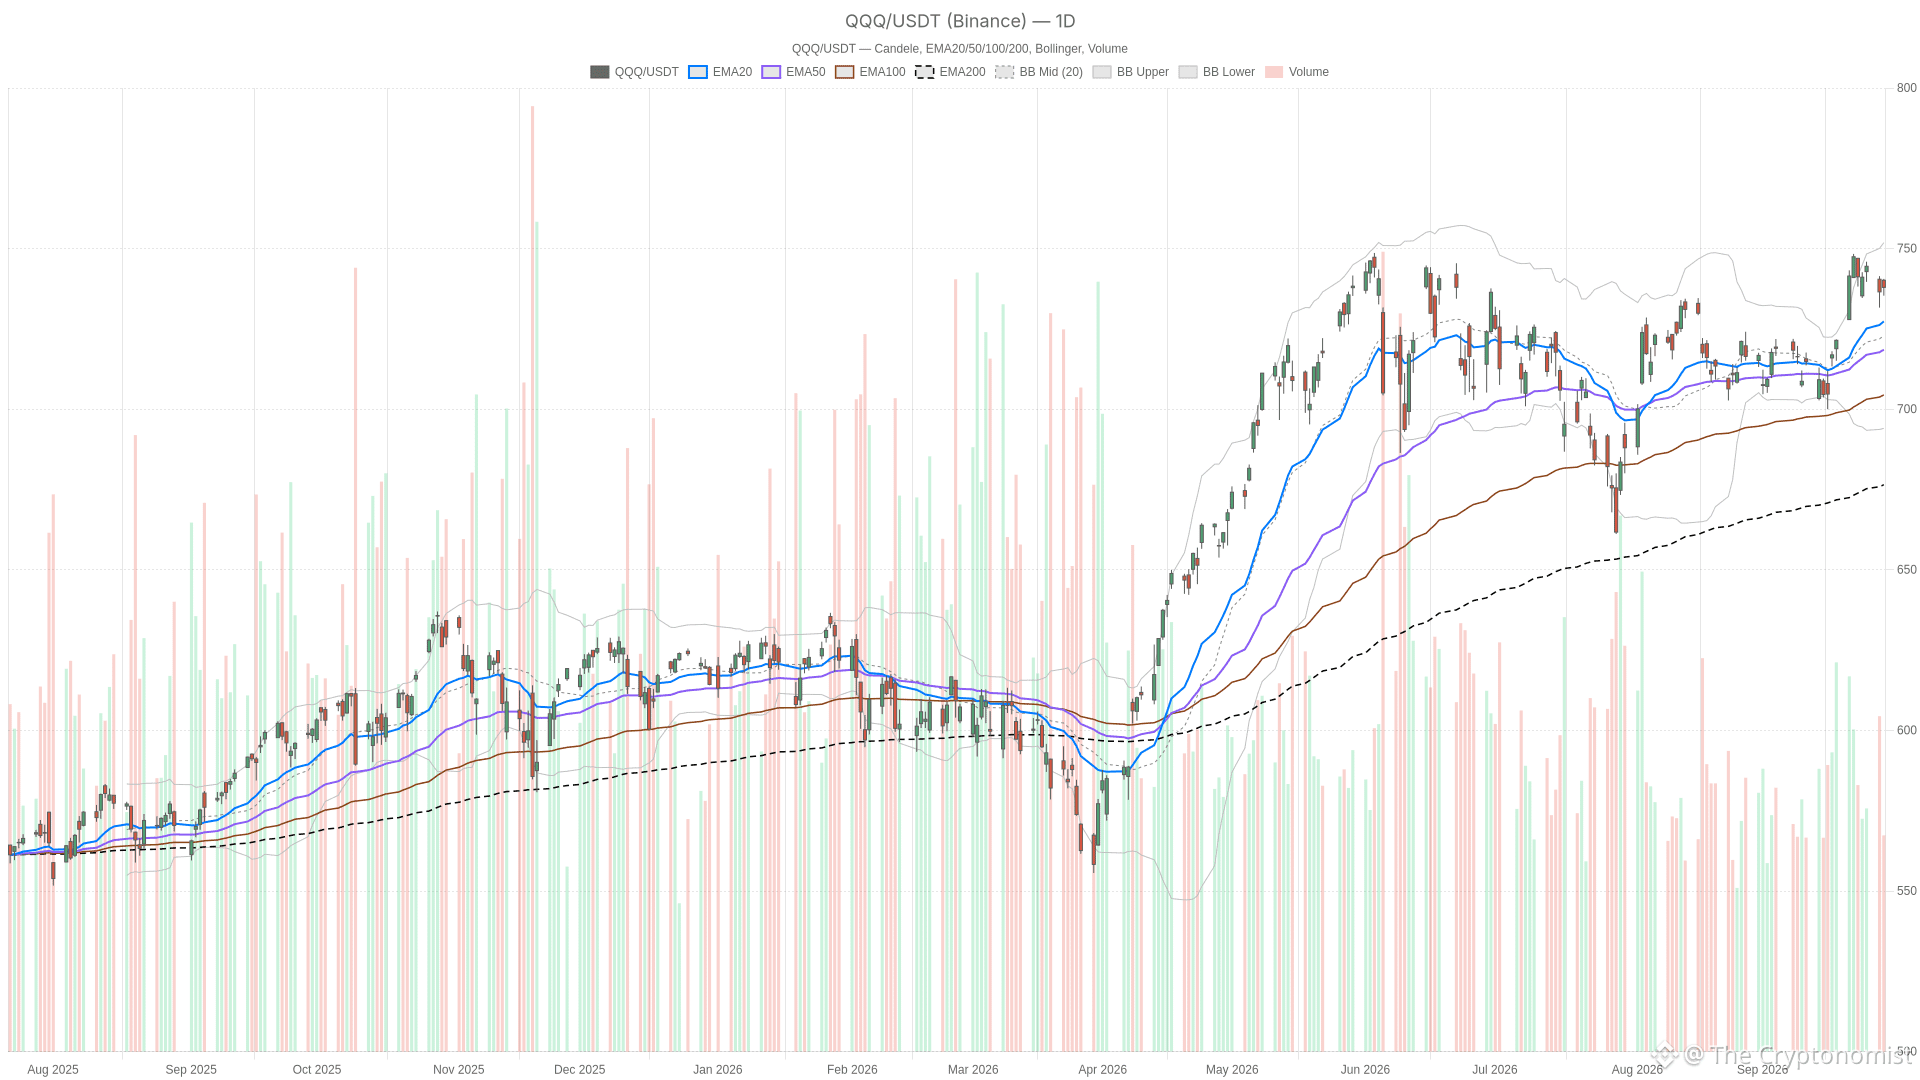 QQQ — daily chart with candlesticks, EMA20/EMA50 and volume.
Key takeaways
Invesco QQQ Trust stock closed at $737.93 on Tuesday, September 29, up 0.19% from Monday’s close of $736.53.
Daily EMAs remain bullishly stacked: the 20-day at $727.33 sits above the 50-day at $718.52 and the 200-day at $676.16.
Daily RSI at 59.21 reflects healthy bullish momentum without approaching overbought territory.
Hourly momentum is fading, with RSI at 48.73 and MACD turning negative, signaling short-term consolidation.
Key levels: resistance at $740.56 (R1) and support at $735.32 (S1), with the daily pivot at $737.95.
Invesco QQQ Trust Stock: Daily Structure Stays Bullish
The daily chart for Invesco QQQ Trust stock remains unequivocally bullish. Price holds above all three major EMAs in a clean bullish stack. The 20-day EMA at $727.33 sits above the 50-day EMA at $718.52. The 50-day, in turn, sits above the 200-day EMA at $676.16. This alignment confirms the broader uptrend that has carried the fund to new highs.
Notably, momentum backs up the structure. The 14-day RSI reads 59.21, comfortably in bullish territory but far from overbought. MACD is positive, with the line at 7.40 above the signal at 5.23 and a histogram of 2.16. That configuration indicates upside momentum remains intact, even if it is not accelerating sharply.
Meanwhile, Bollinger Bands add context on volatility. The mid-band sits at $722.94, the upper band at $751.85, and the lower band at $694.03. Tuesday’s close near $737.93 sits comfortably between the mid and upper bands. That leaves room to the upside before the band itself becomes a constraint. The 14-day ATR of 9.46 points to typical daily ranges of roughly that magnitude.
Finally, the daily pivot point sits at $737.95, essentially matching Tuesday’s close. Resistance at $740.56 (R1) and support at $735.32 (S1) frame a narrow band. The market will need to break decisively out of that range to signal its next directional move.
Invesco QQQ Trust Stock: Hourly Momentum Loses Steam
The hourly chart shows Invesco QQQ Trust stock in a short-term pause. Price has slipped below its 20-hour EMA, signaling stalled intraday momentum within an otherwise constructive longer structure. It closed at $737.96, just below the 20-hour EMA of $738.52. However, it still trades above the 50-hour EMA at $736.03 and the 200-hour EMA at $724.15. This is not a clean bullish stack. Instead, price is sandwiched between short and medium averages. The intraday trend has stalled even as the longer hourly structure stays constructive.
Momentum confirms the pause. The hourly RSI sits at 48.73, right at the neutral midpoint. MACD has turned negative, with the line at -0.39 below the signal at -0.09 and a histogram of -0.30. In contrast to the daily chart’s clear bullish push, the hourly timeframe shows momentum fading rather than building.
This is the core conflict in the current setup. The daily trend remains firmly bullish, supported by stacked EMAs and positive MACD. Meanwhile, the hourly timeframe shows a market that has lost short-term drive. It is consolidating rather than extending. Neither signal invalidates the other. They simply describe different time horizons of the same move: a strong trend catching its breath.
15-Minute Chart: Tight Consolidation at the Pivot
The 15-minute chart shows QQQ in an exceptionally tight range, coiling right at the pivot point. Volatility has compressed sharply, with Bollinger Bands spanning just a few dollars. Price closed at $737.96, above its 20-period EMA of $737.56 but just below the 50-period EMA at $738.02. It still sits above the 200-period EMA at $733.45. RSI at 52.22 and a modestly positive MACD histogram of 0.17 point to a slight bullish tilt within an otherwise flat short-term structure.
Bollinger Bands here are notably narrow. The upper band sits at $739.02 and the lower band at $735.41, a range of just a few dollars. The 15-minute ATR of 1.34 confirms that intraday volatility has compressed sharply. Both the 15-minute and hourly pivot points sit at $737.97, essentially identical to the last traded price. Therefore, the market appears coiled right at a decision point rather than trending in either direction.
Bullish Scenario
The bullish case hinges on the daily structure holding firm. A break above the daily R1 at $740.56 would be the first encouraging signal for a continuation toward new highs. If the hourly RSI recovers back above 50 and the hourly MACD histogram turns positive, that combination would carry weight. It would suggest the recent pause was just a pause, not a reversal.
With stacked daily EMAs and a Bollinger setup still leaving room toward $751.85, the path of least resistance stays up. Renewed buying could push the fund toward fresh highs without needing a sharp drop in volatility.
Bearish Scenario
The bearish case requires more than intraday hesitation to gain traction. A daily close below the S1 support at $735.32 would be the first warning sign. A follow-up break of the 20-day EMA near $727.33 would signal that the uptrend is losing its footing.
Until that happens, the current hourly softness looks more like consolidation within an established trend than the start of a reversal. Still, with price pinned so close to the daily and hourly pivots, a decisive move in either direction would carry weight.
Valuation Debate and Secondary Context
Beyond the charts, QQQ’s run to new highs has renewed the valuation debate around Nasdaq-100 concentration. However, secondary commentary after Tuesday’s close focused on positioning choices rather than price action. A same-day Fool.com piece noted that the Nasdaq-100’s concentration of high-priced technology names “could make it a bit riskier” to track at current levels. That framing captures the debate around whether the fund is still a good buy after its advance.
Separately, after Tuesday’s close, additional coverage compared the fund against alternatives. One Fool.com article highlighted that the fund has “significantly outperformed the S&P 500 index” over a ten-year holding period. Meanwhile, a Yahoo Finance piece examined how trading spreads on the fund can offset the lower expense ratio of its sibling, QQQM. These pieces speak to positioning choices rather than to Tuesday’s price action itself.
Closing Thoughts
Overall, Invesco QQQ Trust stock remains in a well-defined uptrend on the daily timeframe. Momentum and trend indicators are aligned to the upside. Meanwhile, the hourly and 15-minute charts show a market taking a breather right at pivotal levels. Volatility is compressed and momentum is flat rather than falling. That combination often precedes a directional decision rather than a reversal, but it is not a guarantee.
Positioning here should account for the narrow range currently in play and the still-elevated valuation debate surrounding Nasdaq-100 exposure. A break of either the $740.56 resistance or the $735.32 support could set the tone for the sessions ahead.
FAQ
Is Invesco QQQ Trust stock still in an uptrend?
Yes. The daily chart shows a clean bullish EMA stack, with the 20-day at $727.33 above the 50-day at $718.52 and the 200-day at $676.16. The daily RSI at 59.21 and positive MACD confirm the uptrend remains firmly intact. The recent hourly softness is more consistent with consolidation than a reversal.
What are the key levels to watch for QQQ?
The daily pivot sits at $737.95, with resistance at $740.56 (R1) and support at $735.32 (S1). A break above $740.56 would reinforce the bullish case. A daily close below $735.32 would be the first warning. The 20-day EMA at $727.33 represents a more significant support level that would need to break to question the uptrend.
Why is hourly momentum fading while the daily trend stays bullish?
This divergence reflects different time horizons. The daily trend captures the broader direction, which remains up. The hourly chart captures short-term flow, where buying has paused. Hourly RSI at 48.73 and negative MACD show this pause. Such conflicts are common in established trends and often resolve in the direction of the higher timeframe.
Does the valuation debate affect the technical outlook for QQQ?
Not directly. The valuation discussion, including Nasdaq-100 concentration concerns, frames sentiment but does not drive short-term price action. The technical structure — stacked EMAs, positive momentum, and compressed volatility at the pivot — provides a nearer-term guide. However, elevated valuations can amplify reactions to any technical breakdown.
Disclaimer: This article is for informational purposes only and does not constitute financial advice, an investment recommendation, or a solicitation to buy or sell any financial instrument or cryptocurrency. The analysis provided is not indicative of future results. Investing in crypto assets and financial markets carries a high risk of capital loss. Always do your own research (DYOR) and consult a qualified financial advisor before making any decision.
Article produced with the assistance of artificial intelligence and reviewed by the editorial team.