OG/USDT — Bullish Long Setup 📈
4H Chart | Bullish Structure
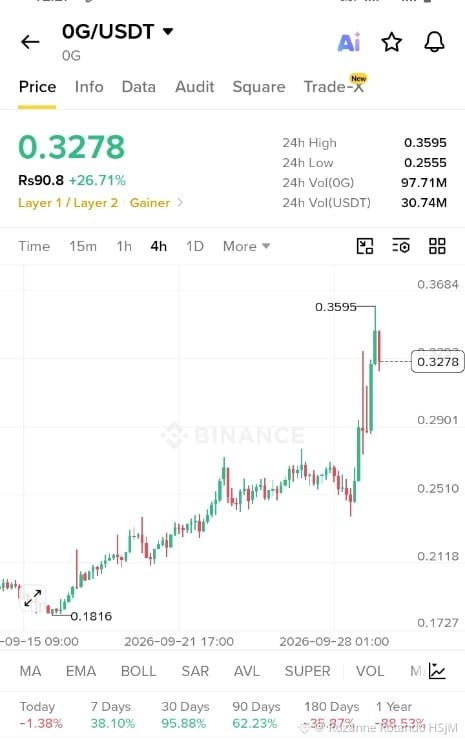
OG is showing strong upward momentum, with a breakout from the $0.25 consolidation zone toward $0.3595. The latest candles indicate a pullback after the sharp rally.
Current price
### $0.3278
24H High
$0.3595
24H Low
$0.2555
Chart timeframe
4H
Trend
Bullish
### Potential Long Trade
Entry on pullback
### $0.3100–$0.3200
Wait for a bullish reaction and support confirmation before entering.
Stop-loss
$0.2850
Take-profit targets
TP1
$0.3500
TP2
$0.3800
TP3
$0.4200
### Important Price Levels
| Level | Price |
| --------------------- | --------------- |
| Immediate resistance | $0.3500–$0.3595 |
| Breakout confirmation | $0.3600 |
| First support | $0.3100 |
| Strong support | $0.2900 |
| Major support | $0.2550 |
### Bullish Scenarios
* Continuation: A 4H close above $0.3595 could open a move toward $0.38 and $0.42.
* Healthy pullback: Holding $0.31–$0.32 may provide a potential continuation setup.
* Weakness: A breakdown below $0.2850 would weaken the bullish structure and expose the $0.2550 support area.
Risk management: OG has already made a substantial move from its recent lows. Avoid chasing the pump, consider scaling out at targets, and keep position size appropriate for the volatility.
4H Chart | Bullish Structure
OG is showing strong upward momentum, with a breakout from the $0.25 consolidation zone toward $0.3595. The latest candles indicate a pullback after the sharp rally.
Current price
### $0.3278
24H High
$0.3595
24H Low
$0.2555
Chart timeframe
4H
Trend
Bullish
### Potential Long Trade
Entry on pullback
### $0.3100–$0.3200
Wait for a bullish reaction and support confirmation before entering.
Stop-loss
$0.2850
Take-profit targets
TP1
$0.3500
TP2
$0.3800
TP3
$0.4200
### Important Price Levels
| Level | Price |
| --------------------- | --------------- |
| Immediate resistance | $0.3500–$0.3595 |
| Breakout confirmation | $0.3600 |
| First support | $0.3100 |
| Strong support | $0.2900 |
| Major support | $0.2550 |
### Bullish Scenarios
* Continuation: A 4H close above $0.3595 could open a move toward $0.38 and $0.42.
* Healthy pullback: Holding $0.31–$0.32 may provide a potential continuation setup.
* Weakness: A breakdown below $0.2850 would weaken the bullish structure and expose the $0.2550 support area.
Risk management: OG has already made a substantial move from its recent lows. Avoid chasing the pump, consider scaling out at targets, and keep position size appropriate for the volatility.