
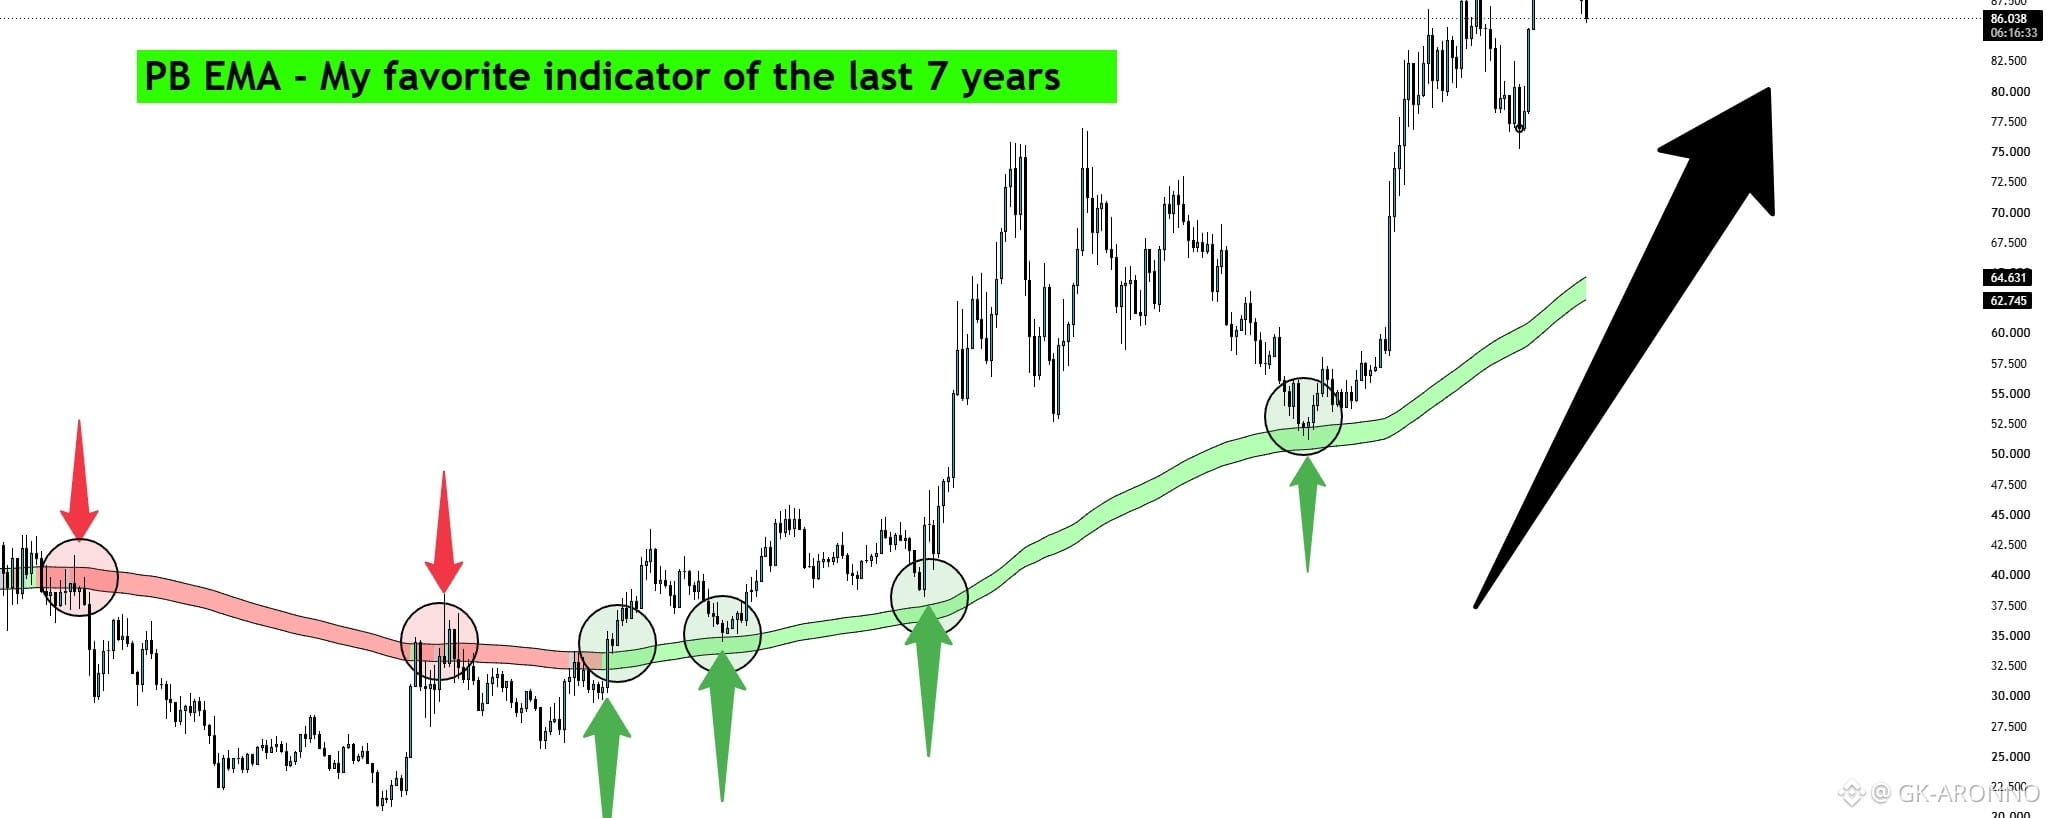
The PB EMA has been one of the few constants in my trading for the last seven years.
My approach to markets has changed substantially over that time. I’ve gone from lower-timeframe technical scalping to focusing much more on higher-timeframe structure, value, and broader market positioning. Through all of those changes, the PB EMA has remained part of my process.
The reason is simple: markets frequently rotate back toward areas of perceived value, and the PB EMA has consistently given me a framework for visualizing where that value may be developing.
I use it less as a traditional “buy or sell” indicator and more as a way to understand trend, extension, and potential mean reversion. It can help identify when price is becoming stretched away from value, when I may want to reduce exposure, and where I may begin looking for opportunities to re-enter.
I’ve particularly enjoyed using it on Hyperliquid markets because of how clearly these rotations can develop across both trending and consolidating conditions.
It is not perfect, and no indicator is. The value for me has been its consistency as a reference point while nearly every other part of my trading process has evolved.
Seven years later, it is still on my charts.


Artículo
PB EMA - Holy Grail of Market Value Reversion🔔🔔🔔
Aviso legal: Incluye opiniones de terceros. No es asesoramiento. Binance Ai puede utilizarse sin garantía. Consultar Términos y condiciones.