



Advanced Micro Devices (AMD) closed at $607.87 on September 28, down 3.61%, after briefly joining the $1 trillion market-cap club. The daily trend remains structurally bullish, but Monday’s sharp intraday reversal signals mounting short-term volatility as the stock digests multiple after-hours catalysts.
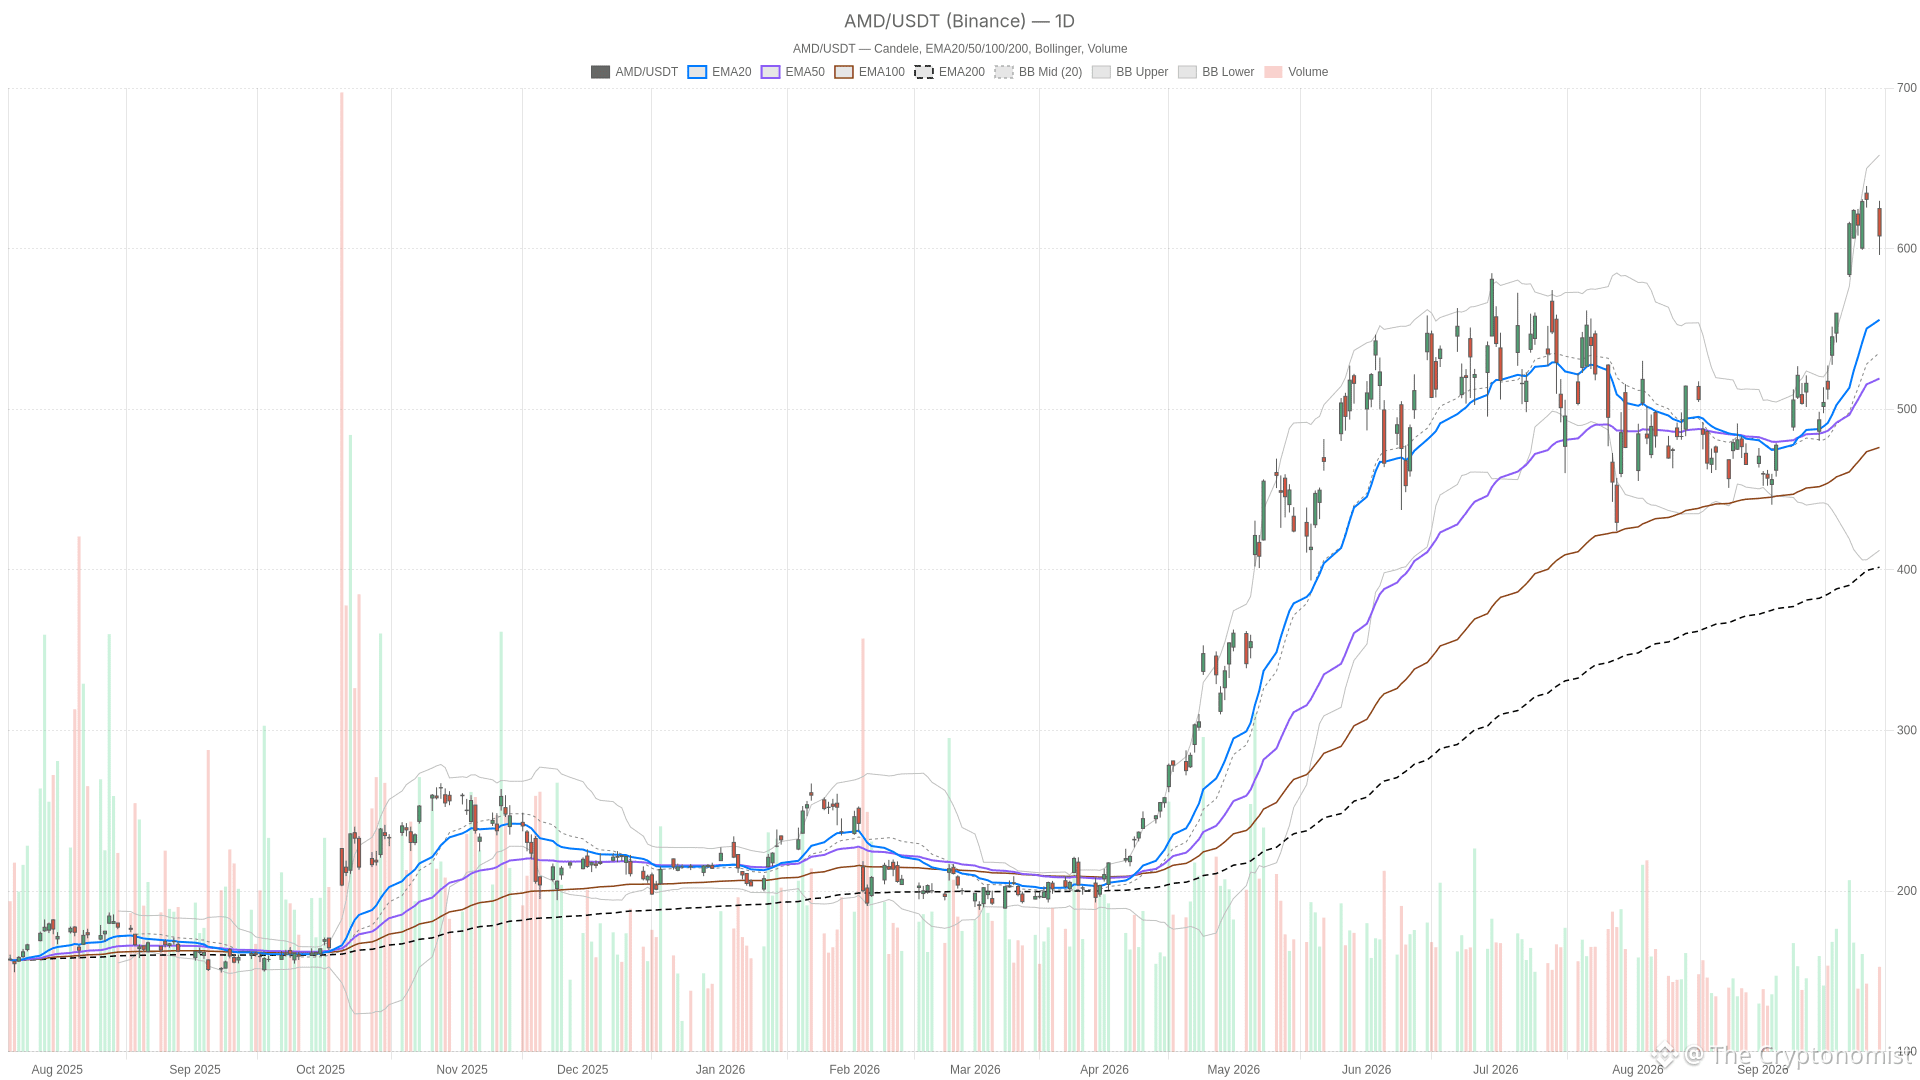 AMD — daily chart with candlesticks, EMA20/EMA50 and volume.
Key takeaways
AMD dropped 3.61% on September 28, closing at $607.87 after a wide-range session from $629.75 down to $596.07.
The daily EMA stack — EMA20 at $555.69, EMA50 at $519.10, EMA200 at $399.63 — confirms a firmly bullish regime.
Hourly MACD has flipped negative, creating a short-term momentum conflict against the intact daily trend.
AMD announced an $8.2 billion all-stock acquisition of World Labs after Monday’s close, its second-biggest deal on record.
Key levels to watch: daily pivot at $611.23 and support at $592.71.
Advanced Micro Devices Daily Trend: Bullish Structure Intact
AMD’s daily chart remains firmly in a bullish regime, with price holding well above all key exponential moving averages.
The EMA20 sits at $555.69, the EMA50 at $519.10, and the EMA200 at $399.63. This stacked alignment is a textbook bullish structure, confirmed by the system’s daily reading. RSI14 at 65.62 is elevated but not yet overbought, leaving room for further upside without an immediate momentum ceiling.
Daily Momentum Still Points Higher
MACD on the daily timeframe reinforces the bullish case. The MACD line at 36.36 sits above the signal line at 25.10, with a positive histogram of 11.27. Momentum continues to point higher on a trend-following basis. However, Monday’s drop was sharp, and the question now is whether that momentum can be sustained.
Volatility and Pivot Levels in Focus
Bollinger Bands show the mid-line at $535.22, with the upper band at $658.29 and the lower band at $412.14. Price closing at $607.87 is comfortably inside the upper half, suggesting the broader structure has not broken. It has simply pulled back from stretched levels.
Notably, ATR14 at 25.42 confirms that volatility has expanded meaningfully. A 3.61% daily move is consistent with an asset whose average true range has widened, not an anomaly. The daily pivot sits at $611.23, with resistance at $626.39 and support at $592.71. Monday’s close landed just below the pivot, testing the zone between the pivot and first support. That is the level to watch for whether this pullback stays shallow or deepens.
Hourly Momentum Cools for AMD Stock
AMD’s hourly chart shows short-term momentum has cooled, even as the medium-term structure remains intact.
Price at $607.86 trades below the hourly EMA20 of $614.19, though it remains above the EMA50 at $599.18 and the EMA200 at $538.11. That creates a mixed setup: still bullish on a medium-term hourly basis, but short-term direction has clearly weakened.
RSI14 on the 1H chart sits at 45.46, a neutral reading that leans slightly bearish rather than confirming the daily strength. Meanwhile, MACD on this timeframe tells a more decisive story. The line is flat at 0.00 against a signal line of 3.69, producing a negative histogram of -3.69. In short, hourly momentum has flipped negative even while the daily trend stays intact. This represents a genuine conflict between timeframes.
The hourly Bollinger Bands place the current price close to the lower band at $598.01, with the mid-line at $619.29. That reinforces the idea of a short-term corrective phase within a longer bullish daily trend. The hourly pivot at $607.51 almost exactly matches where price is trading, with R1 at $609.13 and S1 at $606.24 — a tight, undecided range.
15-Minute Execution: Watching the AMD Pivot
On the 15-minute chart, AMD sits in a coin-flip zone, with price hovering precisely around key pivot levels.
Price at $607.86 hovers around its EMA20 of $607.90, while sitting below the EMA50 of $612.94 and above the EMA200 of $591.21. RSI14 at 46.63 is neutral, matching the hourly reading and reinforcing indecision at this micro level.
MACD on the 15-minute chart shows the line at -2.35 versus a signal at -3.40, with a histogram of 1.05. That histogram is technically turning less negative — a subtle sign that downside momentum may be losing some steam intraday. The 15-minute pivot at $607.66 essentially coincides with current price, with R1 at $608.98 and S1 at $606.55. A clean move through R1 would favor buyers regaining control, while a break of S1 would extend the corrective move toward daily support at $592.71.
After-Hours Catalysts: World Labs Deal and AMD’s Trillion-Dollar Milestone
Several headlines broke after Monday’s close that will shape how the market approaches AMD’s next session, though they cannot explain the intraday decline.
AMD announced an $8.2 billion all-stock acquisition of World Labs, bringing in Fei-Fei Li and 3D spatial AI expertise. The deal ranks as the chipmaker’s second-biggest on record. Advanced Micro Devices had previously invested in World Labs ahead of this acquisition.
Separately, AMD briefly joined the $1 trillion market-cap club. Jim Cramer highlighted the milestone on CNBC, arguing the company’s run “isn’t over” as agentic AI drives demand for its high-end CPUs. At the same time, a Yahoo Finance piece flagged a valuation concern that could limit further upside from current levels.
Meanwhile, competitive pressure remains part of the narrative. Reporting on Broadcom’s custom silicon business points to a rival quietly building scale in the AI chip market. This serves as a reminder that AMD’s trillion-dollar status does not eliminate sector competition.
Bullish Scenario for Advanced Micro Devices
For the bullish case to reassert itself, AMD must hold above the daily EMA20 near $555.69 and reclaim the daily pivot at $611.23.
A push back above R1 at $626.39 would signal the pullback was simply a shakeout within an intact uptrend. Confirmation would come from RSI holding above 50 across timeframes. The hourly MACD histogram flipping positive again would add further conviction.
On the fundamental side, continued enthusiasm around agentic AI demand could provide narrative support. The strategic logic of the World Labs acquisition may also fuel a fresh leg toward the upper Bollinger Band at $658.29.
Bearish Scenario for AMD
The bearish risk centers on a decisive break below daily support at $592.71.
A close under that level, combined with RSI slipping below 50 on the daily chart, would invalidate the near-term bullish read. A daily MACD histogram turning negative would then open a path toward the EMA50 at $519.10.
In contrast, valuation concerns raised in the wake of the trillion-dollar milestone could add pressure. Any dilution perception from an all-stock deal of this size may further weigh on sentiment. Increased competitive attention on names like Broadcom in custom AI silicon adds another layer of uncertainty to the sector backdrop.
Final Take on Advanced Micro Devices Stock
Advanced Micro Devices remains in a structurally bullish daily trend, but Monday’s 3.61% drop and widening ATR signal sharply higher volatility.
The hourly momentum conflict pits soft MACD and neutral RSI against a still-bullish EMA stack. This suggests the market needs time to digest the pullback and the flurry of after-hours news. Positioning should account for this two-speed dynamic: daily trend intact, short-term momentum unsettled.
Given the width of the daily ATR and the proximity of price to key pivot levels, near-term action is likely to stay choppy. A clear directional signal awaits either a reclaim of the $611.23 pivot or a break of the $592.71 support.
FAQ
Is AMD stock still in a bullish trend?
AMD remains in a structurally bullish daily trend. Price sits well above the EMA20 at $555.69, EMA50 at $519.10, and EMA200 at $399.63, with daily RSI14 at 65.62 and MACD still positive.
What caused AMD’s 3.61% drop on September 28?
The drop occurred during the session itself and was not driven by after-hours news. It reflects a sharp intraday reversal from a high of $629.75 to a low of $596.07, consistent with expanded volatility as ATR14 widened to 25.42.
What is the World Labs acquisition and why does it matter?
AMD announced an $8.2 billion all-stock acquisition of World Labs, its second-biggest deal on record. The deal brings in Fei-Fei Li and 3D spatial AI expertise, potentially strengthening AMD’s AI capabilities.
What are the key price levels to watch for AMD?
The daily pivot at $611.23 and resistance at $626.39 are the immediate upside levels. Support sits at $592.71, with a break below opening a path toward the EMA50 at $519.10.
Disclaimer: This article is for informational purposes only and does not constitute financial advice, an investment recommendation, or a solicitation to buy or sell any financial instrument or cryptocurrency. The analysis provided is not indicative of future results. Investing in crypto assets and financial markets carries a high risk of capital loss. Always do your own research (DYOR) and consult a qualified financial advisor before making any decision.
Article produced with the assistance of artificial intelligence and reviewed by the editorial team.