

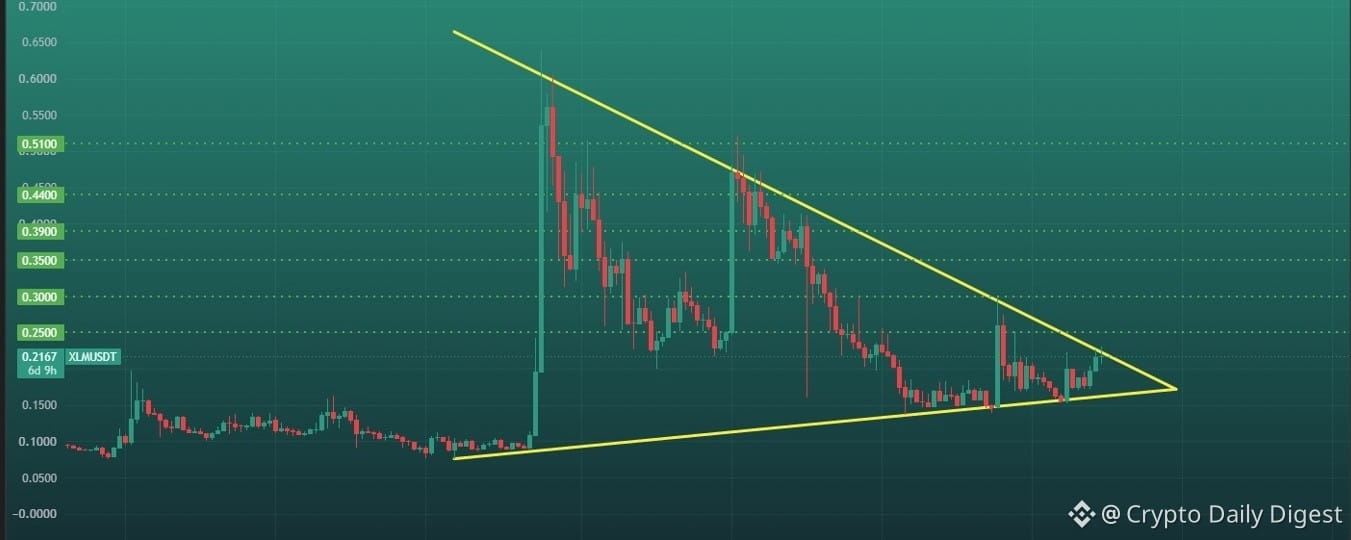

$XLM (Stellar Lumens/USDT) is consolidating tightly inside a multi-year Symmetrical Triangle pattern on the 1W chart! Price action is compressing toward the apex of this macro triangle, setting up a major structural breakout opportunity.
A decisive weekly candle close above diagonal resistance could trigger an explosive trend reversal back toward key multi-year horizontal levels! 🎯
---
💵 Coin: $XLM #XLM
📈 Pair: XLM/USDT
⏳ Time Frame: 1 Week (1W)
📐 Pattern: Symmetrical Triangle
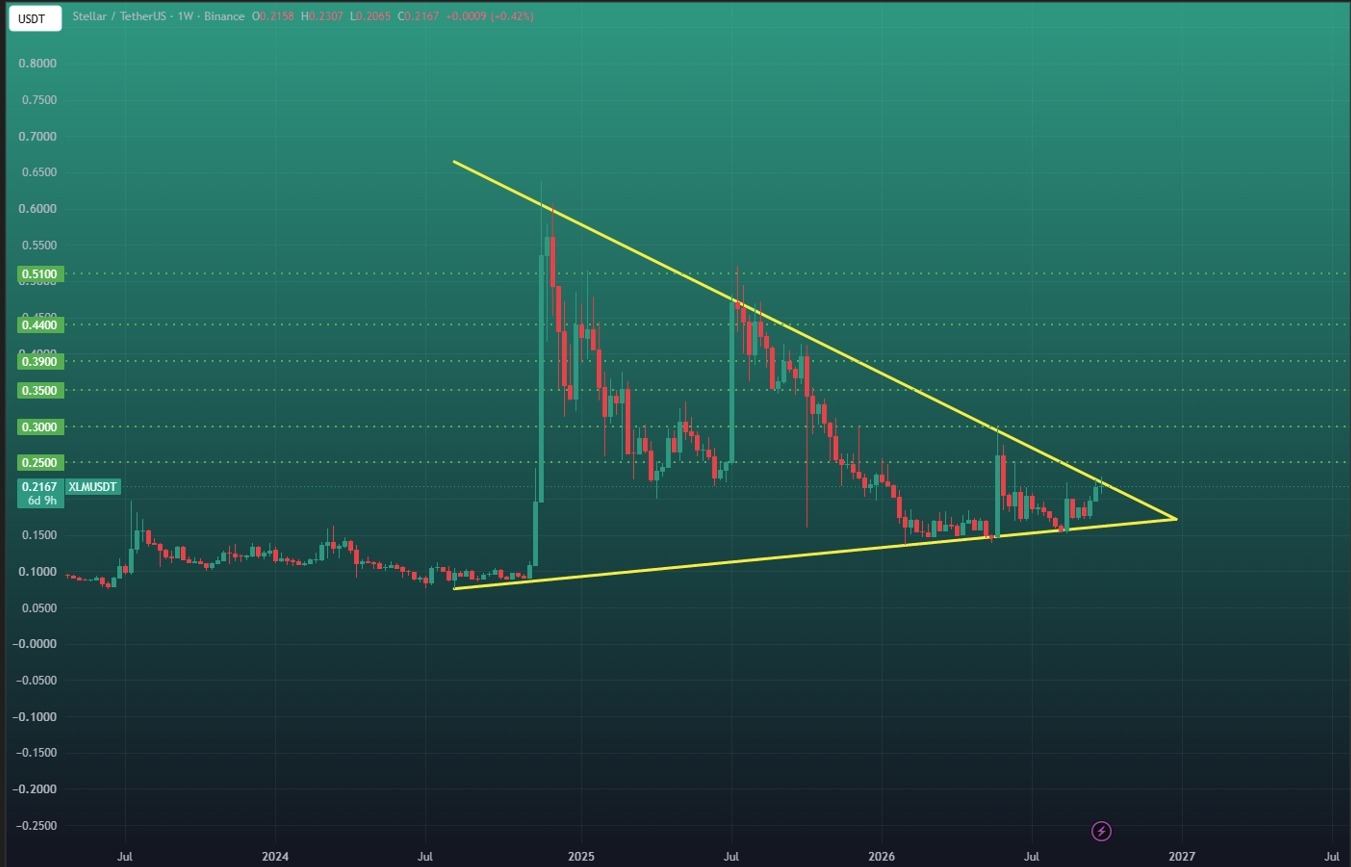
📍 Current Area: around $0.2167
🎯 Key Resistance Levels: 0.2500 → 0.3000 → 0.3500 → 0.4400 → 0.5100 → 0.6500
🛡️ Major Support: Ascending trendline below price
---
🔺 Pattern Description
📐 The XLM chart on the weekly time frame is showing a Symmetrical Triangle structure, formed by two converging trendlines:
🔻 Descending Resistance — Extends from the major cycle high near $0.6800 (late 2024), connecting lower highs through 2025 and 2026. This line has acted as macro dynamic overhead resistance for over nearly two years.
🔺 Ascending Support — Extends from the macro low around $0.0800 (July 2024), connecting a series of higher lows through 2025 and 2026 (~$0.1200 - $0.1500).
⚡ This structure indicates that volatility is being compressed as price moves closer to a key decision area.
💡 A Symmetrical Triangle is generally considered a continuation/breakout pattern, but the final direction cannot be confirmed until a breakout occurs.
---
🟢 Bullish Scenario
🚀 A sustained weekly candle close above 0.2300 – 0.2500 confirms a breakout from the multi-year symmetrical triangle.
📈 A successful breakout confirmation opens up major upside liquidity targets:
🎯 Target 1: 0.2500 (Triangle breakout validation / Immediate supply)
🎯 Target 2: 0.3000 – 0.3500 (Mid-range structural resistance)
🎯 Target 3: 0.4400 – 0.5100 (Major supply zone / 2025 swing high level)
🚀 Macro Target: 0.6300 (Multi-year pattern height projection)
🔄 After a breakout, a retest of the broken resistance could become an important area to watch for confirmation.
⚠️ If price only breaks the trendline intrawick but closes back inside the triangle, the breakout should be treated with caution as a potential false breakout.
---
🔴 Bearish Scenario
📉 The bearish scenario becomes more relevant if XLM loses the ascending support trendline.
❌ A weekly close below ascending support could indicate that the higher-low structure is beginning to break down.
⚠️ In this situation, the bullish triangle breakout setup could fail, potentially causing price to search for lower support levels.
🔻 Bearish confirmation would become stronger if the breakdown occurs with increased volume and price fails to reclaim the lost support area.
---
🧭 Key Levels
🟢 $0.2500 → First resistance / important breakout area
🟡 $0.3000 → Next resistance
🟠 $0.3500 → Medium-term resistance
🔵 $0.4400 → Next major resistance
🟣 $0.5100 → Major resistance
💎 $0.6374 → Major high shown on the chart
📍 $0.2167 → Approximate price area shown when the chart was created.
🎯 Summary
📊 XLM/USDT is coiling at the apex of a Multi-Year Symmetrical Triangle on the 1W timeframe.
🟢 Bullish: Weekly close above 0.2500 → Triggers high-timeframe expansion toward $0.3000 → $0.3500 → $0.3900 → $0.4400 → $0.5100 → $0.6374.
🔴 Bearish: Breakdown + weekly close below ascending support → could invalidate the triangle structure and increase the risk of further downside.
🎯 Confirmation levels are more important than a simple wick breakout. For a weekly setup like this, waiting for the candle close and observing the price reaction during a retest can help distinguish a valid breakout from a false breakout.
Keep a close eye on weekly volume confirmation—macro apex breakouts typically trigger fast, extended moves! 📈
⚠️ Disclaimer: Not Financial Advice (NFA). Always Do Your Own Research (DYOR) before entering any trade.
💬 Are you accumulating $XLM inside this macro apex or waiting for the weekly candle close above $0.25? Share your price targets below! 👇
#XLM #XLMUSDT #stellar #crypto #WeeklyBreakout #SymmetricalTriangle #Altcoins #TechnicalAnalysiss