🔻 $SOL
$SOL — $117 Zone May Be Coming
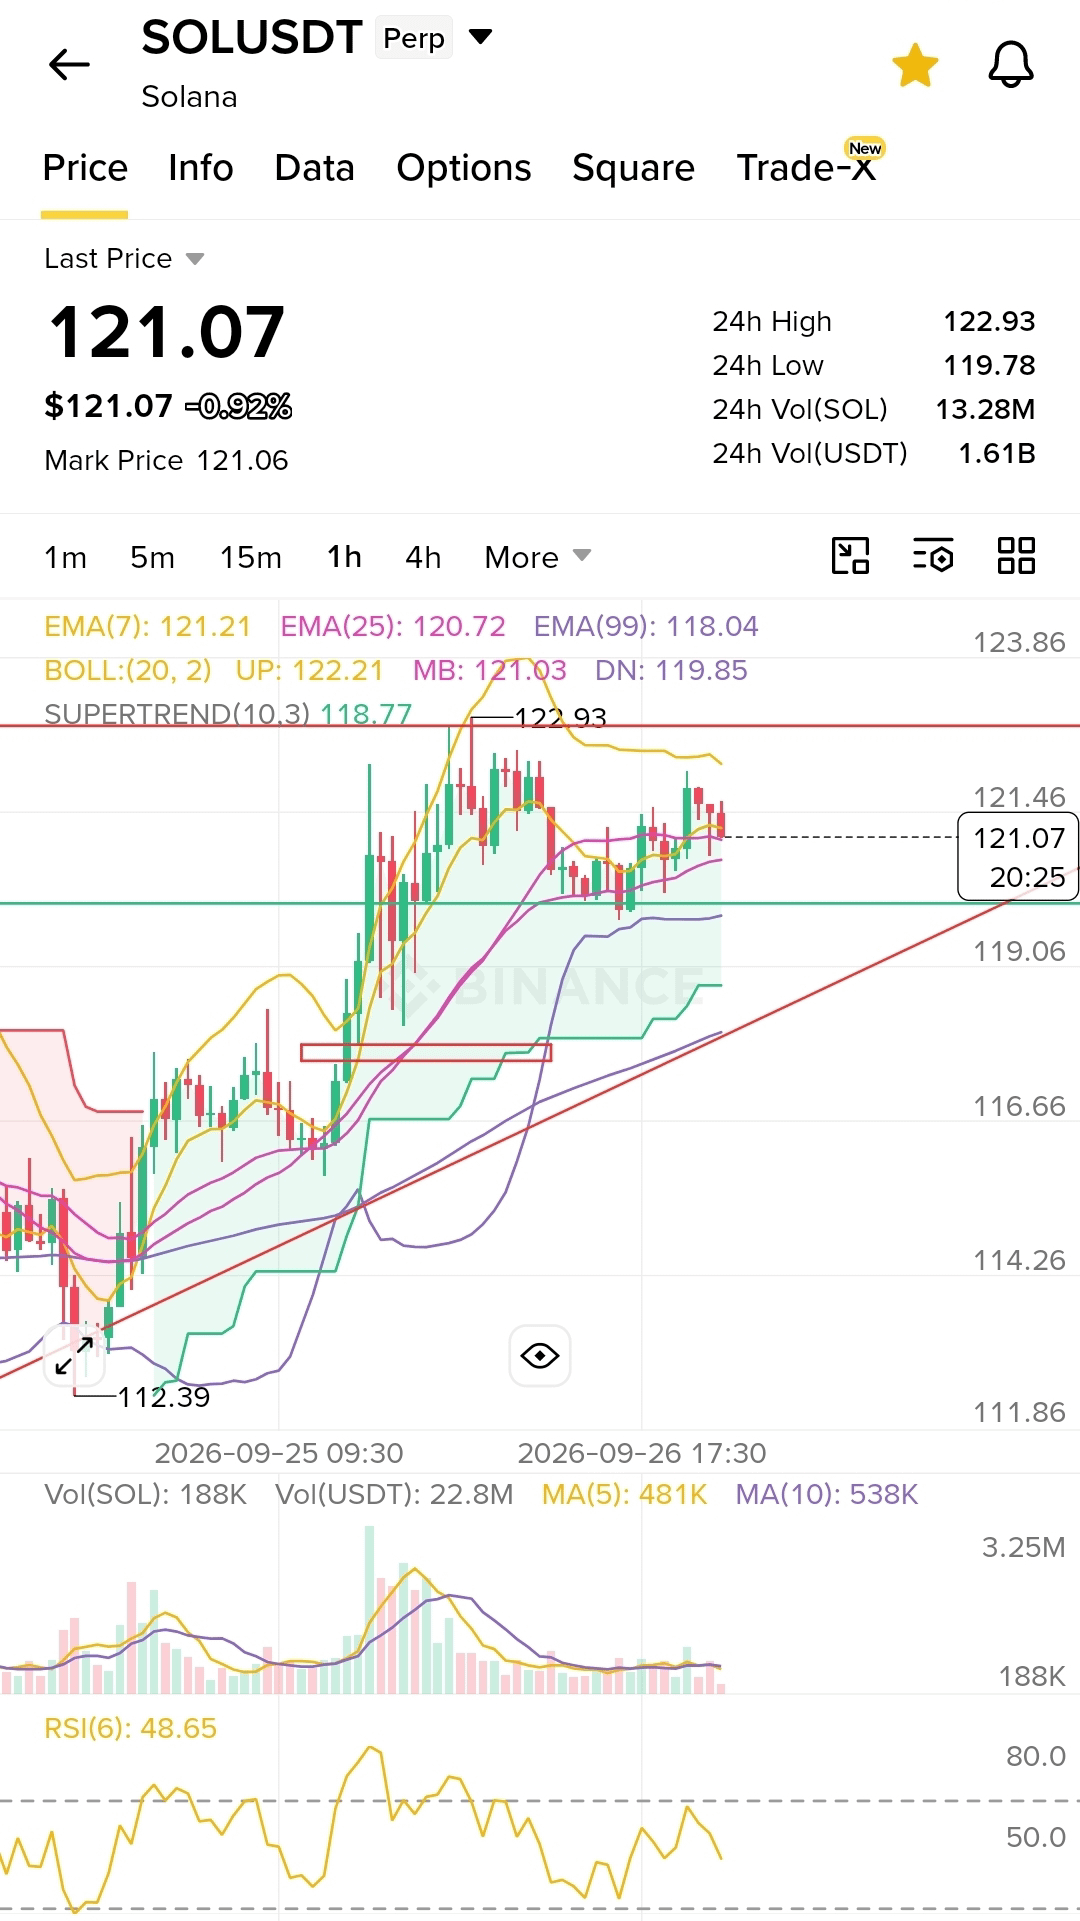
SOL is currently showing signs of short-term weakness after failing to maintain the recent highs around $122–$123. Price is trading near $121, but the momentum indicators are no longer supporting a strong bullish continuation.
On the 1H chart, SOL has repeatedly struggled around the $121.5–$123 resistance area. After the rejection from the $122.93 high, price has started moving sideways with lower momentum, while the RSI has dropped back toward the neutral zone.
The current setup is interesting because several signals are lining up:
📉 RSI: Around 48 — momentum is neutral-to-bearish and not showing strong buying pressure.
📉 MACD: The MACD remains slightly negative, with the bearish momentum still visible. A stronger downside move could develop if the histogram expands again.
📉 EMA structure: SOL is currently around the 7 EMA, while the 25 EMA is near $120.7. Losing this area with a strong candle could increase the probability of a deeper pullback.
📉 Bollinger Bands: The middle band is around $121, while the lower band is near $119.8. A break below the lower support area could open the way toward lower levels.
🎯 Key downside levels
$120 → First important support
$119 → Short-term support / breakdown area
$118 → Major technical support
$117 → Potential target zone
If SOL loses the $119–$120 support zone with strong selling volume, I would watch the $118–$117 area next. The $117 zone also becomes more interesting because it is close to the previous consolidation/support structure.
This doesn't mean SOL must immediately crash to $117. The key confirmation would be a clean breakdown below $119–$120 followed by a failed retest. If buyers reclaim the resistance and push SOL back above $122–$123, the bearish scenario could weaken considerably.
For now, the chart looks more like a potential pullback setup rather than a clean bullish continuation.
⚠️ Watch the $119–$120 zone closely.
If that support breaks, $117 could become the next major area to watch.
NFA . DYOR.
$SOL — $117 Zone May Be Coming
SOL is currently showing signs of short-term weakness after failing to maintain the recent highs around $122–$123. Price is trading near $121, but the momentum indicators are no longer supporting a strong bullish continuation.
On the 1H chart, SOL has repeatedly struggled around the $121.5–$123 resistance area. After the rejection from the $122.93 high, price has started moving sideways with lower momentum, while the RSI has dropped back toward the neutral zone.
The current setup is interesting because several signals are lining up:
📉 RSI: Around 48 — momentum is neutral-to-bearish and not showing strong buying pressure.
📉 MACD: The MACD remains slightly negative, with the bearish momentum still visible. A stronger downside move could develop if the histogram expands again.
📉 EMA structure: SOL is currently around the 7 EMA, while the 25 EMA is near $120.7. Losing this area with a strong candle could increase the probability of a deeper pullback.
📉 Bollinger Bands: The middle band is around $121, while the lower band is near $119.8. A break below the lower support area could open the way toward lower levels.
🎯 Key downside levels
$120 → First important support
$119 → Short-term support / breakdown area
$118 → Major technical support
$117 → Potential target zone
If SOL loses the $119–$120 support zone with strong selling volume, I would watch the $118–$117 area next. The $117 zone also becomes more interesting because it is close to the previous consolidation/support structure.
This doesn't mean SOL must immediately crash to $117. The key confirmation would be a clean breakdown below $119–$120 followed by a failed retest. If buyers reclaim the resistance and push SOL back above $122–$123, the bearish scenario could weaken considerably.
For now, the chart looks more like a potential pullback setup rather than a clean bullish continuation.
⚠️ Watch the $119–$120 zone closely.
If that support breaks, $117 could become the next major area to watch.
NFA . DYOR.