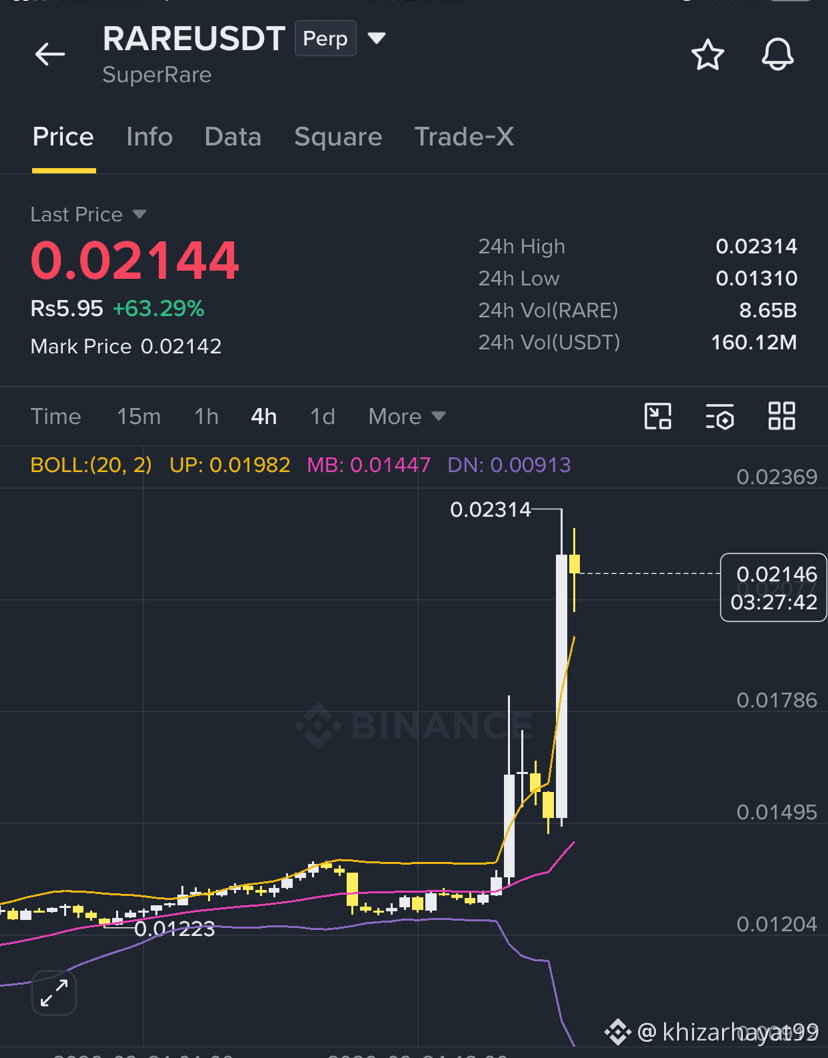
When assessing $RARE /USDT around the $0.021 mark on the 4-hour timeframe, price action trades near local structural overheads after a sharp rebound from macro sub-$0.015 consolidation lows.
Here is the 4-hour technical setup, key levels, and operational scenario planning:
4-Hour Technical Structure
Trend & Momentum: The 4-hour trend shows a short-term bullish recovery structure (higher highs and higher lows) breaking out of macro falling channels. However, approaching $0.021–$0.022 tests local supply/resistance zone, making momentum indicators like RSI border on overbought territory on lower timeframes.
Volume Profile: Volume typically expands on bullish impulse candles toward $0.021+. A sustained period above $0.021 with contracting volume signals potential exhaustion, requiring a retest of underlying support before further upside.
Key Moving Averages (4H):
20 EMA & 50 EMA provide dynamic trend support on pullbacks.
200 EMA serves as a major trend definition level. A clean hold above the 200 EMA on the 4H chart confirms short-to-medium-term structural strength.
Key Price Levels
Level Type Price Target (USDT) Significance
Major Resistance (Target 2) $0.0250 – $0.0265 Next macro liquidity zone and key structural swing high.
Immediate Resistance (Target 1) $0.0225 – $0.0232 Immediate swing high supply zone; breakout confirmation level.
Current Pivot / Equilibrium $0.0210 Key consolidation junction.
Immediate Support $0.0192 – $0.0198 Confluence of 20/50 EMA on 4H; key area for pullback buyers.
Invalidation / Major Support $0.0175 – $0.0180 Structural support low; breaking below resets local bullish bias.
Technical Scenarios
1. Bullish Continuation (Breakout Scenario)
Trigger: A 4-hour candle body close above $0.0225 accompanied by above-average volume.
Upside Targets: First target at $0.0250, followed by extended targets near $0.0285.
Risk Management: Invalidation/stop-loss placed below the breakout consolidation low around $0.0202.
Here is the 4-hour technical setup, key levels, and operational scenario planning:
4-Hour Technical Structure
Trend & Momentum: The 4-hour trend shows a short-term bullish recovery structure (higher highs and higher lows) breaking out of macro falling channels. However, approaching $0.021–$0.022 tests local supply/resistance zone, making momentum indicators like RSI border on overbought territory on lower timeframes.
Volume Profile: Volume typically expands on bullish impulse candles toward $0.021+. A sustained period above $0.021 with contracting volume signals potential exhaustion, requiring a retest of underlying support before further upside.
Key Moving Averages (4H):
20 EMA & 50 EMA provide dynamic trend support on pullbacks.
200 EMA serves as a major trend definition level. A clean hold above the 200 EMA on the 4H chart confirms short-to-medium-term structural strength.
Key Price Levels
Level Type Price Target (USDT) Significance
Major Resistance (Target 2) $0.0250 – $0.0265 Next macro liquidity zone and key structural swing high.
Immediate Resistance (Target 1) $0.0225 – $0.0232 Immediate swing high supply zone; breakout confirmation level.
Current Pivot / Equilibrium $0.0210 Key consolidation junction.
Immediate Support $0.0192 – $0.0198 Confluence of 20/50 EMA on 4H; key area for pullback buyers.
Invalidation / Major Support $0.0175 – $0.0180 Structural support low; breaking below resets local bullish bias.
Technical Scenarios
1. Bullish Continuation (Breakout Scenario)
Trigger: A 4-hour candle body close above $0.0225 accompanied by above-average volume.
Upside Targets: First target at $0.0250, followed by extended targets near $0.0285.
Risk Management: Invalidation/stop-loss placed below the breakout consolidation low around $0.0202.