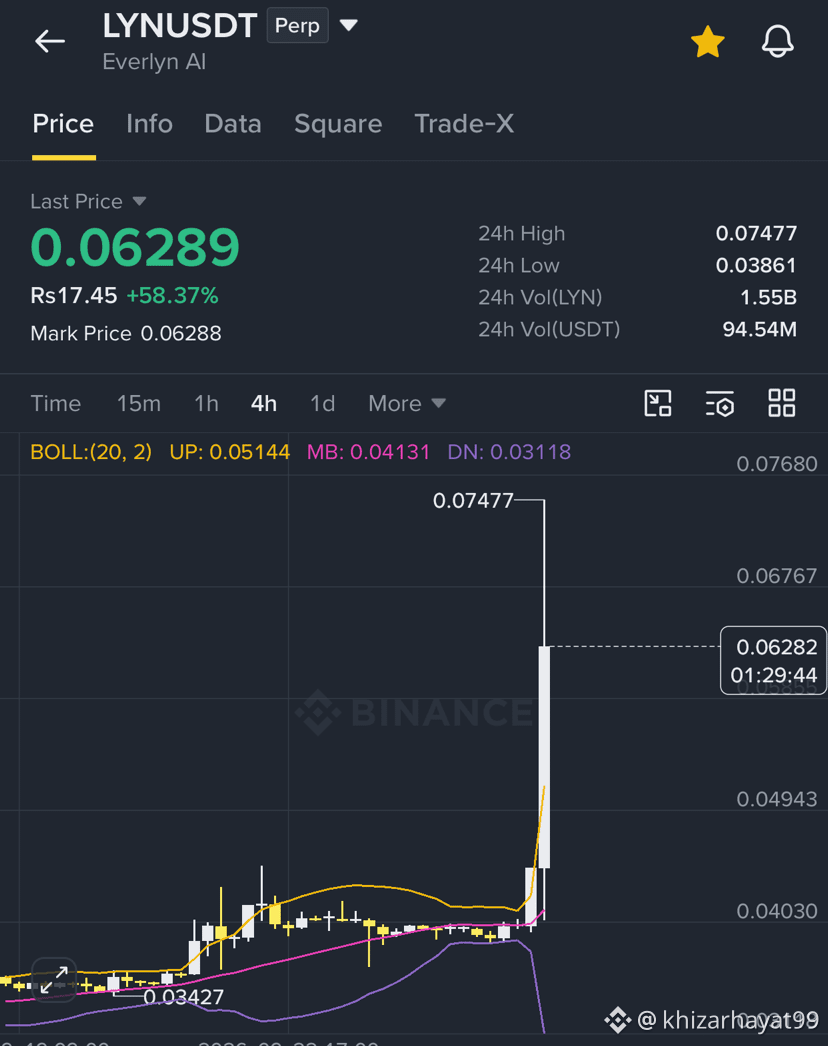
$LYN Evaluating LYN/USDT (Everlyn AI) near 0.063 USDT puts the token right at a major intermediate supply zone and potential trend-reversal trigger.
Key Technical Structure ($0.063 Zone)
Horizontal Resistance ($0.062 – $0.065): $0.063 serves as a prominent mid-range pivot level. Sustained 4H candle acceptance above $0.065 signals a structural breakout from local consolidation.
Primary Demand / Support ($0.052 – $0.055): The nearest high-volume node and safety net below the current price.
Macro Downside Support ($0.040 – $0.044): Lower structural support where buyers historically step in to defend against deeper sell-offs.
TradingView
Recommended Trading Setups
Setup A: Breakout & Retest (Bullish Momentum)
Trigger: Wait for a 4H candle close above 0.0650 USDT on expanding volume.
Entry Zone: 0.0615 – 0.0635 USDT on a controlled pullback.
Stop-Loss (SL): Below the breakout base at 0.0570 USDT.
Take-Profit Targets:
TP1: 0.0770 USDT (Scale out 40%, move SL to breakeven)
TP2: 0.0920 USDT
TP3: 0.1100 USDT (Runner target)
Setup B: Dip Buy at Key Support (Better Risk/Reward)
Trigger: Rejection at $0.063 leading to a retest of the demand zone.
Entry Zone: 0.0520 – 0.0550 USDT.
Stop-Loss (SL): Below 0.0485 USDT (Invalidation).
Take-Profit Targets:
TP1: 0.0630 USDT (Current supply level)
TP2: 0.0770 USDT
Execution & Risk Guidelines
Volume Confirmation: Low-volume pushes above $0.063 carry a high risk of liquidity sweeps (fakeouts) followed by sharp pullbacks.
Indicator Checks: Watch for bullish divergence on the 4H RSI or a 20/50 EMA golden cross on the 1H/4H chart to confirm momentum before entering.
Would you like a risk-management calculation based on your leverage and account size?
Key Technical Structure ($0.063 Zone)
Horizontal Resistance ($0.062 – $0.065): $0.063 serves as a prominent mid-range pivot level. Sustained 4H candle acceptance above $0.065 signals a structural breakout from local consolidation.
Primary Demand / Support ($0.052 – $0.055): The nearest high-volume node and safety net below the current price.
Macro Downside Support ($0.040 – $0.044): Lower structural support where buyers historically step in to defend against deeper sell-offs.
TradingView
Recommended Trading Setups
Setup A: Breakout & Retest (Bullish Momentum)
Trigger: Wait for a 4H candle close above 0.0650 USDT on expanding volume.
Entry Zone: 0.0615 – 0.0635 USDT on a controlled pullback.
Stop-Loss (SL): Below the breakout base at 0.0570 USDT.
Take-Profit Targets:
TP1: 0.0770 USDT (Scale out 40%, move SL to breakeven)
TP2: 0.0920 USDT
TP3: 0.1100 USDT (Runner target)
Setup B: Dip Buy at Key Support (Better Risk/Reward)
Trigger: Rejection at $0.063 leading to a retest of the demand zone.
Entry Zone: 0.0520 – 0.0550 USDT.
Stop-Loss (SL): Below 0.0485 USDT (Invalidation).
Take-Profit Targets:
TP1: 0.0630 USDT (Current supply level)
TP2: 0.0770 USDT
Execution & Risk Guidelines
Volume Confirmation: Low-volume pushes above $0.063 carry a high risk of liquidity sweeps (fakeouts) followed by sharp pullbacks.
Indicator Checks: Watch for bullish divergence on the 4H RSI or a 20/50 EMA golden cross on the 1H/4H chart to confirm momentum before entering.
Would you like a risk-management calculation based on your leverage and account size?