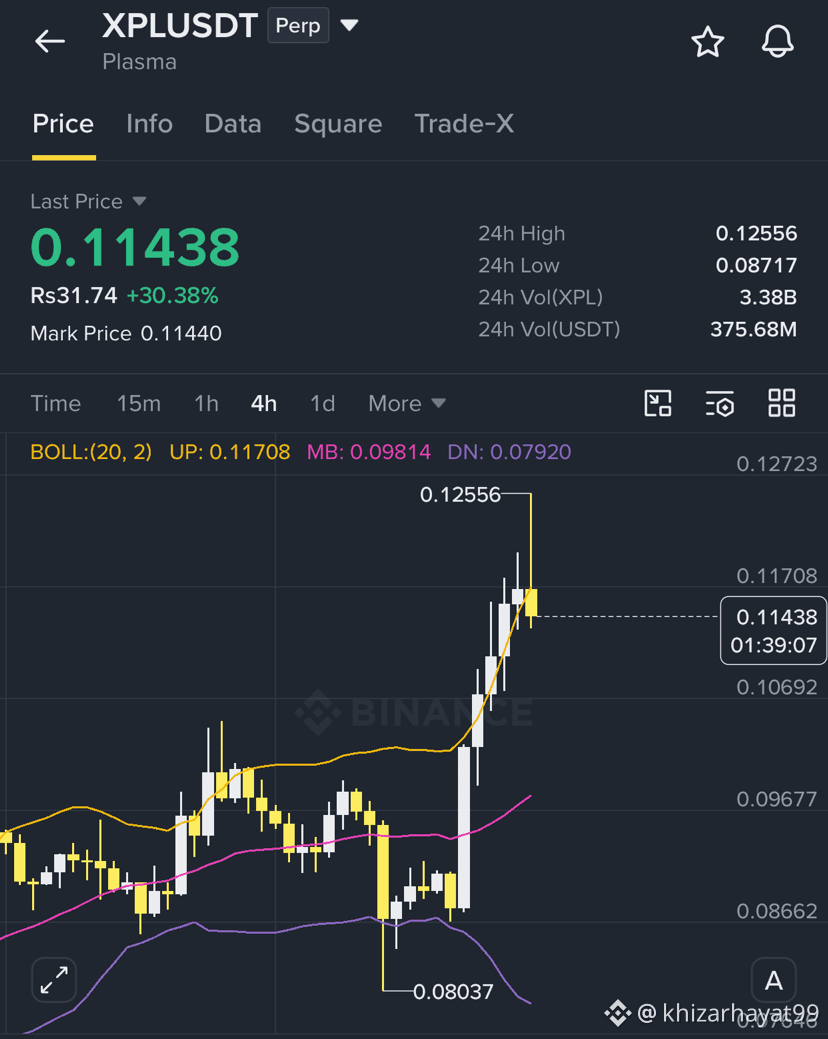
Evaluating a crypto futures or spot setup like $XPL LUSDT on a 4-hour chart around the 0.11 level requires strict risk management and technical alignment, especially given that real-time market prices fluctuate (currently trading near $0.089).
When analyzing a potential long setup targeting or breaking around 0.11 on a higher timeframe like the 4-hour chart, consider the following technical breakdown and execution framework:
Key Technical Considerations for a 4-Hour Long Setup
Market Structure: Confirm whether the 4-hour chart is forming a higher low (HL) and higher high (HH) pattern, or if 0.11 represents a major horizontal resistance/breakout level (neckline of a pattern or previous swing high).
Moving Averages & Trend: Look for price action holding above key moving averages (such as the 50 EMA or 200 EMA on the 4-hour timeframe) to validate sustained bullish momentum.
Volume Profile: A breakout toward or past 0.11 must be backed by expanding volume. Low-volume pushes often result in fakeouts.
Sample Risk & Trade Management Framework
If you are structuring a trade plan around this zone, a disciplined approach looks like this:
Entry Strategy:
Breakout Entry: Wait for a strong 4-hour candle close above the 0.11 resistance level with confirmation volume.
Retest Entry: Alternatively, wait for a breakout followed by a successful retest of 0.11 as new support.
Stop Loss (SL):
Place your stop loss safely below the most recent 4-hour swing low or beneath the local consolidation range (e.g., giving the trade enough room to breathe without risking capital on normal market noise).
Take Profit (TP) Targets:
TP1: Nearest minor resistance or 1:1 risk-to-reward ratio level.
TP2: Higher multi-week resistance structure.
Risk Note: Cryptocurrency derivatives involve substantial risk of loss. Always size your positions appropriately (e.g., risking no more than 1–2% of your total trading capital on a single setup) and account for funding rates if trading perpetual contracts.
When analyzing a potential long setup targeting or breaking around 0.11 on a higher timeframe like the 4-hour chart, consider the following technical breakdown and execution framework:
Key Technical Considerations for a 4-Hour Long Setup
Market Structure: Confirm whether the 4-hour chart is forming a higher low (HL) and higher high (HH) pattern, or if 0.11 represents a major horizontal resistance/breakout level (neckline of a pattern or previous swing high).
Moving Averages & Trend: Look for price action holding above key moving averages (such as the 50 EMA or 200 EMA on the 4-hour timeframe) to validate sustained bullish momentum.
Volume Profile: A breakout toward or past 0.11 must be backed by expanding volume. Low-volume pushes often result in fakeouts.
Sample Risk & Trade Management Framework
If you are structuring a trade plan around this zone, a disciplined approach looks like this:
Entry Strategy:
Breakout Entry: Wait for a strong 4-hour candle close above the 0.11 resistance level with confirmation volume.
Retest Entry: Alternatively, wait for a breakout followed by a successful retest of 0.11 as new support.
Stop Loss (SL):
Place your stop loss safely below the most recent 4-hour swing low or beneath the local consolidation range (e.g., giving the trade enough room to breathe without risking capital on normal market noise).
Take Profit (TP) Targets:
TP1: Nearest minor resistance or 1:1 risk-to-reward ratio level.
TP2: Higher multi-week resistance structure.
Risk Note: Cryptocurrency derivatives involve substantial risk of loss. Always size your positions appropriately (e.g., risking no more than 1–2% of your total trading capital on a single setup) and account for funding rates if trading perpetual contracts.